-

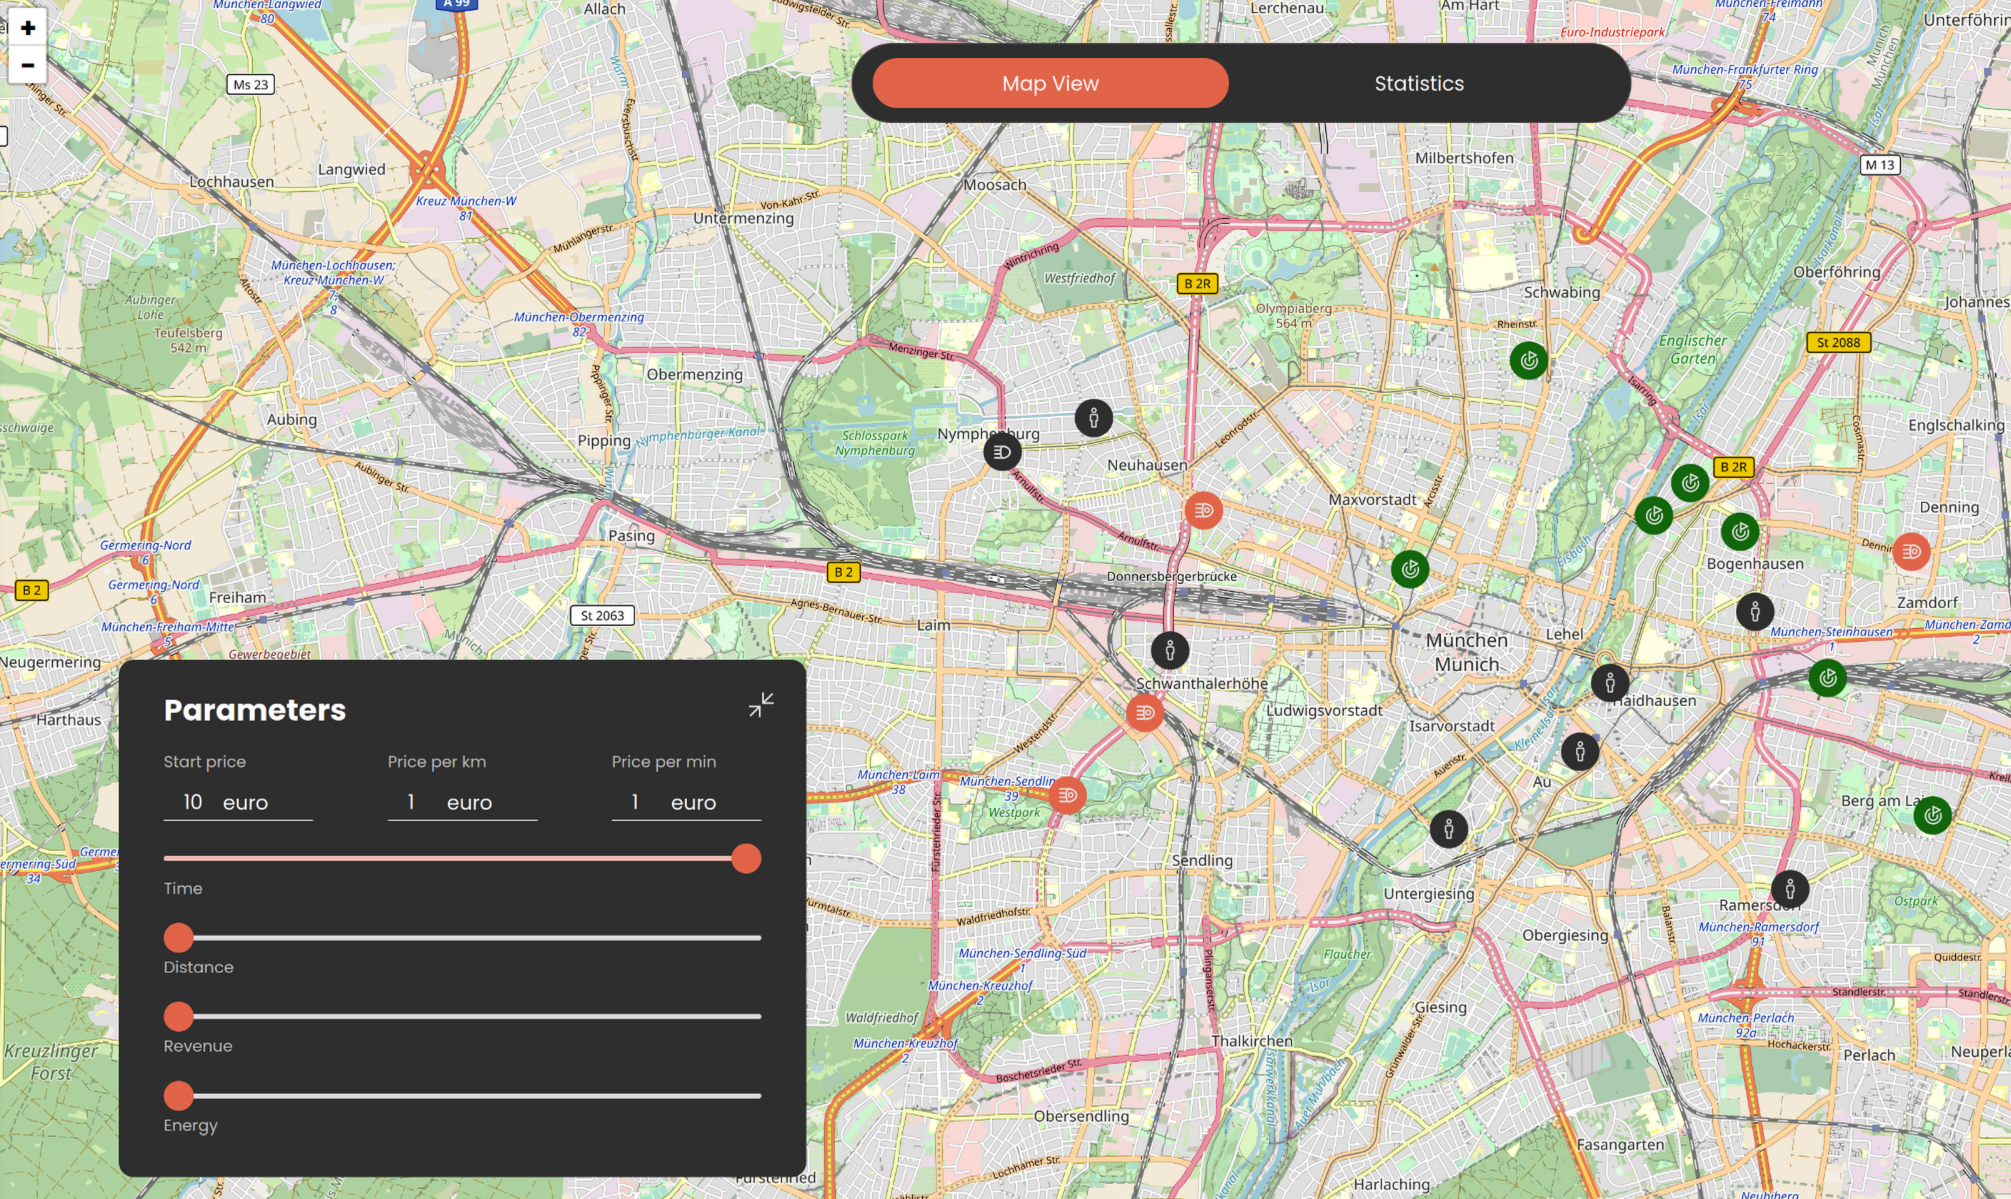
The main map view
-
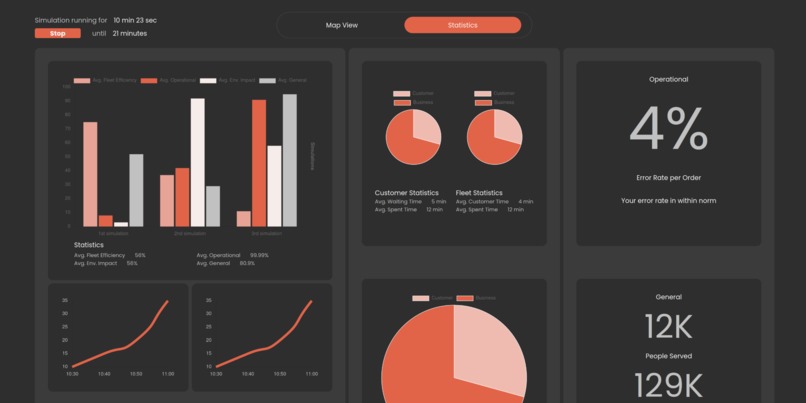
The statistics view

Inspiration
We were inspired by the beautiful morning sun after a long night of coding in the capital of fun.
What it does
We put a great deal into realism but also into state-of-the art UI/UX design. Read more on our focus in this section:
Realistic simulation of real-world navigation
We are using a locally hosted Openroutingservice instance to get ideal routes from one position to another. This means that we are bound by real-world traffic implications like speed limits, bridges, rivers or other limitations. Using the API, we extract distance and duration to reach a target which allows us to pose the end user with a tradeoff between those two later on.
Parametrized cost function
For our scheduling algorithm we have devised a parametrized cost function. It is based on:
distance: The real-world to be traveled distanceduration: The real-world ETArevenue: An anti-cost that is calculated with a base fee for any ride as well as a fee per traveled kilometer and/or minuteenergy_consumption: Not yet implemented! (We were missing real-world data)
These costs are then multiplied by weights assigned by the user. I.e. if the user was to set the weights to (1,0,0,0), the cost function would only measure distance. This way we let the customer influence and customize the result of our algorithm!
The algorithm
We used Mixed Integer Programming (MIP) to optimize vehicle routing by assigning customers to vehicles while minimizing both the total cost and the maximum cost across all routes. The algorithm balances competing objectives like distance, time, and revenue using a user-parametrized cost function. So the fleet manager can decide what he prioritizes.
How we built it
Frontend
Stack: Vite + React.js + Javascript + Tailwind Libraries: react-leaflet.js, chart.js, React-Router
We have implemented a single page application in javascript, React.js framework. Our application summarizes in two pages. First page is a map which is integrated from react-leaflet.js which we use as our visual guidance to track customers, picking-up points, occupied taxies, and free taxis. Each one of these entities have its own icon with diverse colors. The Managment user have the capability to pick from a multi constraint menu on the left-handside, what should be prioritized at the moment. For example, priorizing distance over revenue, or customer satisfaction over revenue, etc. You can identify those priorities using a slider bar. You could also click on the car entity and get some information concerning the car, along with a single standalone dashboard embedded there; You could run a scenario in which you will be able to visualize real life world traffic. About the second page, it is mainly about statistics where there exist there variety of dashboards, which can be used to simuletanously monitor different metrics.
Backend
The backend is built in Python.
Challenges we ran into
One of the hardest challenge to us was probably the integration at the end. Connecting Frontend and Backend after over 24h of separated work proved to be difficult. Also we sadly not able to implement every one of our ideas within the time frame. The biggest challenge though was sleep deprivation... :(
Accomplishments that we're proud of
We're proud to have completed the challenge! Everyone is happy to have completed a valuable part of the project. To be able to overcome struggles, lead valuable discussions, ideate and prototype all together in a respectful manner as a team made us extremely proud. And we had a lot of fun on the way!
What we learned
We learned about the true power of open source and free software. Also we learned to trust in our abilities as a team.
What's next for OptiFleet
We have interesting ideas on the usage of AI in future releases of OptiFleet. But more on that in the presentation!

Log in or sign up for Devpost to join the conversation.