-
-
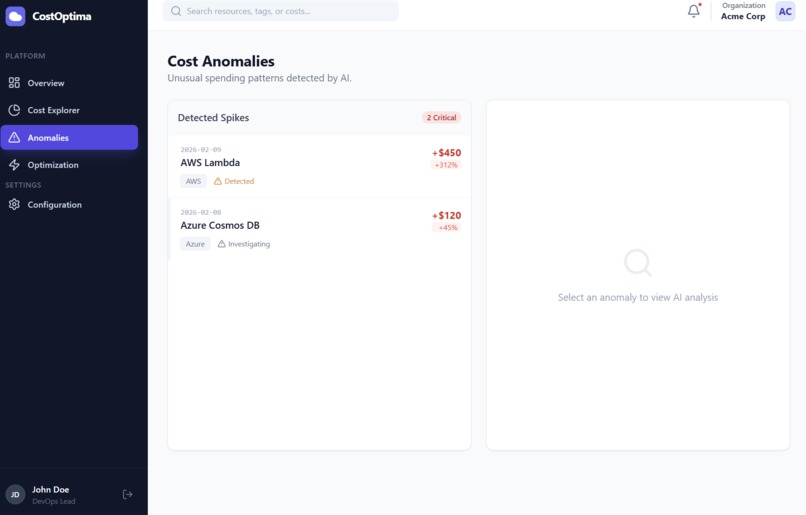
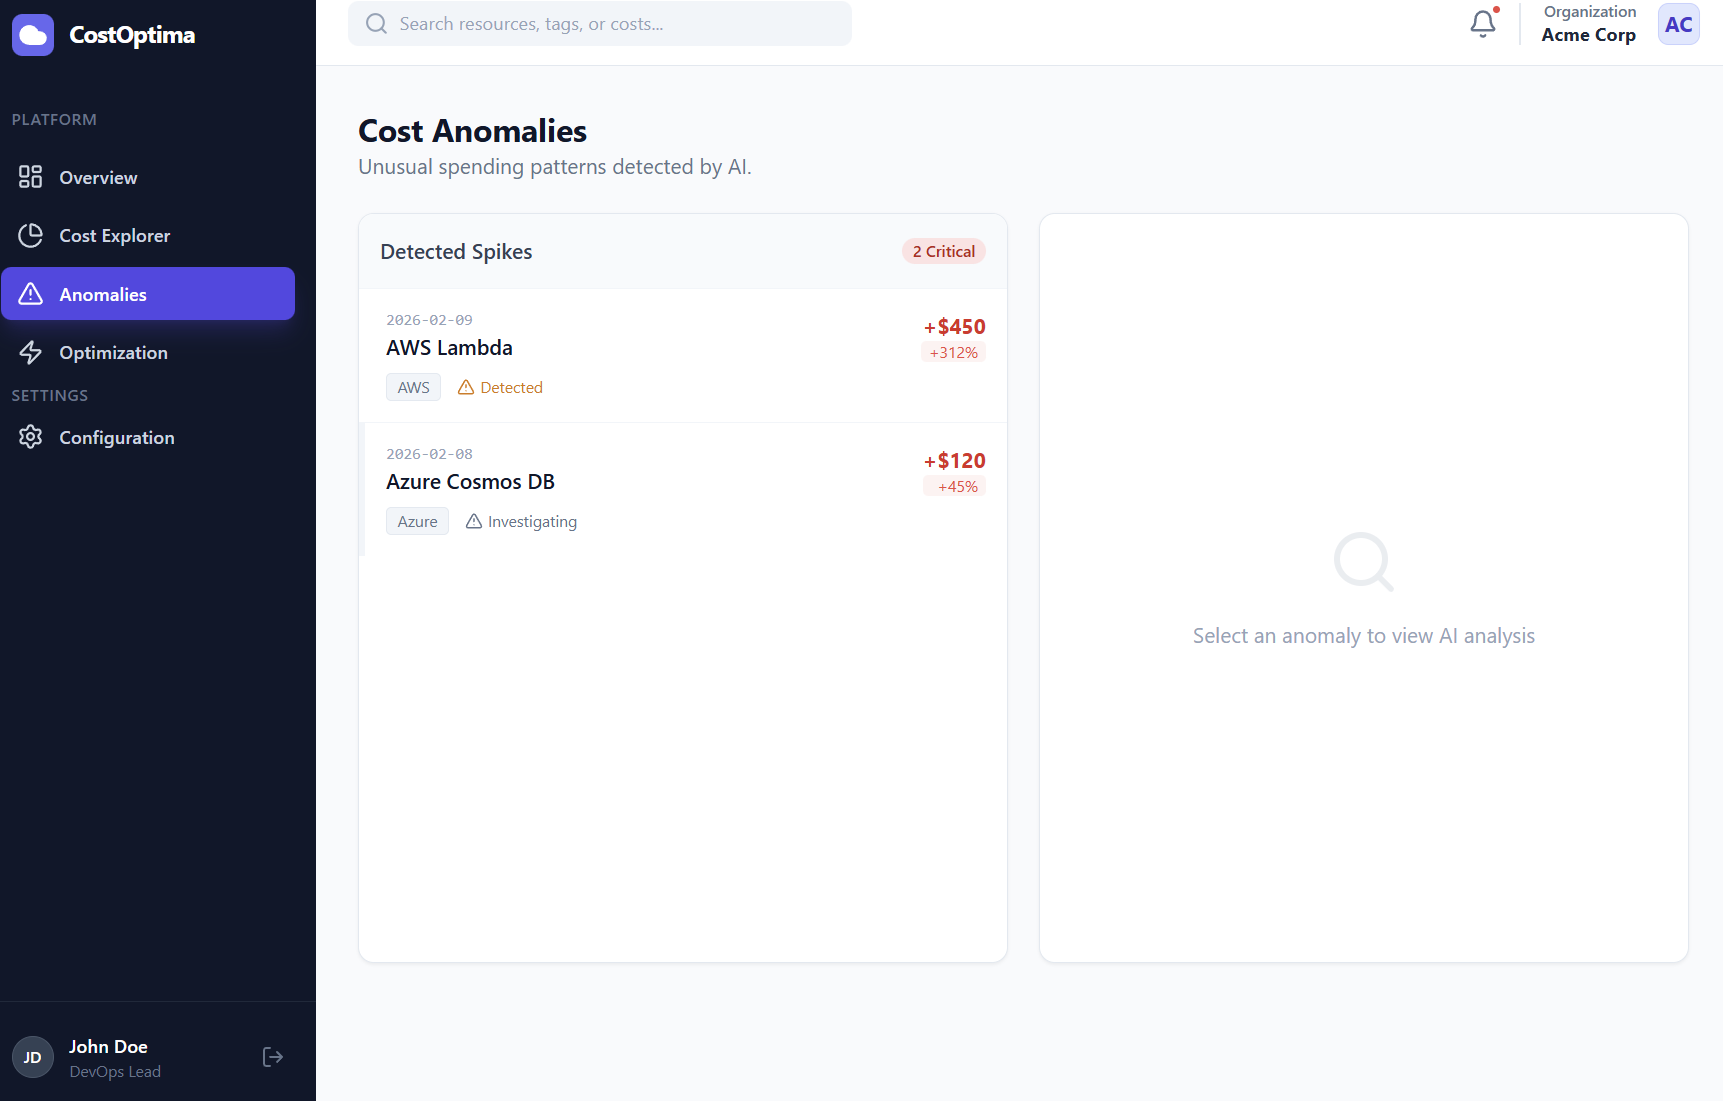
Anomalies
-
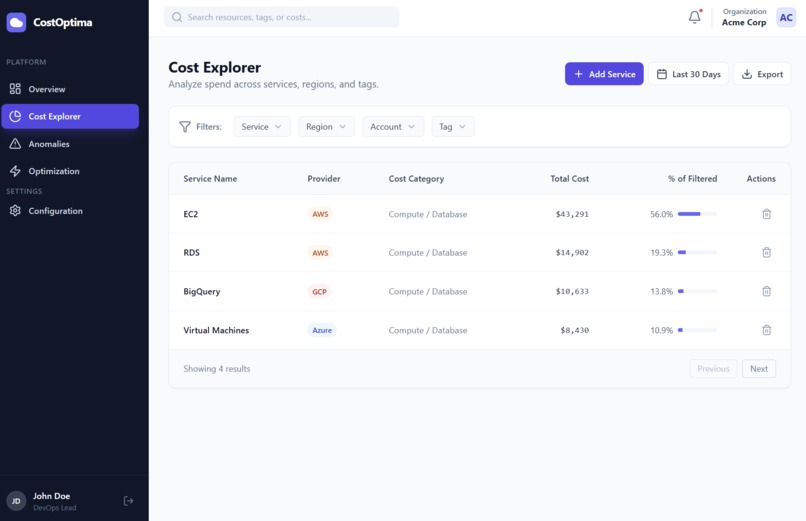
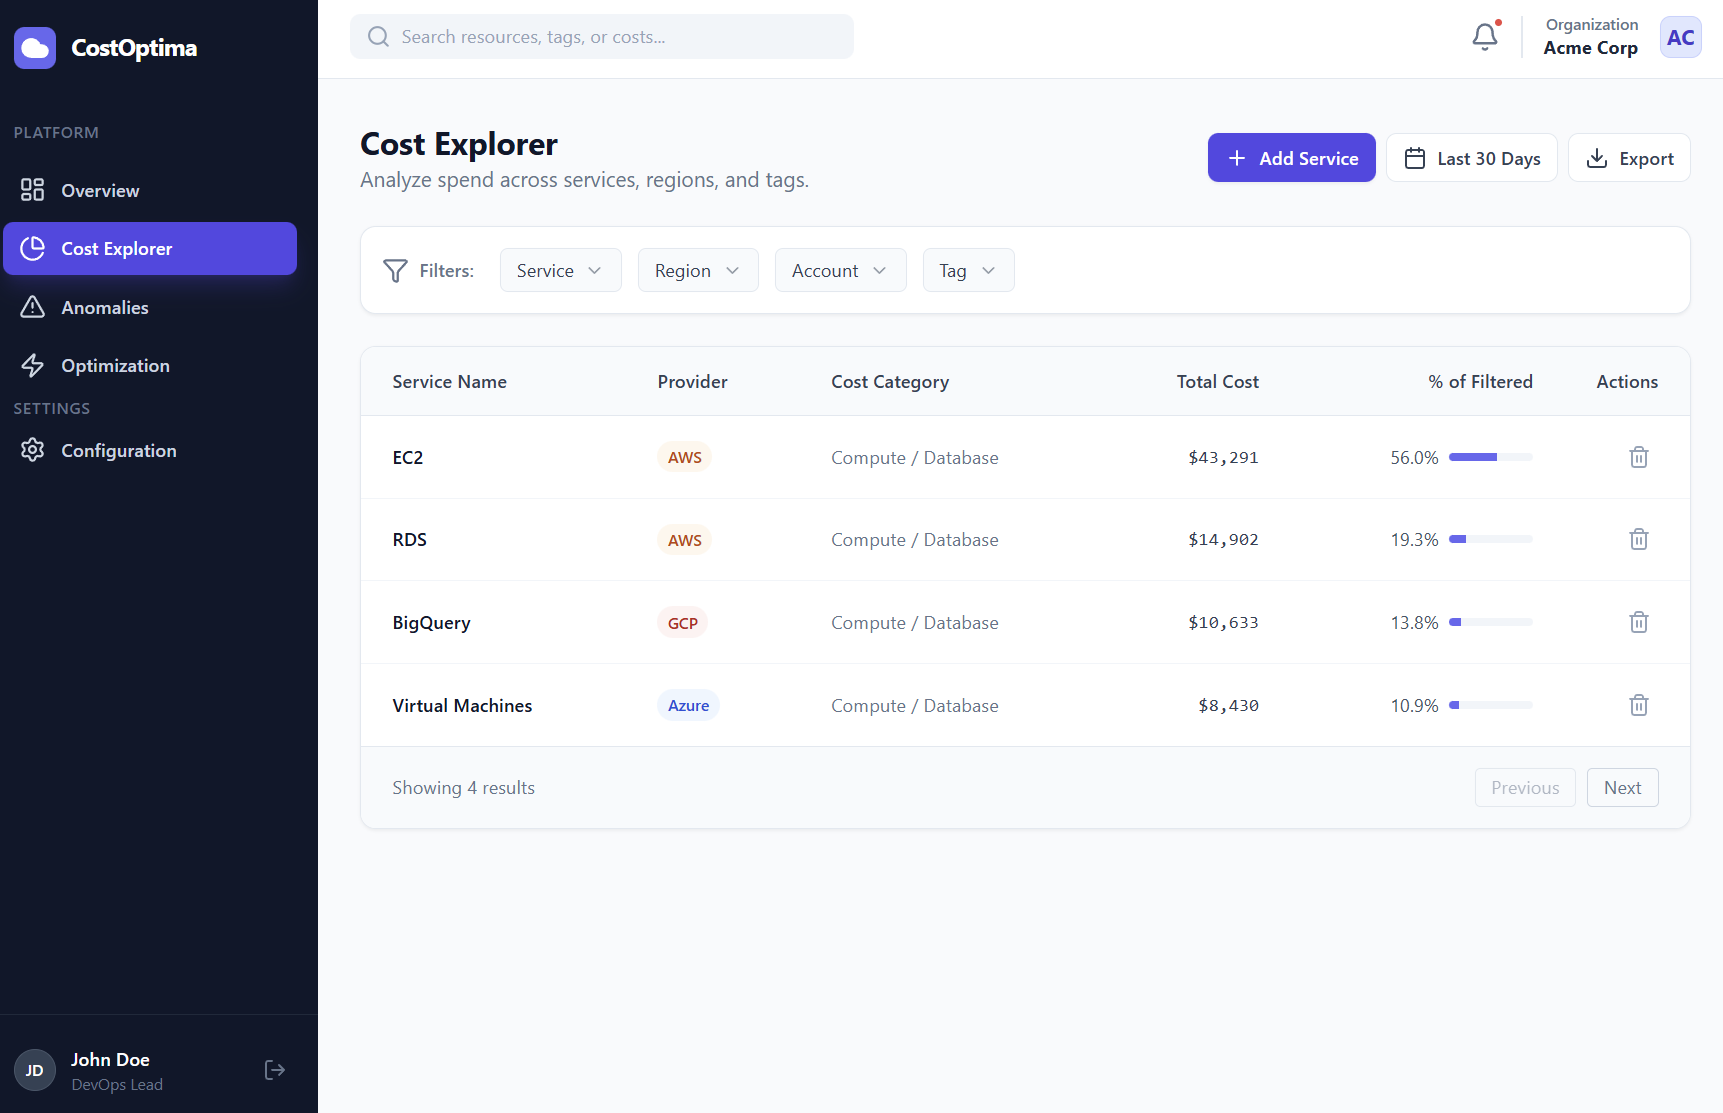
Cost Explorer
-
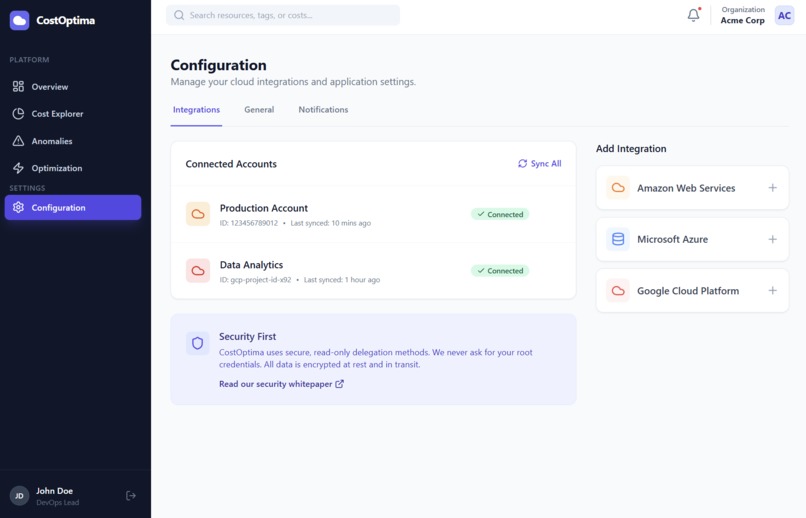
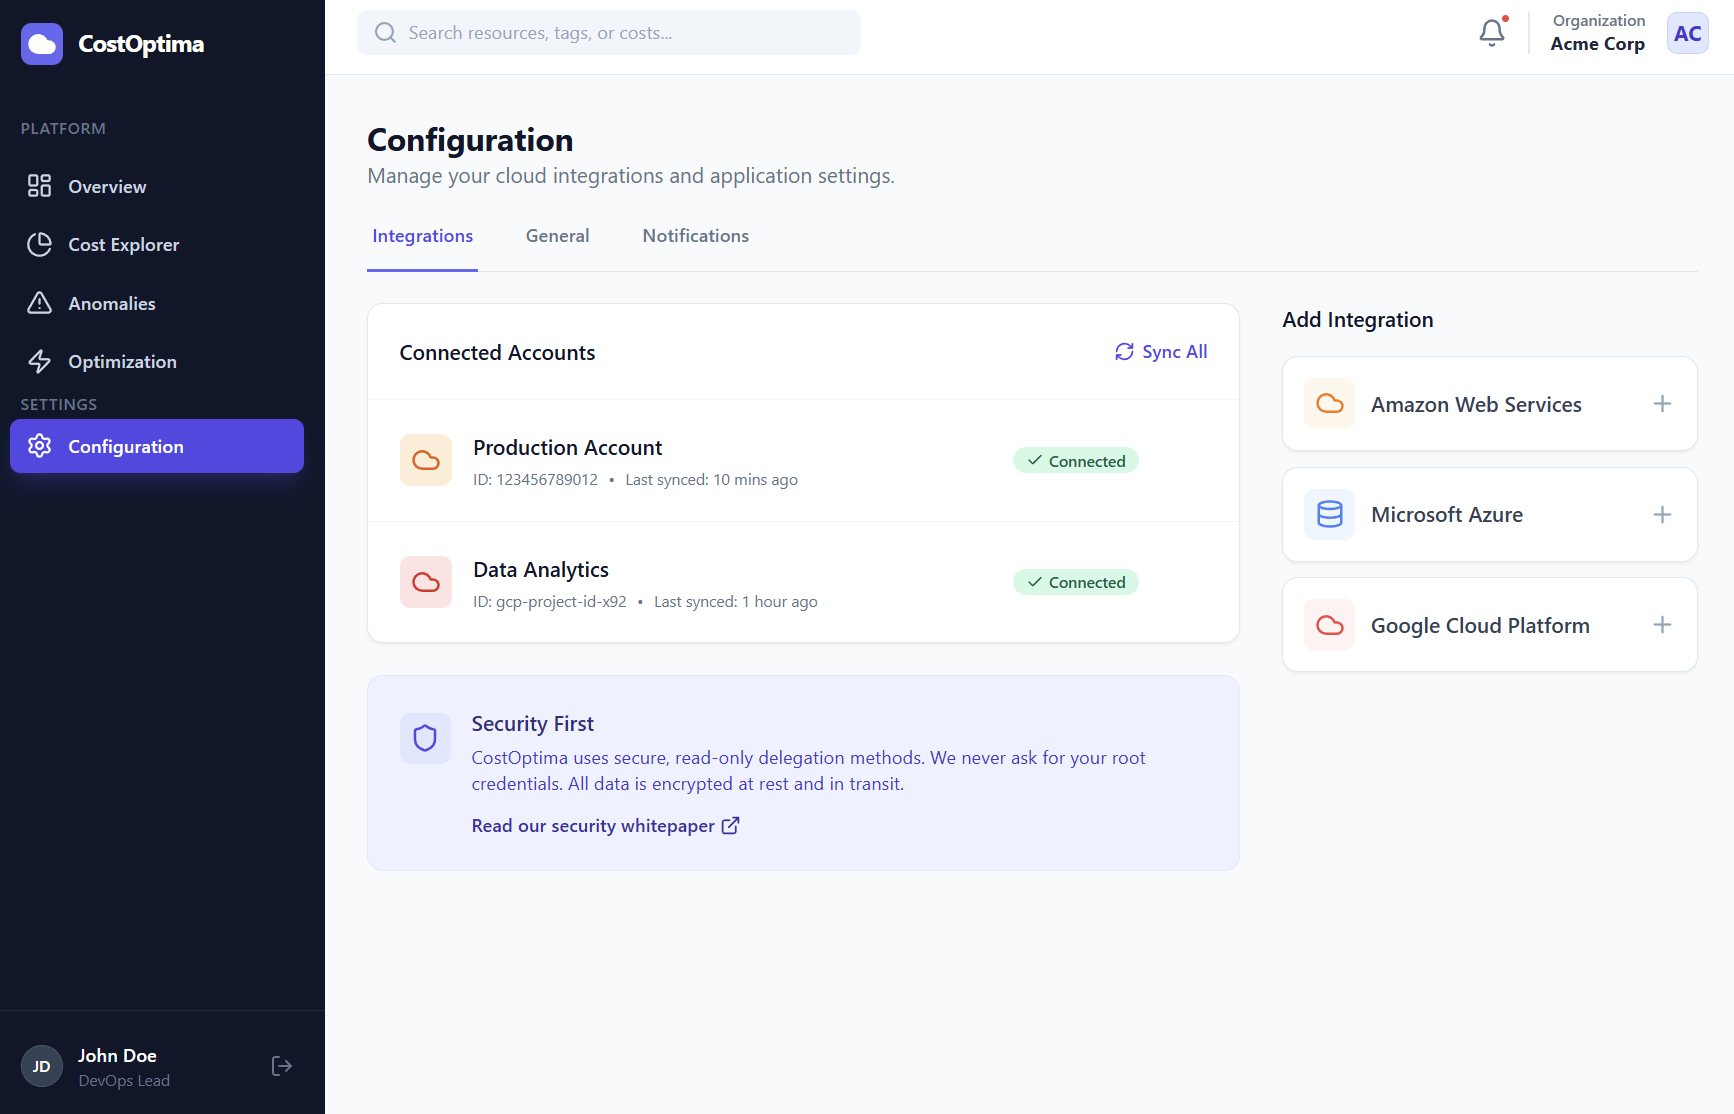
Configuration
-
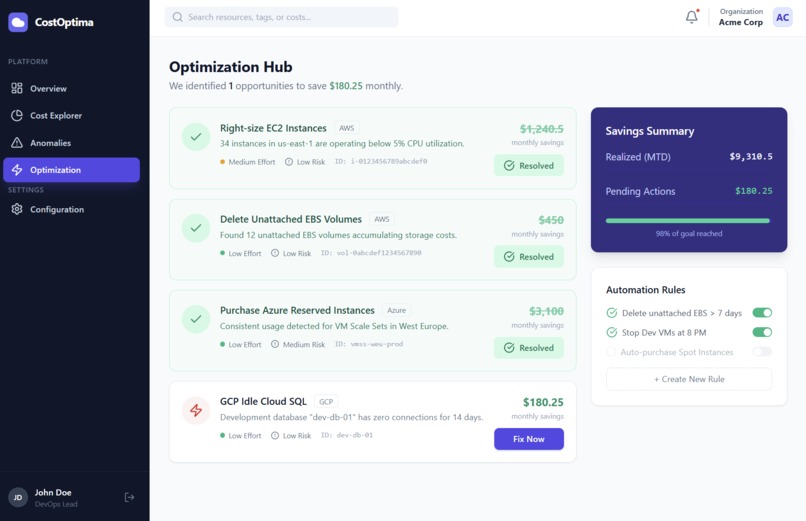
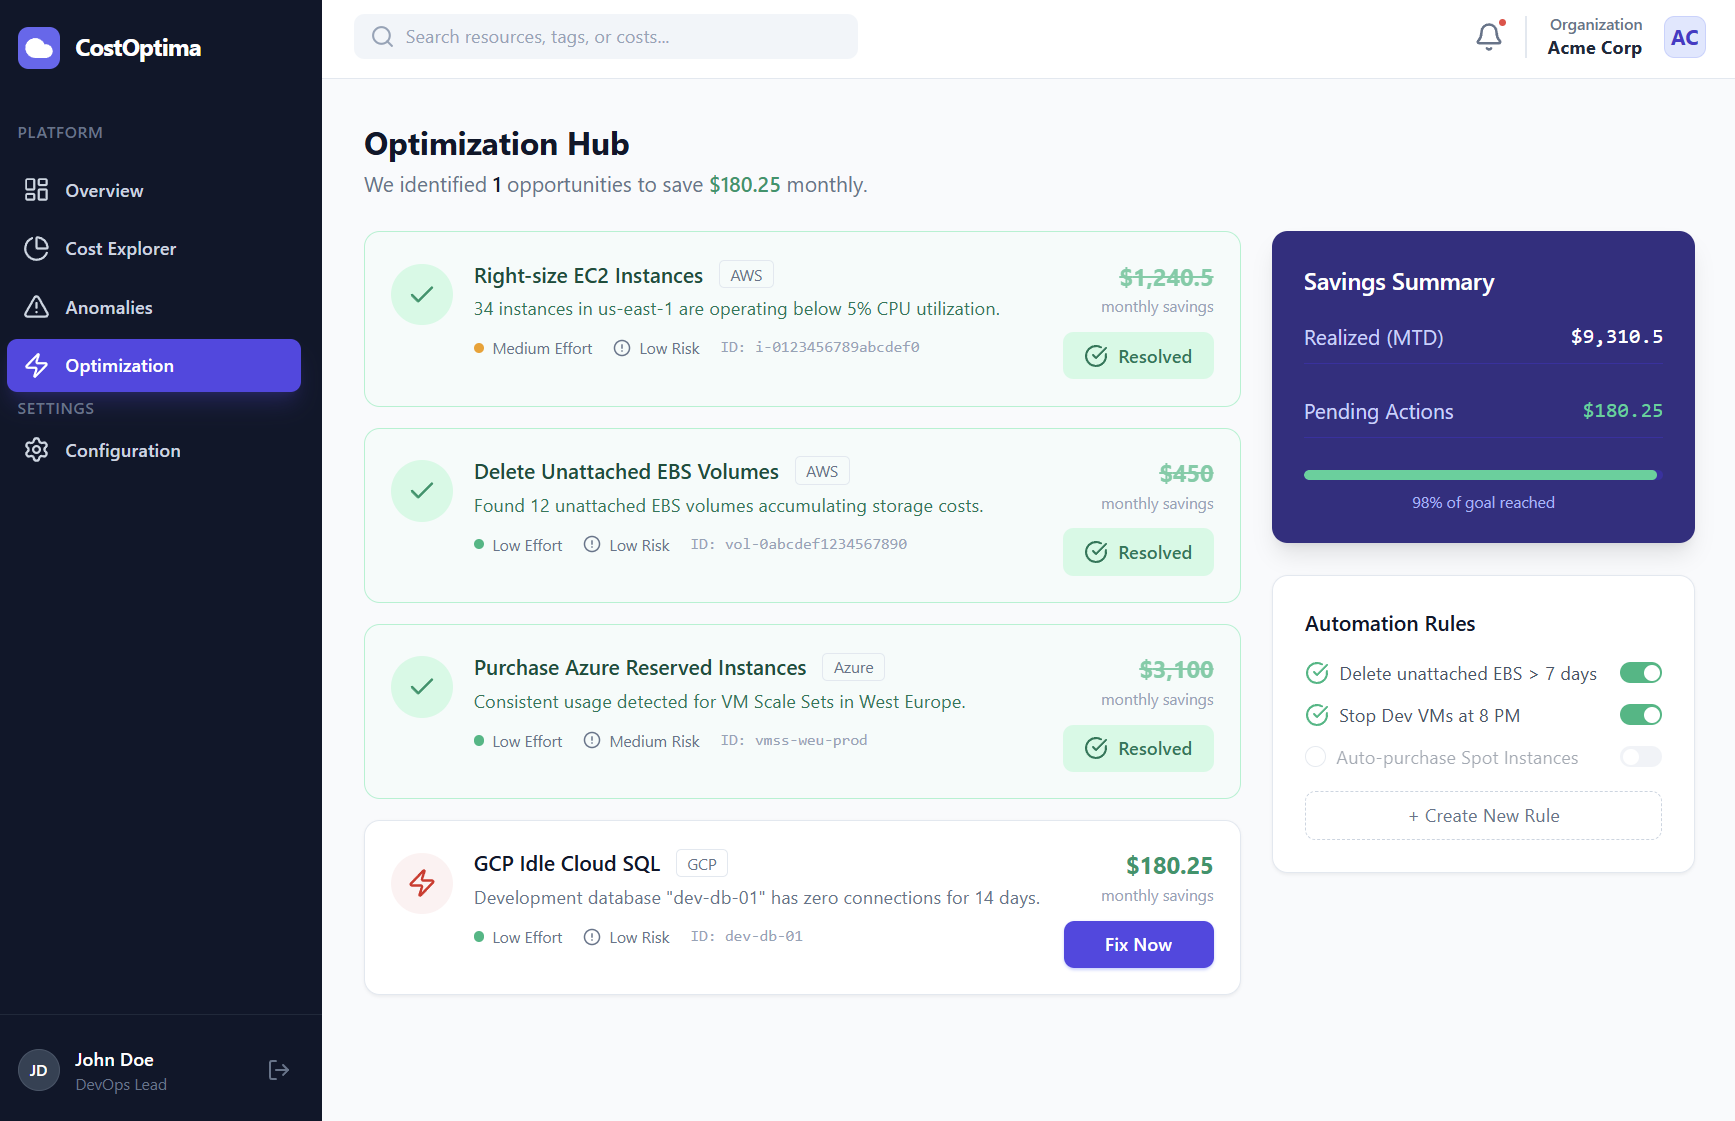
Optimization Hub
-

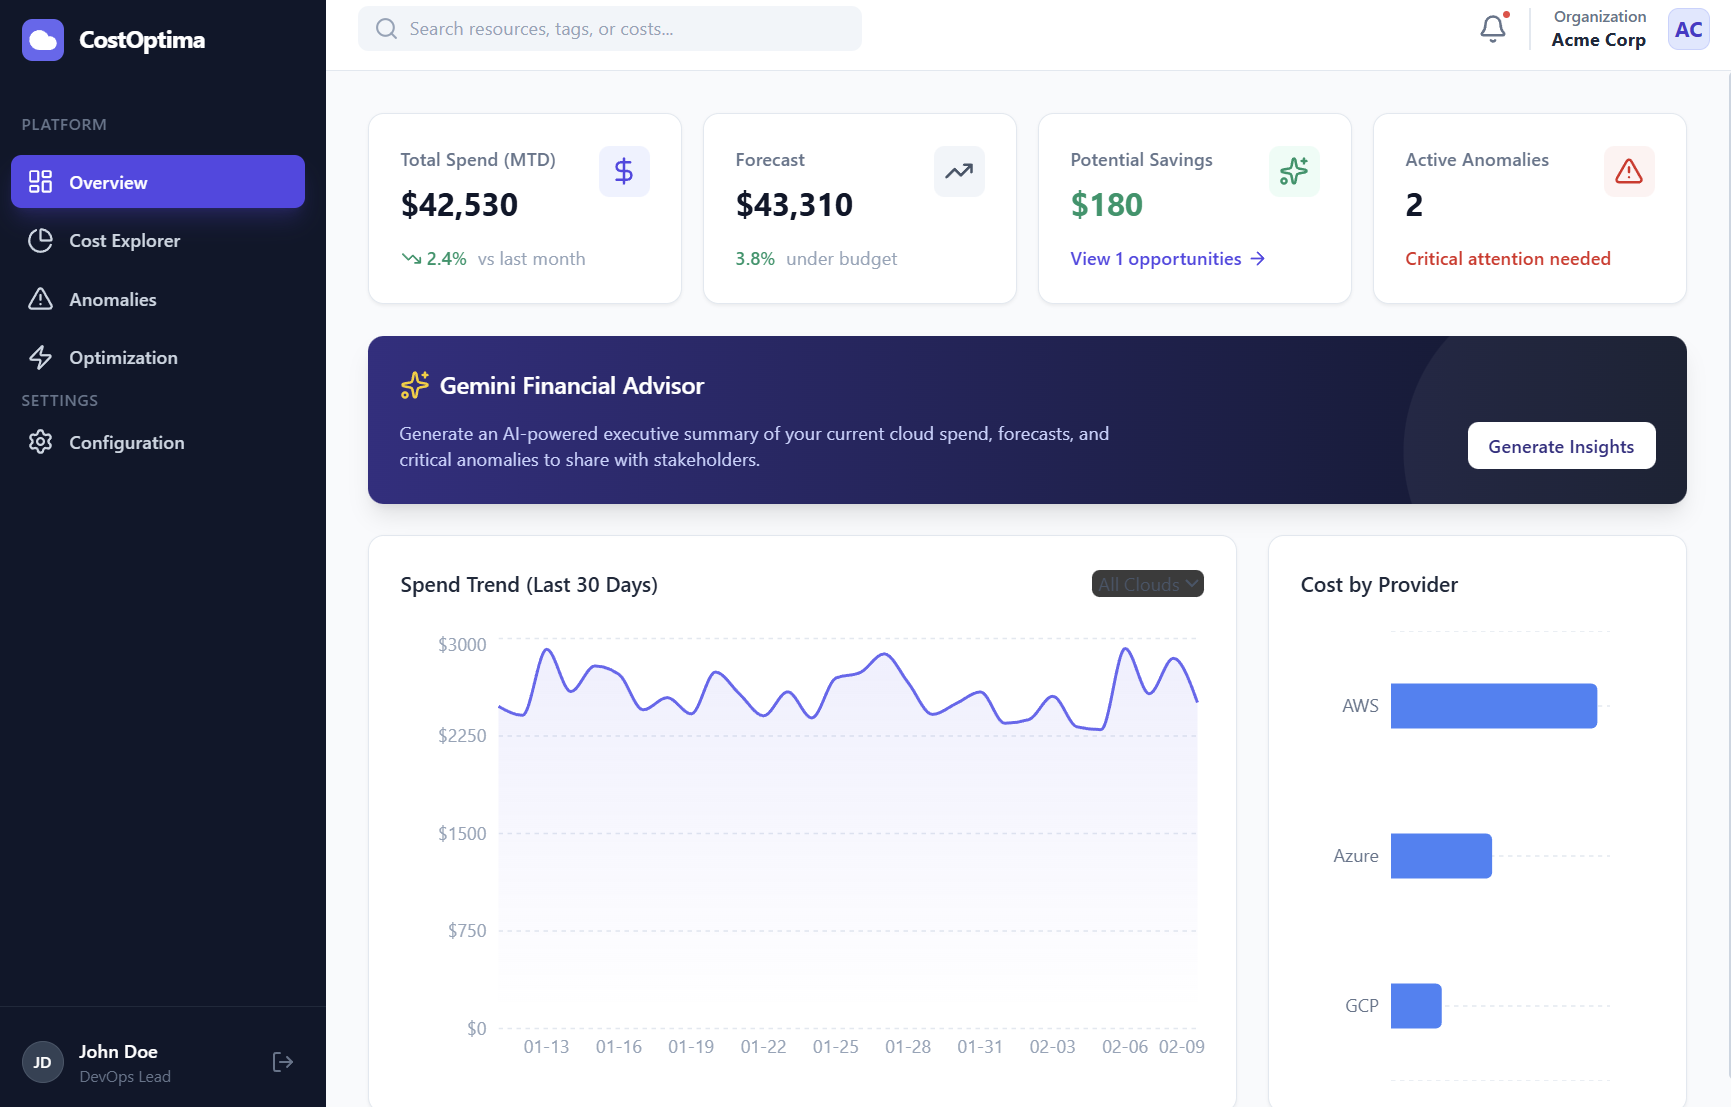
Main Dashboard
Inspiration
Managing cloud costs across multiple providers is a nightmare for modern engineering teams. AWS, Azure, and GCP all have different billing models, making it nearly impossible to get a unified view of spending. We wanted to build CostOptima Cloud to solve this "FinOps" fragmentation. Our goal was to create a single pane of glass that not only visualizes costs but uses Generative AI to actively find savings and explain complex billing anomalies in plain English.
What it does
Aggregates Multi-Cloud Spend: Visualizes cost data from AWS, Azure, and GCP in a single view, tracking total spend against monthly forecasts and budgets.
Provides AI Executive Summaries: Uses the Gemini Financial Advisor to generate concise, natural-language reports on financial health and critical action items.
Detects & Analyzes Anomalies: Automatically flags spending spikes (e.g., an unexpected surge in Lambda costs) and uses AI to suggest potential root causes and investigation steps.
Identifies Optimizations: Surfaces specific opportunities to save money, such as "Right-sizing EC2 Instances" or "Deleting Unattached EBS Volumes," complete with estimated savings and a "Fix Now" workflow.
How we built it
Frontend: Built with React 19, TypeScript, and Vite for a fast, responsive user experience.
AI Integration: We integrated the Google GenAI SDK (@google/genai) to power our analysis features, engineering specific prompts to feed structured JSON cost data into the model.
Data Visualization: We used Recharts for interactive spend trend areas and provider breakdowns, and Lucide React for consistent iconography.
Styling: The UI is styled with Tailwind CSS to mimic a professional enterprise SaaS application.
Challenges we ran into
Data Normalization: Defining a unified data schema (CostMetric and CloudProvider) that could accommodate the different terminologies used by AWS (Regions), Azure (Locations), and GCP was a major hurdle.
Prompt Engineering: Getting the AI to provide concise, "executive-style" summaries without hallucinating data required several iterations of prompt refinement and explicit input formatting.
Interactive State Management: Creating the "Optimization Hub" where users can apply fixes and see immediate updates to their "Realized Savings" required complex state logic to track fixed versus pending opportunities.
Accomplishments that we're proud of
Gemini Financial Advisor: We successfully built a feature where the AI doesn't just chat, but actively analyzes the dashboard state to provide context-aware insights.
Polished UX: The application features a fully responsive sidebar, dynamic charts, and a clean "Settings" interface for managing integrations, providing a high-quality user experience.
Actionable Insights: Unlike read-only dashboards, our "Fix Now" workflow in the Optimization Hub simulates real remediation, giving users a sense of agency over their cloud bills.
What we learned
FinOps Complexity: We learned that optimization isn't just about turning things off; it's about "Right-sizing" and managing "Commitments" (Reserved Instances) across different providers.
AI as an Analyst: We discovered that LLMs are incredibly effective at "Root Cause Analysis" for logs and billing data when provided with the right context (Service, Cost Spike amount, Date).
React 19: Building with the latest React version allowed us to use modern patterns for component composition and state handling.
What's next for OptiCloud
Real API Integrations: Transitioning from mock data to live connections with AWS Cost Explorer and Azure Consumption APIs.
Automated Remediation: Implementing the actual cloud API calls to execute fixes (e.g., resizing a VM) when the user clicks "Fix Now," moving beyond simulation.
Custom Thresholds: Adding functionality for users to define their own budget alerts and anomaly detection sensitivity in the Settings configuration.
Built With
- google-gemini-api
- lucide
- react
- recharts
- tailwind-css
- typescript
- vite

Log in or sign up for Devpost to join the conversation.