-
-
-
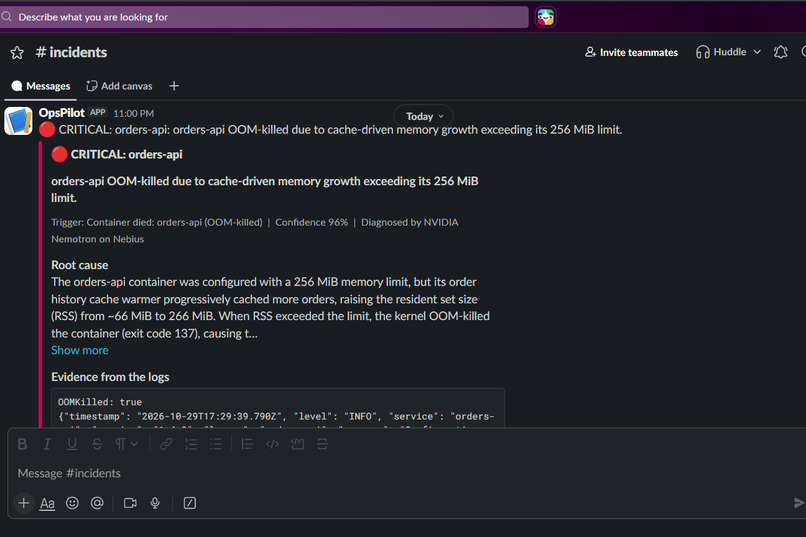
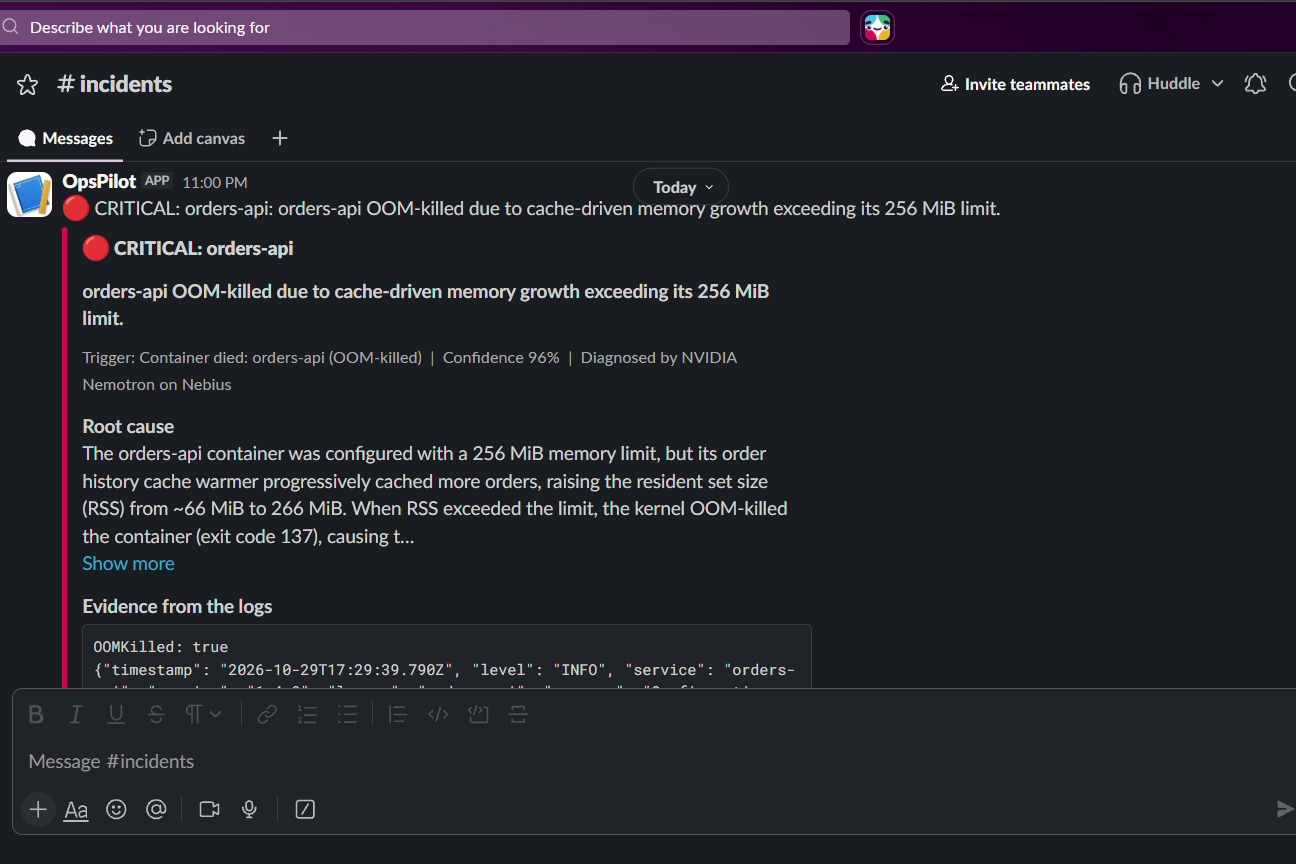
The OOM alert in Slack
-
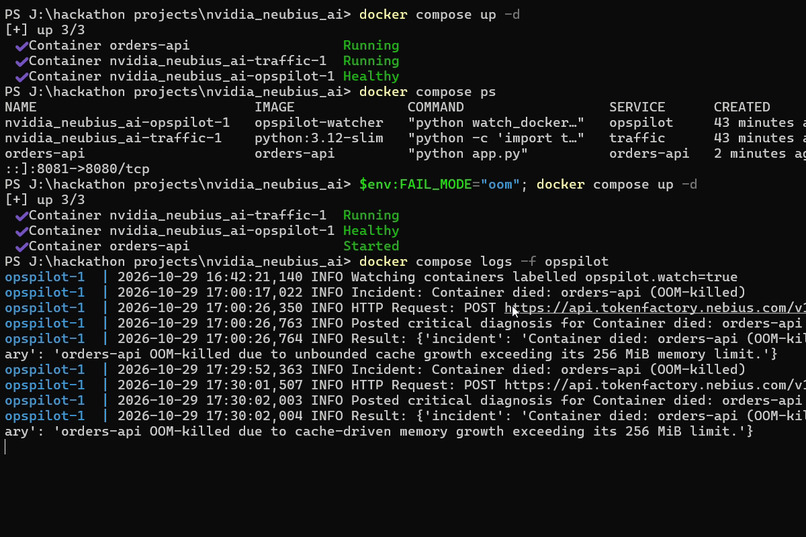
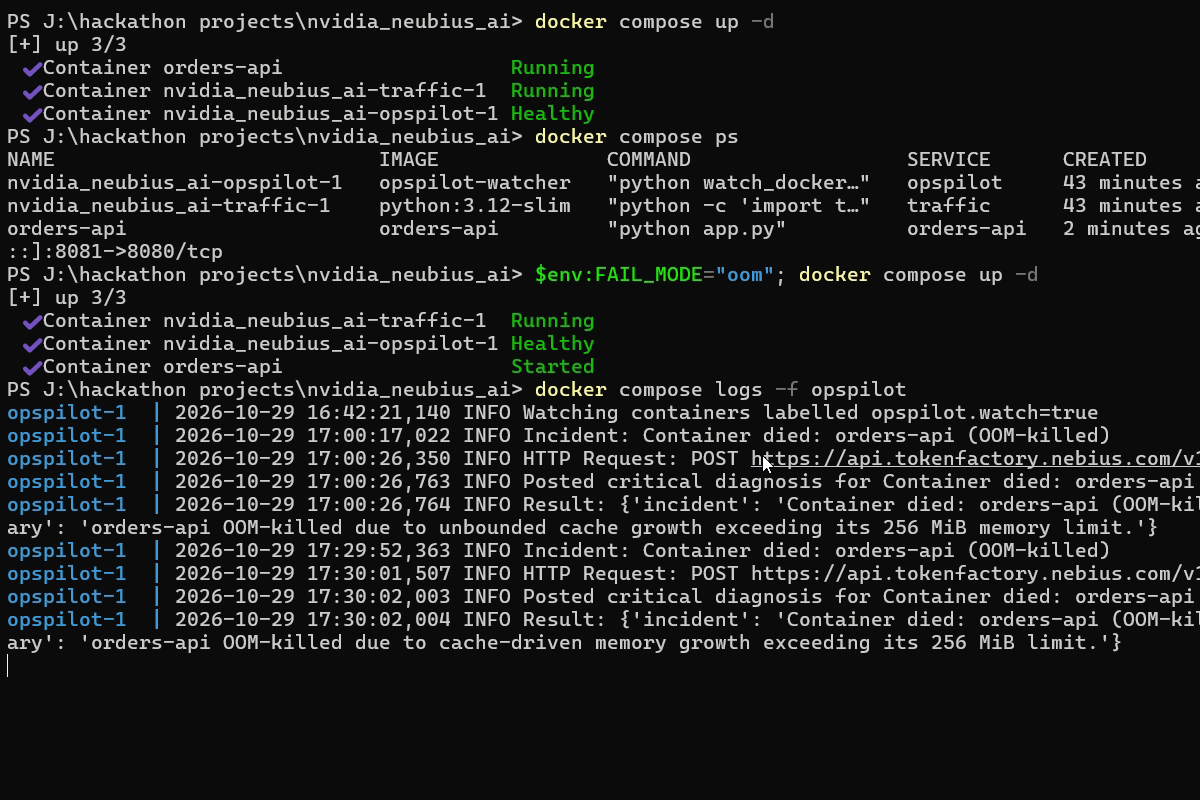
The watcher’s logs
-
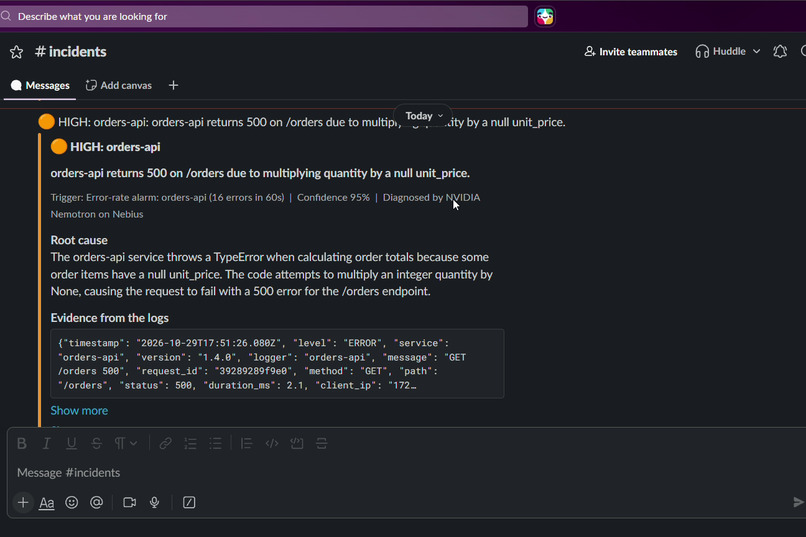
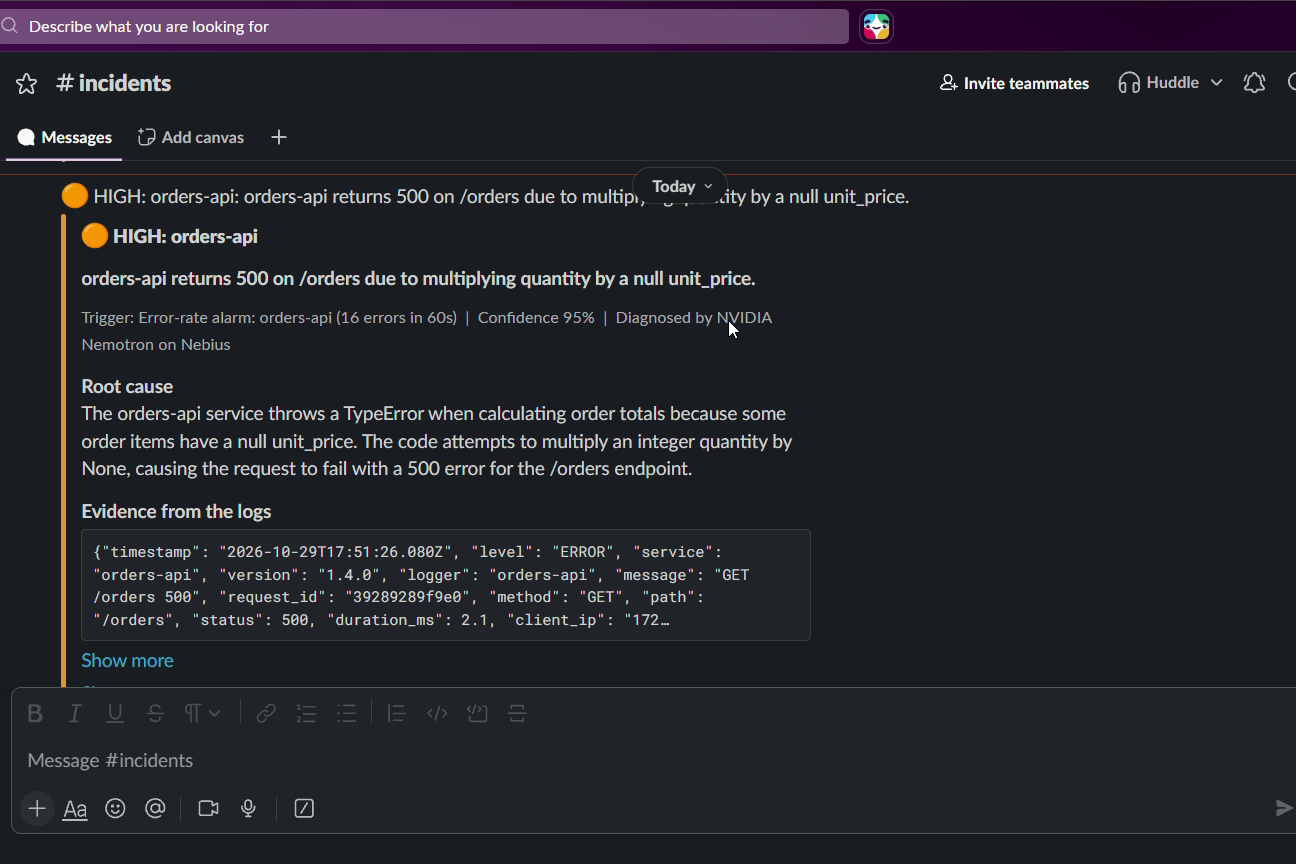
The errors alert in Slack
Inspiration
When a service breaks, the alert only says that something is wrong. The on-call engineer still has to open the logs, find the one line that matters, and work out the cause before fixing anything. We wanted the alert to arrive with that work already done: what broke, why, the log lines that prove it, and what to do next.
What it does
OpsPilot watches your containers. When one dies, is OOM-killed, fails its health check or starts throwing errors, OpsPilot:
- Reads the container's last 15 minutes of logs.
- Adds what Docker reported (exit code, OOM flag, failing health check).
- Asks NVIDIA Nemotron 3 Super on Nebius Token Factory for a diagnosis.
- Posts it to Slack, colour-coded by severity.
Each alert gives the affected service, the root cause, evidence quoted from the logs, severity, confidence, fix steps and how to prevent it next time.
We built a demo service, orders-api, that can be broken in four realistic ways. Its logs never mention which failure was switched on, so every diagnosis comes from the symptoms alone. In our live run, OpsPilot diagnosed all four correctly:
- Out of memory: cache grew to ~249 MiB against a 256 MiB limit (high, 28 s to Slack)
- Missing env var:
DATABASE_URLmissing at startup (critical, 11 s) - Bad health check: health check times out connecting to Redis (medium, 39 s)
- Errors on requests: a
Noneprice causing aTypeErrorin the order total (high, 44 s)
Severity can vary between runs: in the demo video, the same OOM came back as critical.
How we built it
- The AI core is one Python function,
diagnose(logs). It calls Nemotron through Nebius's OpenAI-compatible API, strips the model's reasoning, extracts the JSON and validates every field. If the answer is invalid, it shows the model exactly what was wrong and asks once more. - Evidence is verified. Every log line the model quotes is checked against the real logs, and invented quotes are dropped.
- The prompt casts the model as a senior SRE with an investigation checklist and a severity guide based on concrete signals. It also tells the model to use placeholders instead of inventing cluster names or versions.
- The watcher listens to Docker events (died, OOM-killed, unhealthy) and checks error rates every 15 seconds. It ignores manual stops and posts one alert per container, so a crash loop doesn't flood Slack.
- Everything runs with one
docker compose up: the demo app, a traffic generator and the watcher. It's free apart from the Nemotron call, about $0.002 per diagnosis. - An AWS Lambda version of the same pipeline (ECS events and CloudWatch alarms in, CloudWatch Logs read) is included and tested with sample AWS events.
- 33 pytest tests use fakes for Docker, AWS and the model.
Challenges we ran into
- Our AWS account never activated before the deadline. We moved to a local Docker watcher that mirrors the AWS design: Docker "died" events stand in for ECS task-stopped events, and an error-rate check for a CloudWatch alarm. The tested Lambda code stays in the repo.
- The model invented specifics. Asked for "exact" commands, it made up task revisions and cluster names. One prompt rule fixed it: only values from the logs, placeholders otherwise.
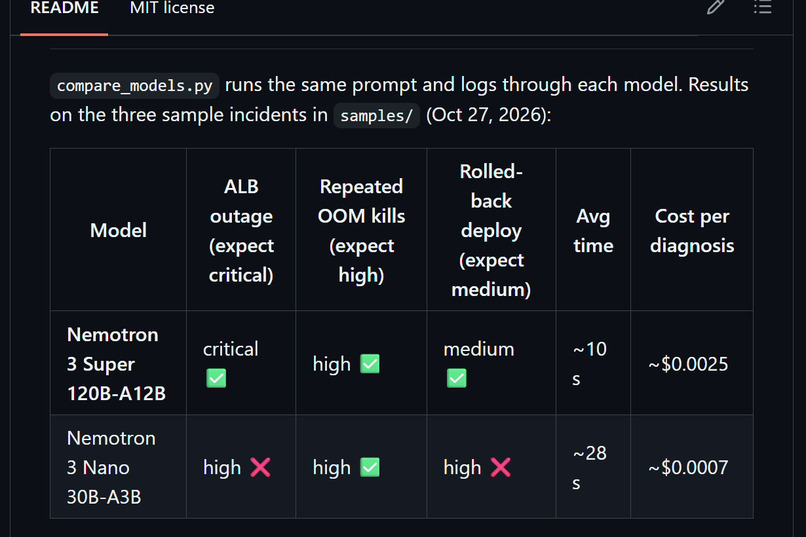
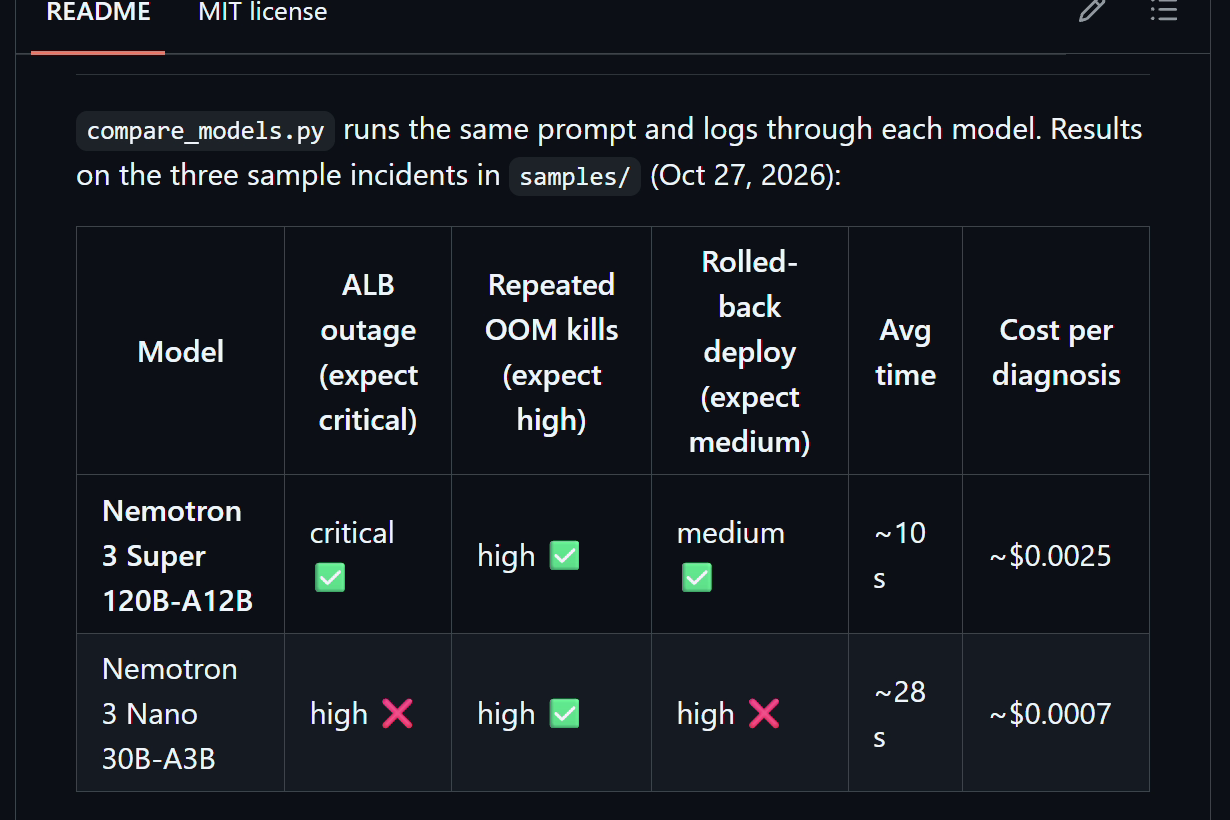
- Severity calibration. Early prompts rated almost everything "high". A guide based on what users feel right now (zero healthy targets = critical; a rolled-back deploy = medium) fixed it on our test incidents.
- Docker Desktop on Windows crash-looped on leftover socket files after unclean shutdowns. We found the cause in its logs and worked around it without losing data.
Accomplishments that we're proud of
- All four failure modes are detected, diagnosed and in Slack within 11 to 44 seconds, with no hints in the logs.
- Every piece of evidence shown to on-call is a real log line.
- A measured model choice: Nemotron 3 Super ranked all three test incidents' severity correctly; Nemotron 3 Nano rated everything "high" and was slower.
What we learned
- A bigger model's value showed up in judgement (severity, root cause versus symptom) more than in format. Both models produced valid JSON.
- Trust comes from checking. Validating the JSON, verifying quotes and forbidding invented values mattered as much as the prompt itself.
- Realistic failures need realistic logs. Our demo app fails the way real code fails, not with a fake "boom" error.
What's next for OpsPilot
- Deploy the AWS Lambda path (already written and tested) with Terraform.
- Watch Kubernetes events as well as Docker.
- Look up the diagnosed error in official docs (for example with Tavily) and link the fix.
- Slack buttons for on-call: acknowledge, re-diagnose, open a ticket.

Log in or sign up for Devpost to join the conversation.