-
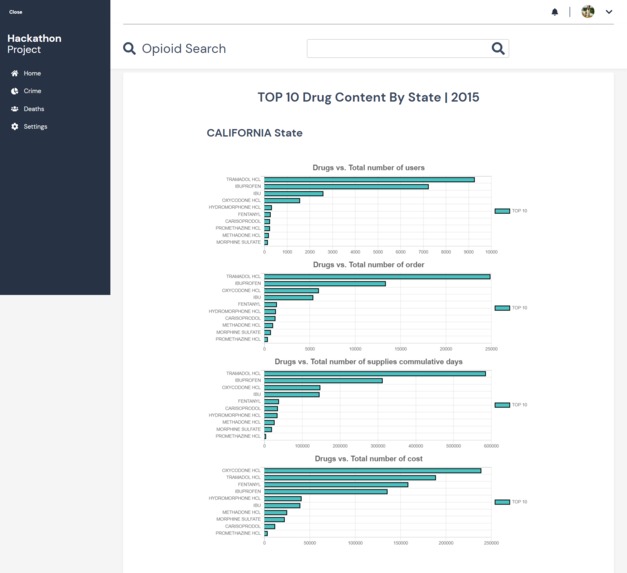
Drug Data (Live Site)
-

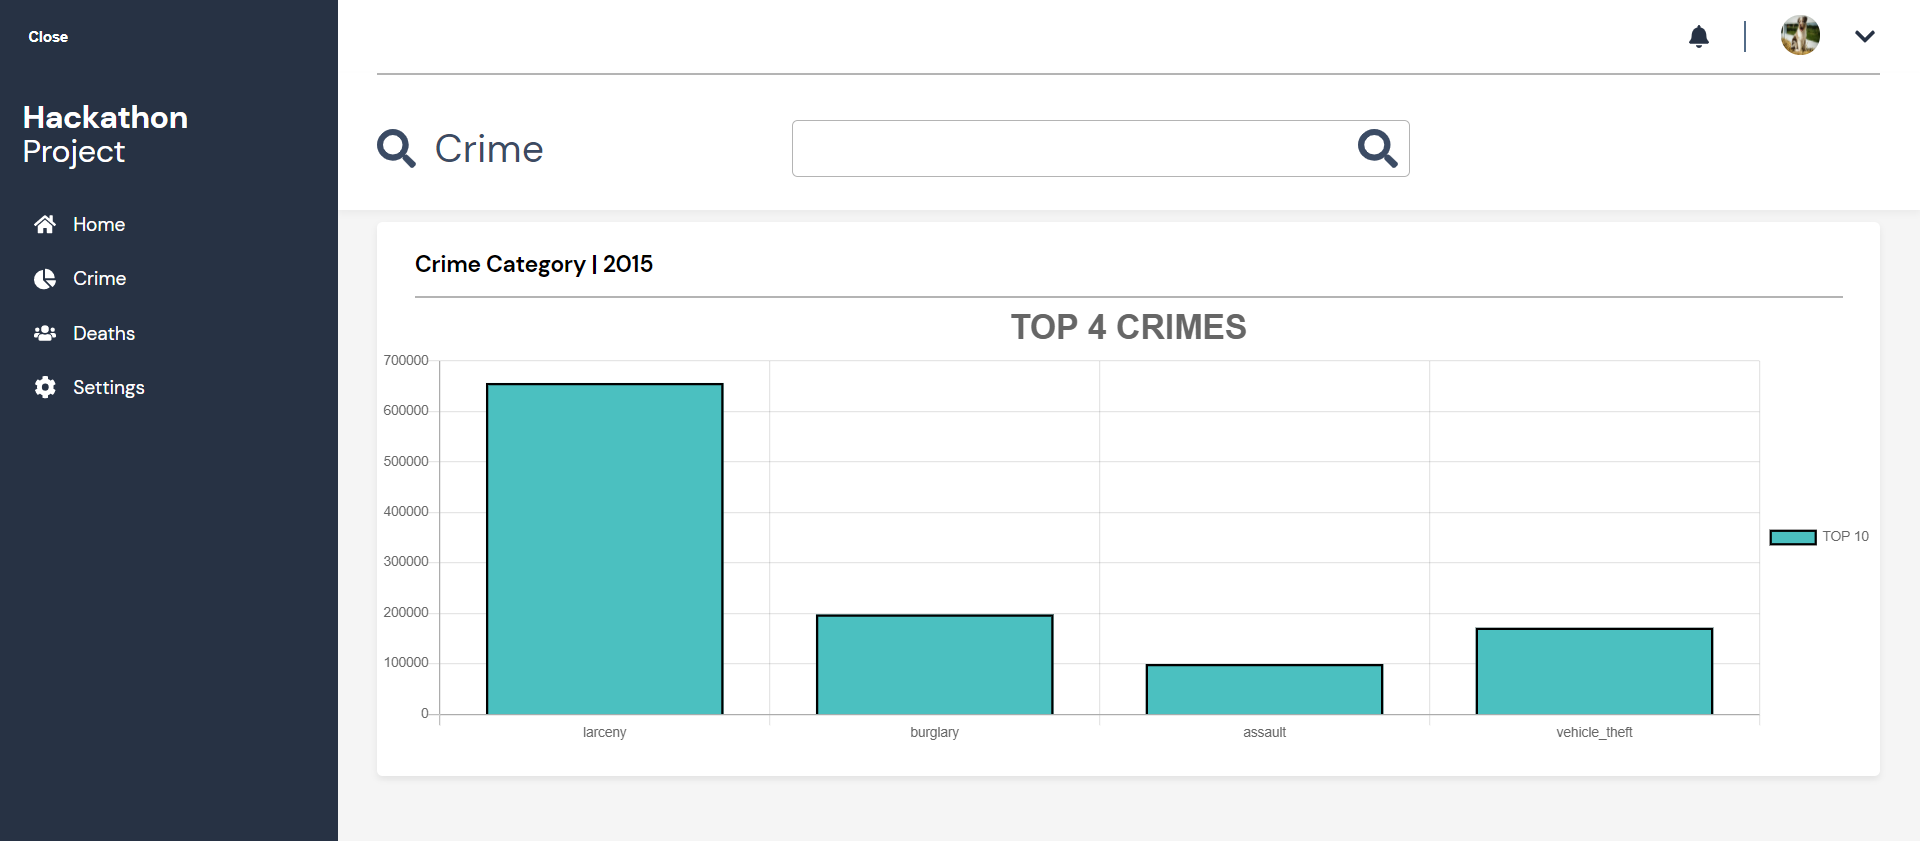
Crime Data (Live Site)
-

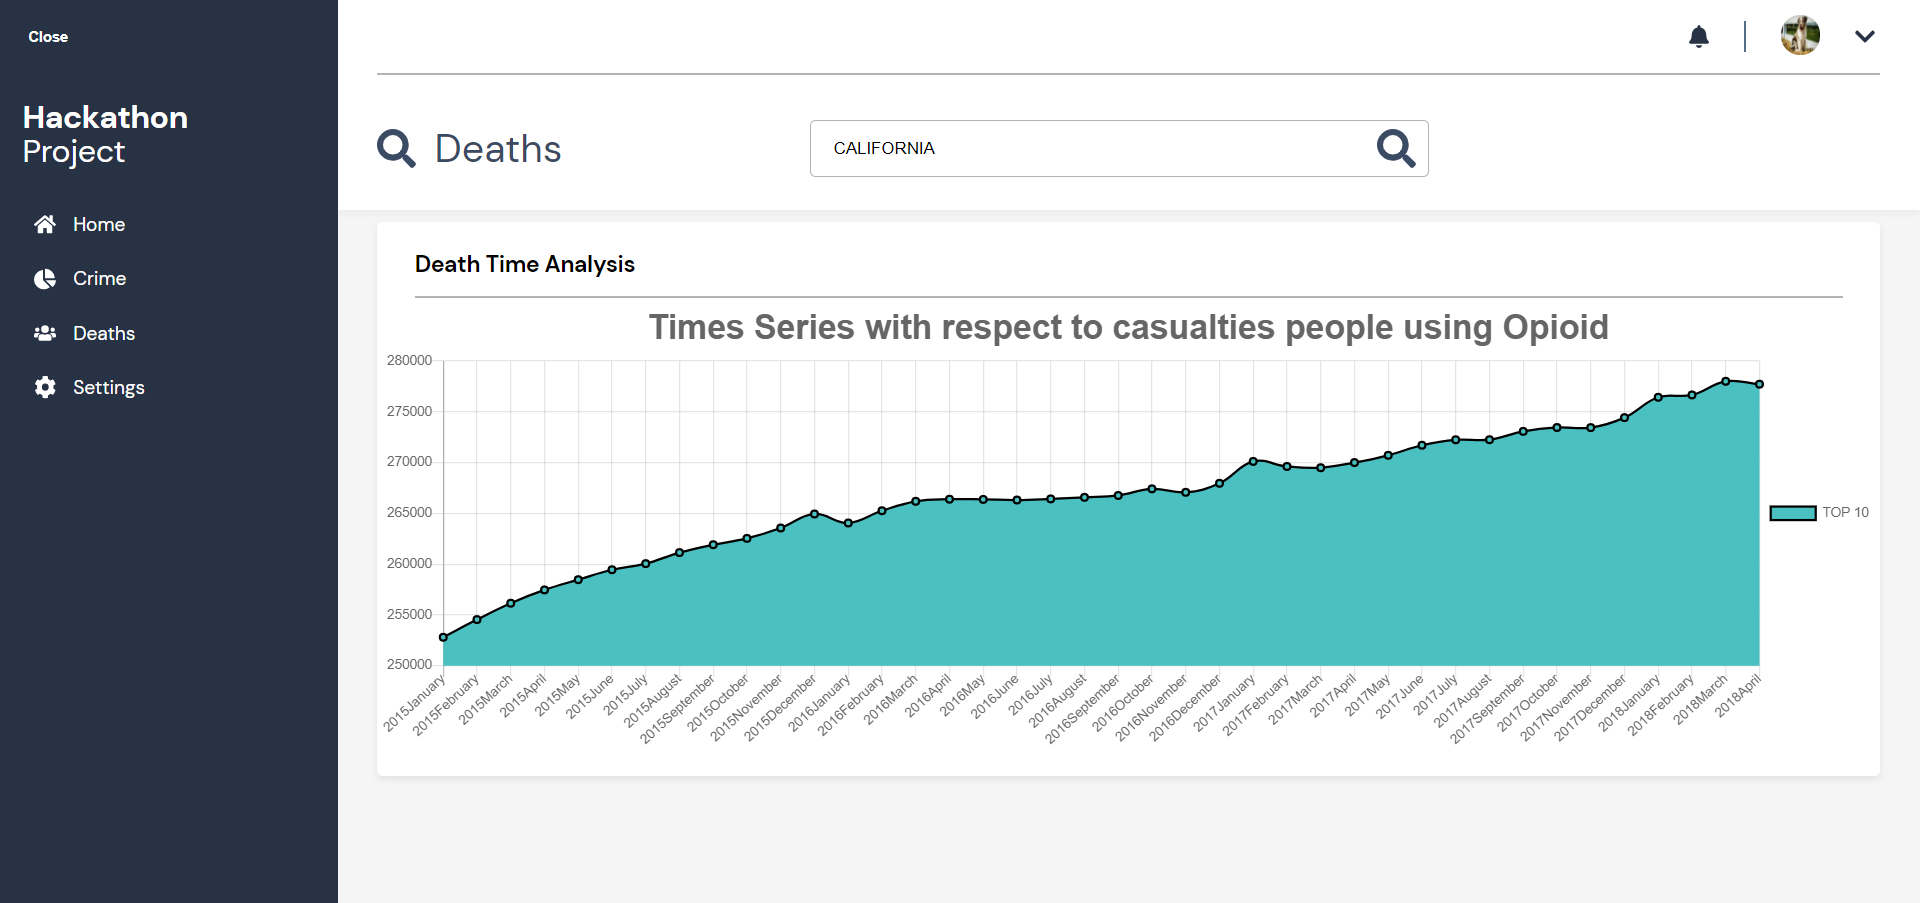
Deaths (Live Site)
-
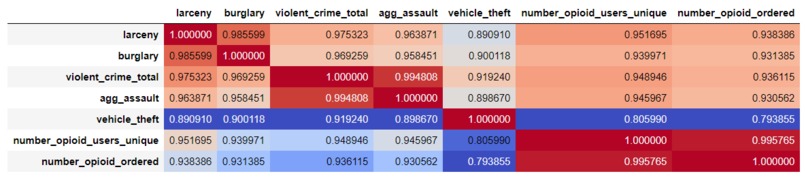
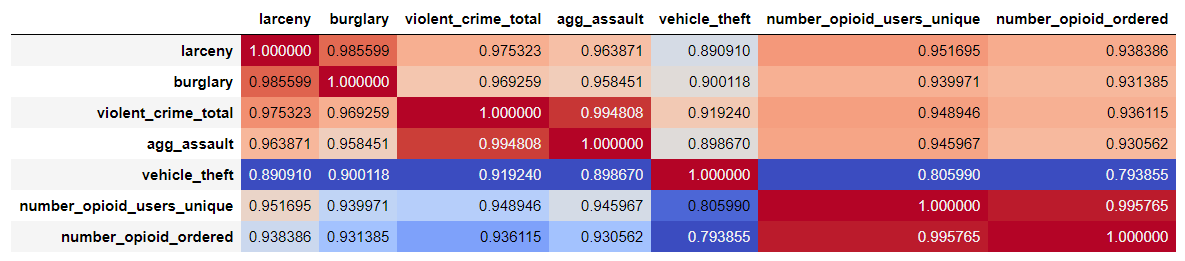
Crime and Drug correlation
-
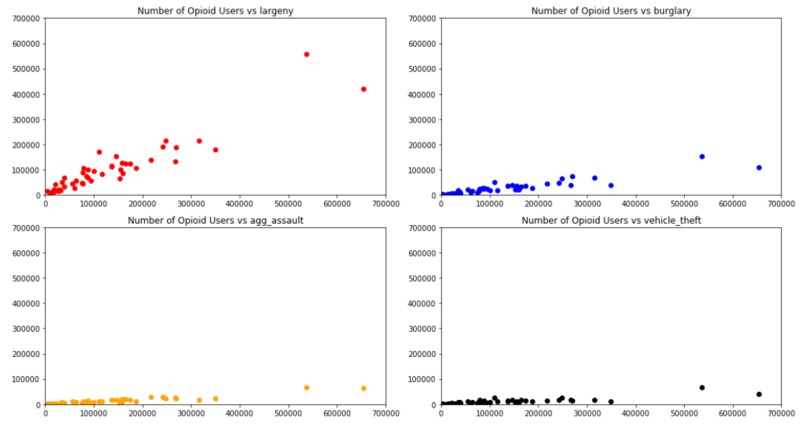
Individual crimes vs Opioid users
-
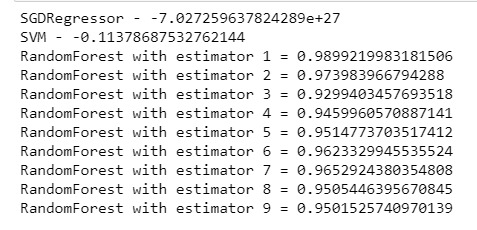
The prediction model for Individual crimes vs Opioid users
-

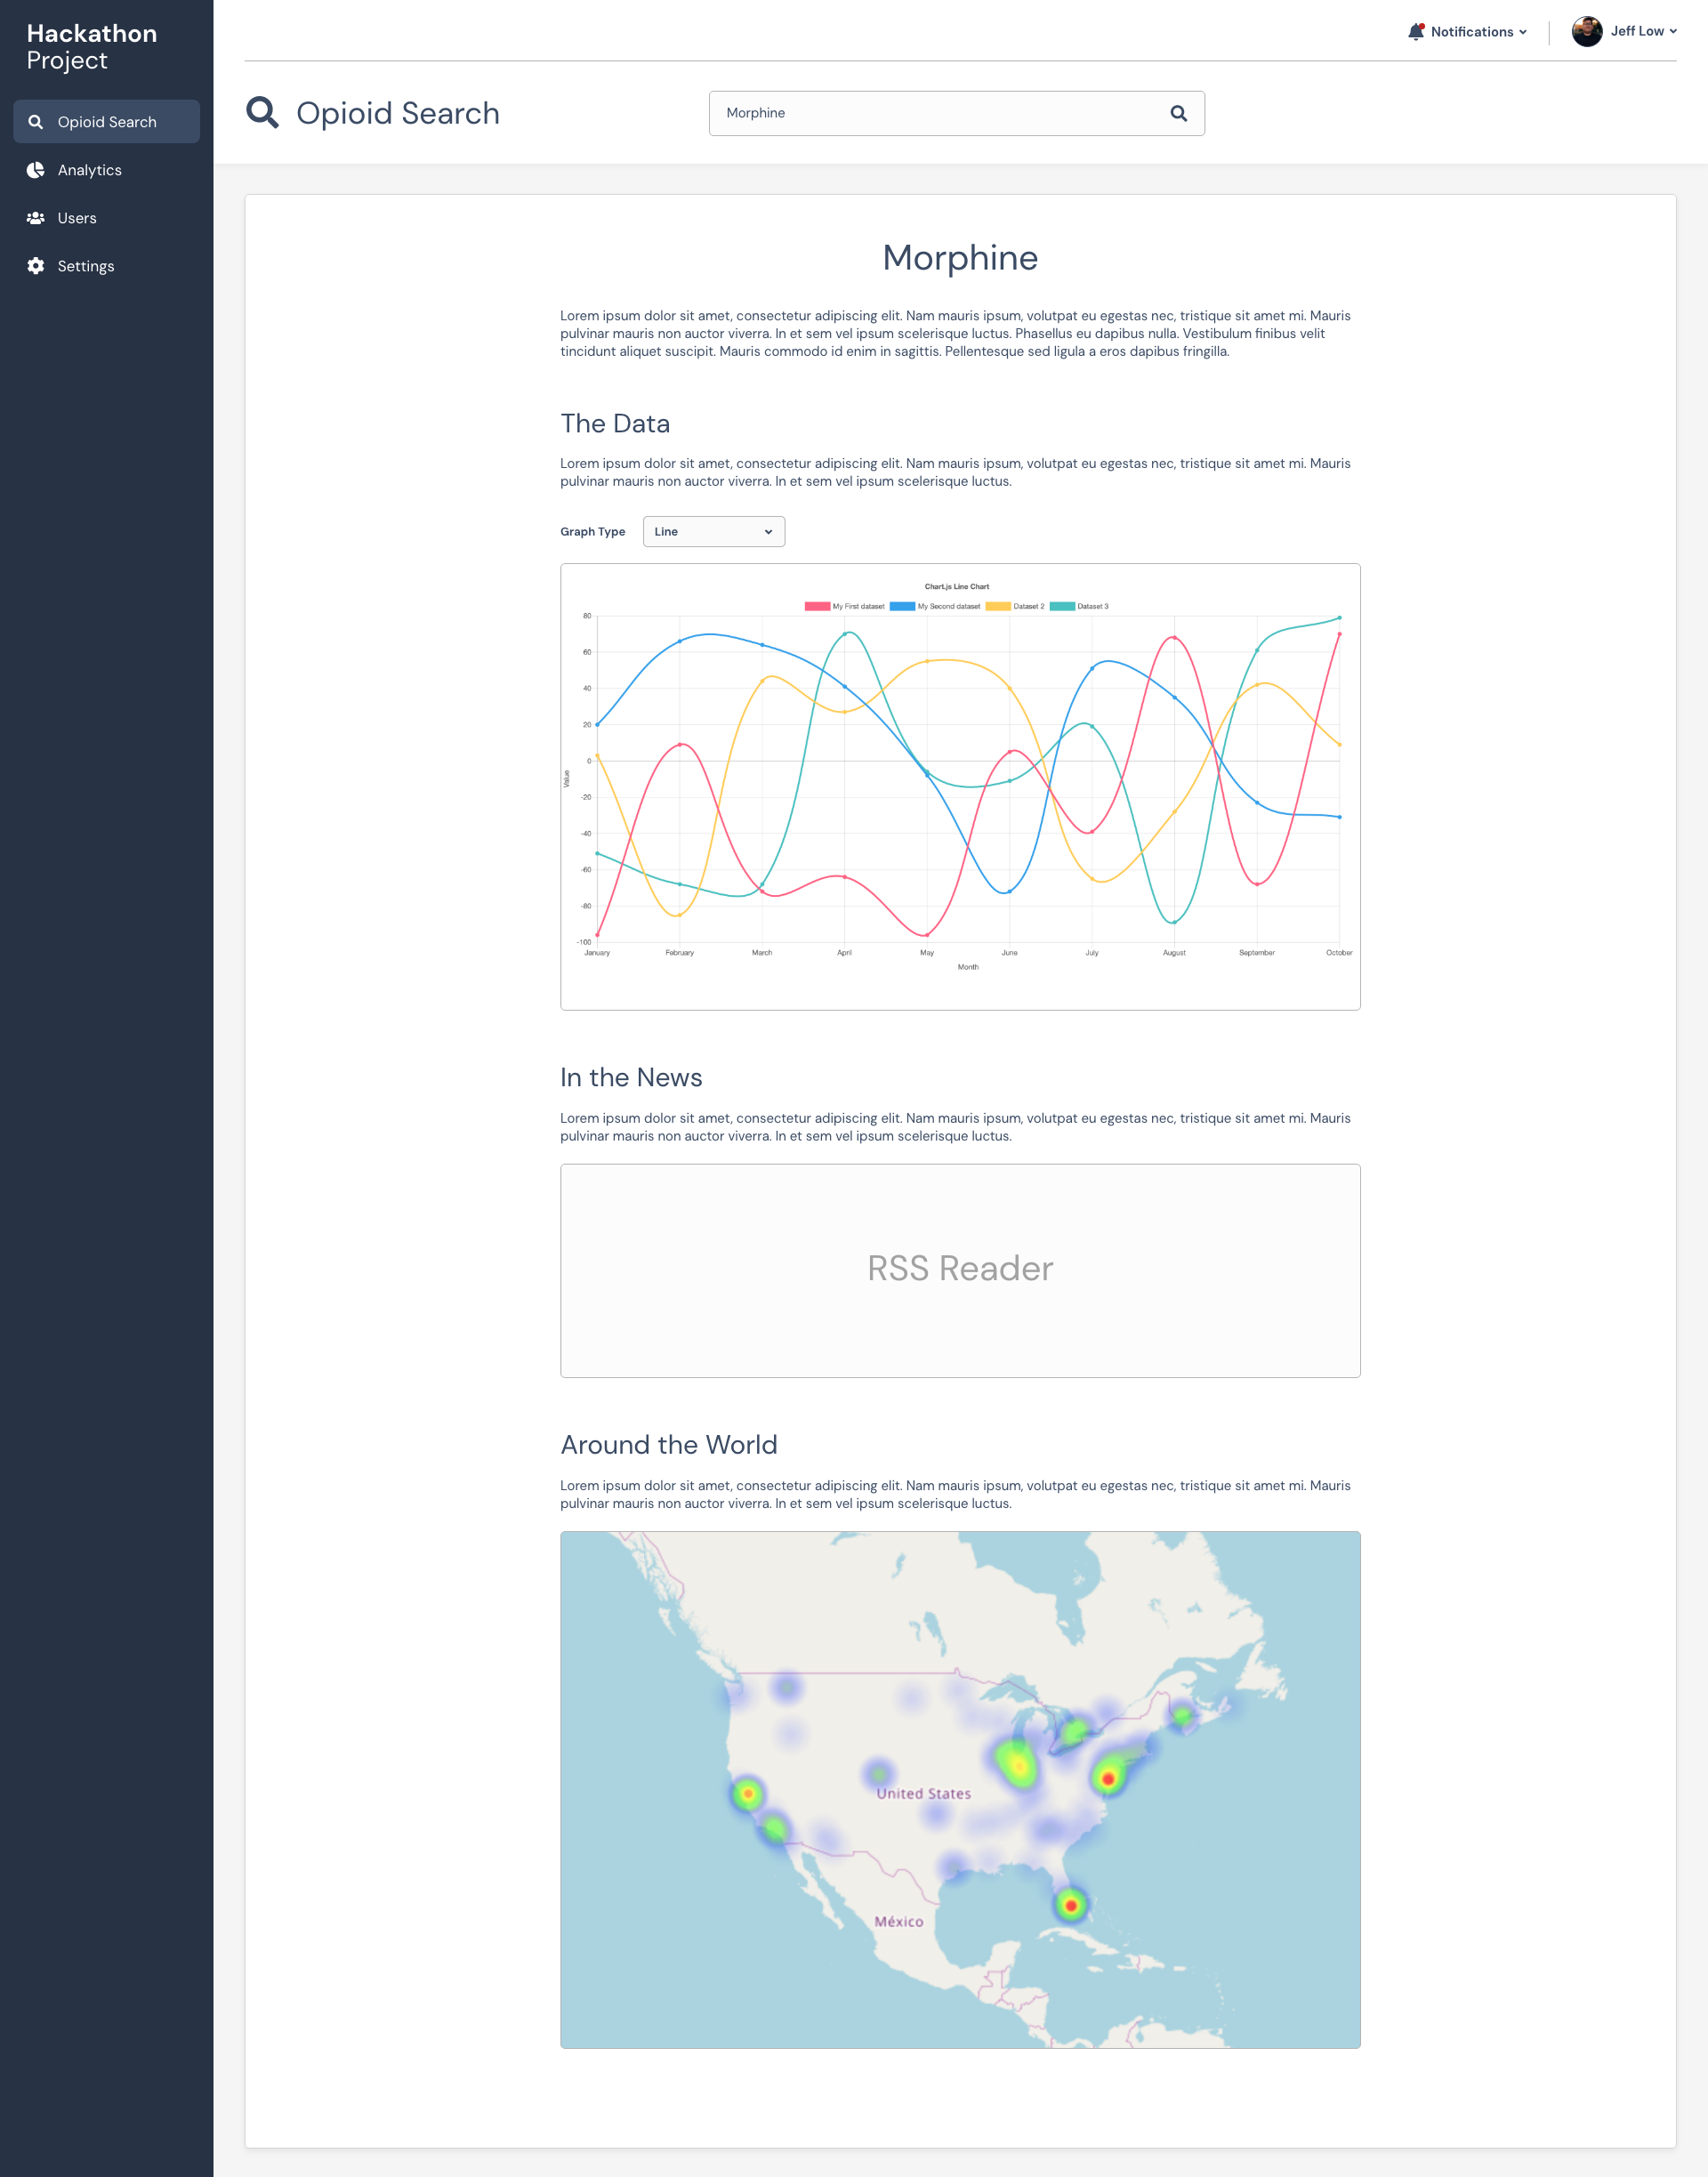
Future Feature: Articles about a specific opioid (wireframe)
-

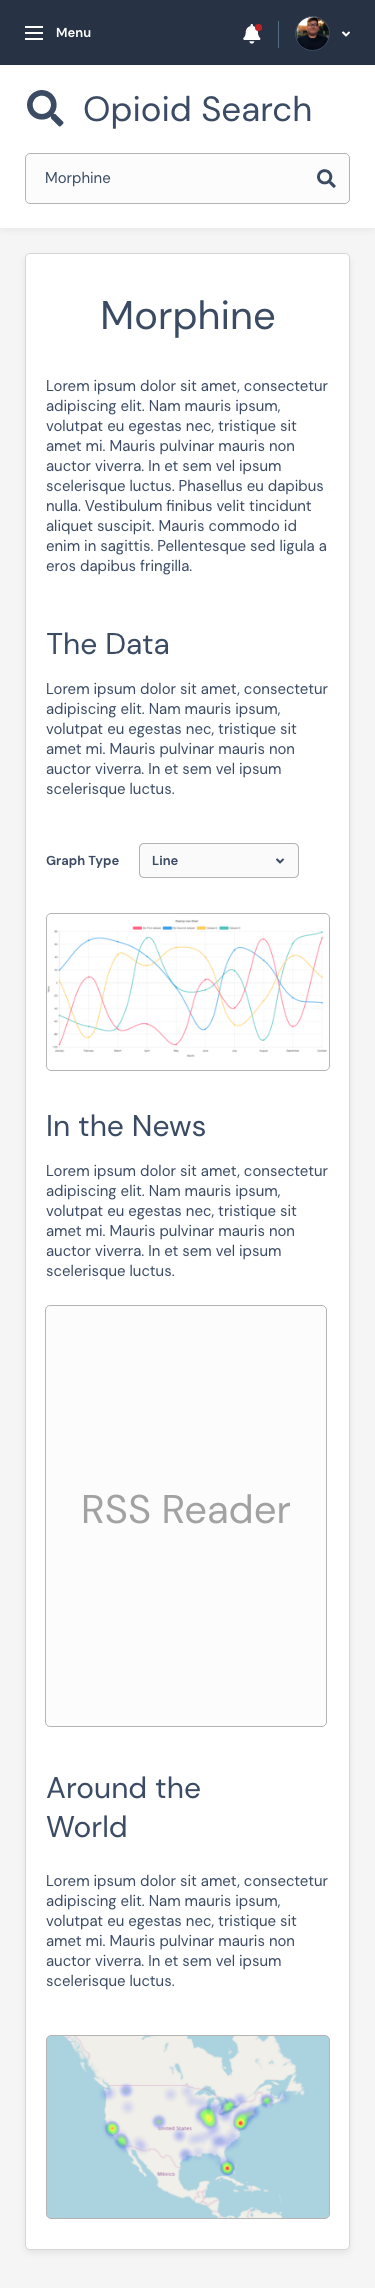
Future Feature: Mobile Layout for all pages (wireframe)
-
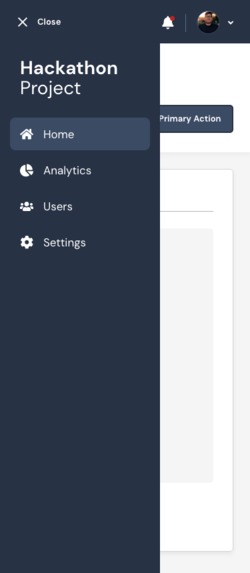
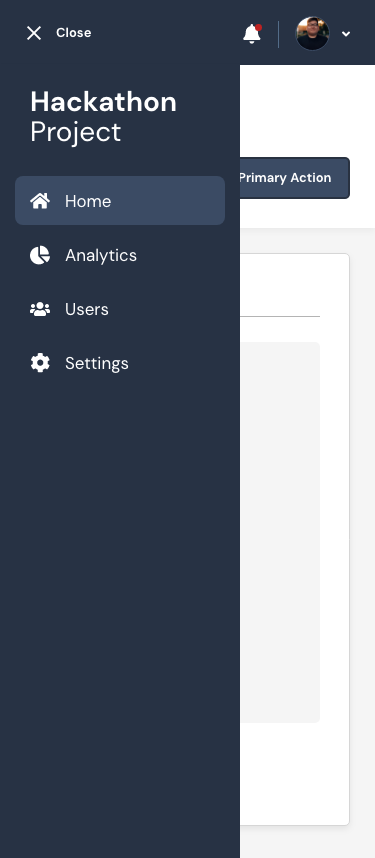
Future Feature: Mobile Nav (wireframe)


Inspiration
As technology rapidly advances, so does the obfuscation of information that is accessible to the public. Especially, in the realm of medicine and how it affects society at large, Opioids have and continue to be a common and effective, but addictive medication. Our Opiod Data Center aims to solve this problem by providing an all-in-one data source that will provide easily accessible information to the public about the ongoing Opioid Crisis in America.
What it does
Statistical data is often left in the hands of expert analysts and data scientists. Not very accessible to the average everday user. For a subject such as medicine, which can lead to life-changing effects for the better or worse, the American public is woefully underinformed about what they are putting into their bodies; and, what is going into their communities. The Opioid Data Center demystifies complex data and presents core insights to the public. Using a variety of technologies and data wrangling, we show correlation with a proven data set in accordance to movement of supply, crime rate, and opioid overdose.
How we built it
The entire infrastructure is designed around a custom REST API. The UI was first designed using AdobeXD. Then the front end was coded using React + Redux to create a single page application that could support fast rendering of charts. The front end UI was also styled and coded from scratch using styled-components a popular React library for encapsulating styles. The backend is also a JavaScript based infrastructure, we used Node and Express to the write the REST API and Postgres as the database. We also used Python and Jupyter because of it's simple and fast methods to spin up a data analyzation environment.
Challenges we ran into
The main challenge we ran into was the time constraint. We had more ideas that we wanted to include in the website, but we had to shrink the scope to something that was realistic for the hackathon. However, we plan on expanding this with the features we truly wanted in the future.
Accomplishments that we're proud of
We're proud of all the work that we've been able to achieve as a small team of two. Most importantly, we were proud of the amount of data analyzation we were able to do with the given data sets and API's we were able to find.
What we learned
We learned that we have to keep the scope realistic for the given team size and time constraints.
What's next for Opioid Data Center
We wanted to add features like, narrowing down to city, zip code in correlation to crime_date and other data sets that would be the solution for the root cause. Another feature that's in the pipeline is generating articles about a specific opioid showing correlations of death and crime, an RSS feed of news related to the opioid, and a heat map showing more information.
Built With
- api
- express.js
- fontawesome
- github
- jupyter
- matplot
- node.js
- pandas
- python
- react
- redux
- scikit-learn
- styled-components

Log in or sign up for Devpost to join the conversation.