-
-
Portfolio Risk Radar
-
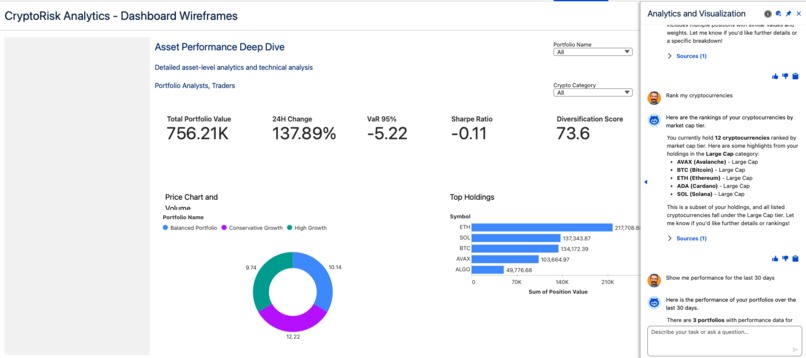
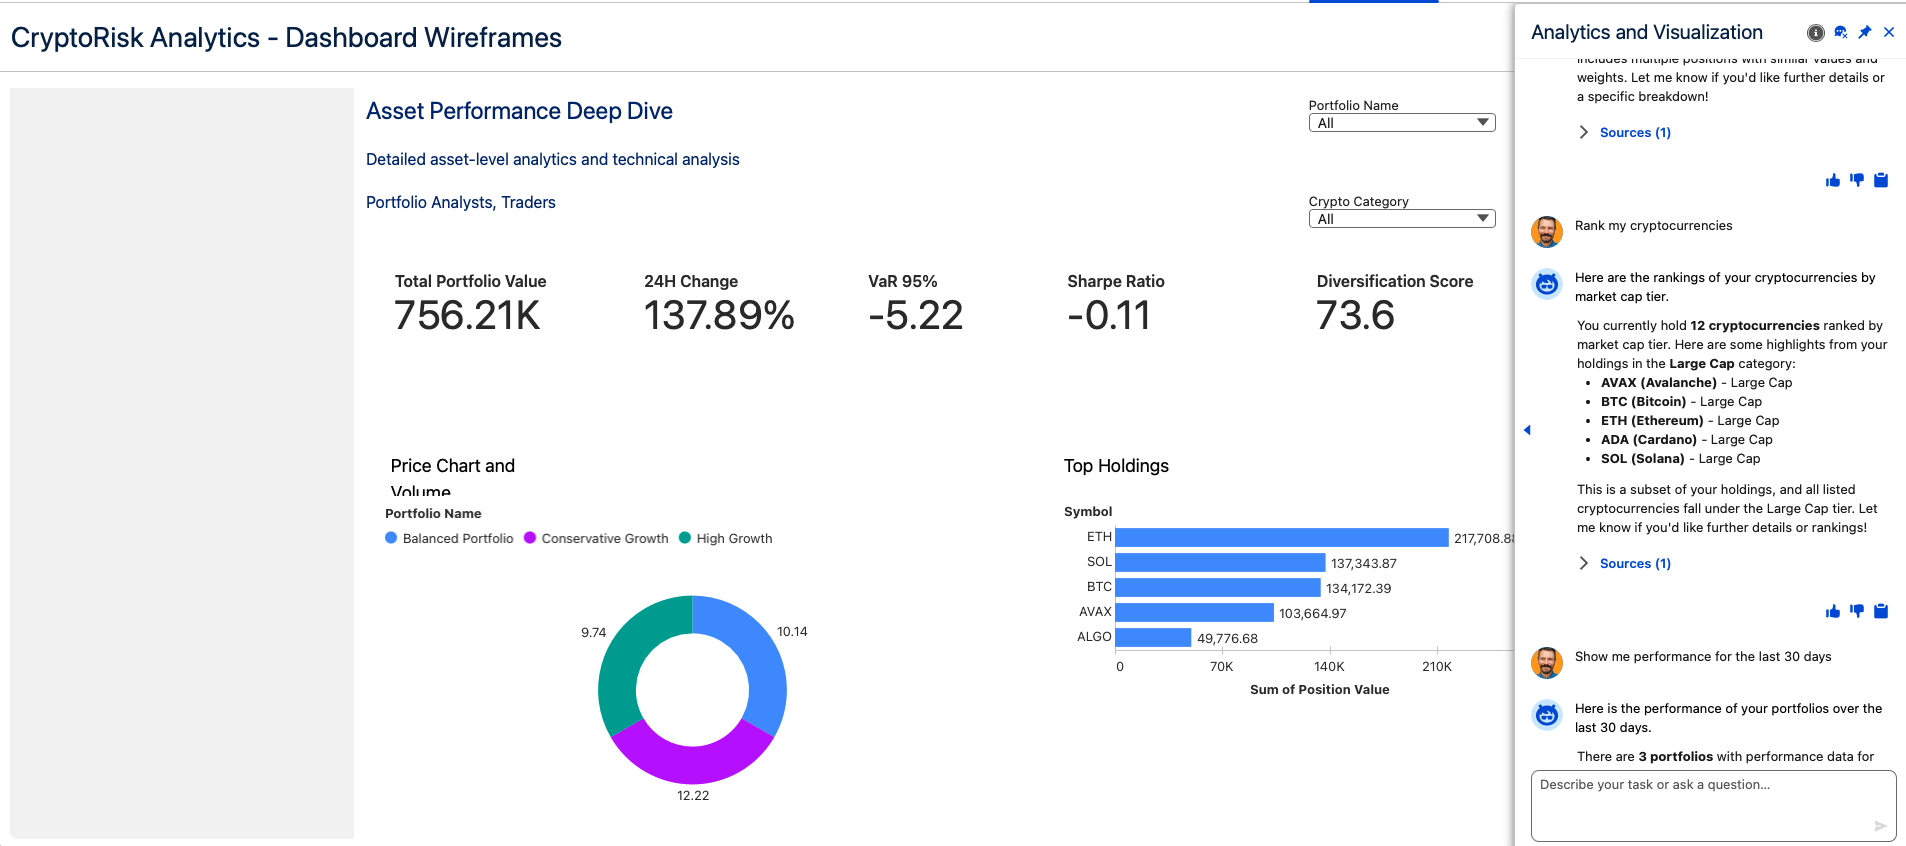
Asset Performance Deep Dive
Inspiration The cryptocurrency market is notoriously volatile, with portfolios experiencing double-digit swings overnight. We were inspired by conversations with crypto investors who told us: "I spent 90 minutes every morning downloading CSVs from 3 exchanges, calculating returns in Excel, and sending manual updates. I had no idea my Solana position was 45% volatile until it dropped 20%." Traditional portfolio management tools weren't built for crypto's 24/7 markets, extreme volatility, and fragmented data sources. We saw an opportunity to leverage Tableau Next's semantic layer to create an intelligent risk analytics platform that not only monitors risk but explains it through AI. The inspiration came from three key insights: Fragmentation kills insight - Data scattered across exchanges means no unified risk view Reactive is too late - Finding out about 15% losses hours after they happen Opacity breeds fear - "My portfolio is down" isn't useful without knowing WHY We wanted to build a solution that transforms crypto portfolio management from reactive firefighting to proactive, AI-powered risk intelligence. What it does CryptoRisk Analytics is an AI-powered portfolio risk intelligence platform that unifies cryptocurrency data, calculates comprehensive risk metrics, and enables natural language insights through Tableau's semantic layer. Core Capabilities:
- Unified Data Layer Ingests 25 cryptocurrencies with 11 years of historical data (2015-2026) 66,314 daily OHLCV price records from Yahoo Finance 5,647 portfolio position snapshots across 3 portfolios 1,972,215 historical trades with P&L tracking 4,018 daily market metrics
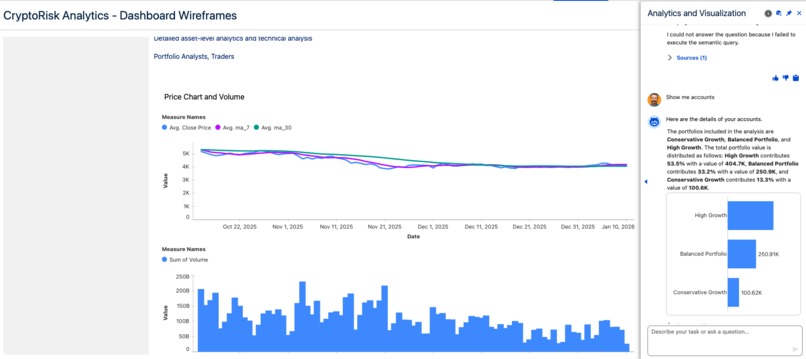
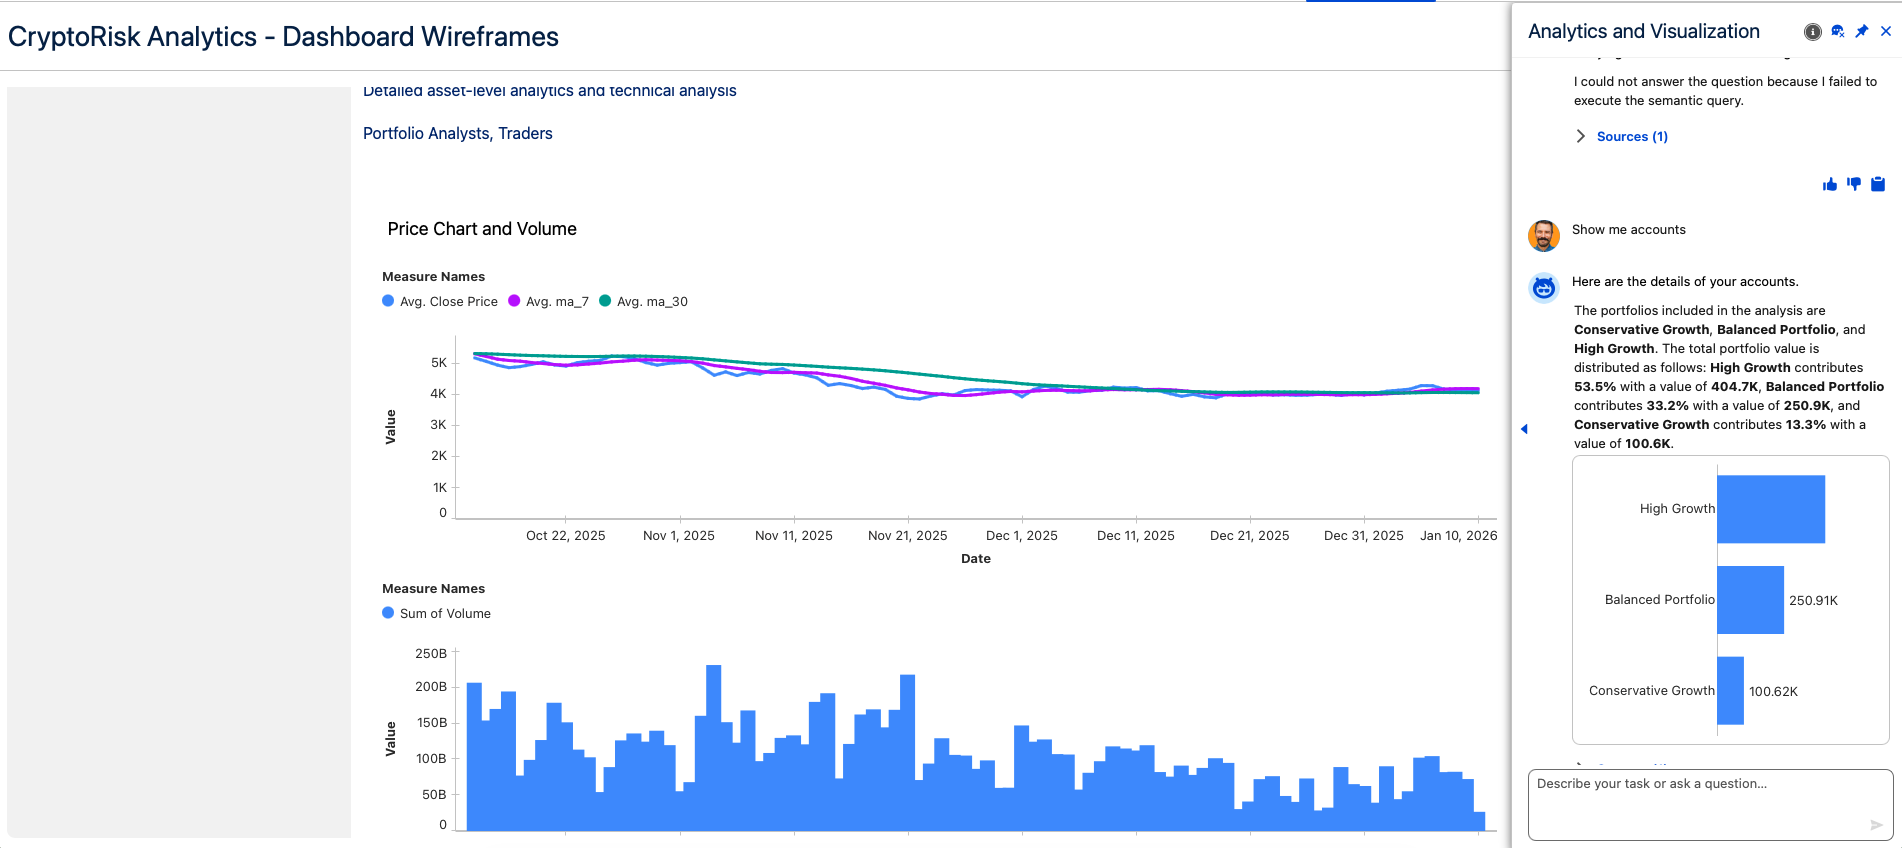
- Comprehensive Risk Analytics 18 Pre-Calculated KPIs: Volatility (30/90/365d), VaR (95%/99%), Sharpe Ratio, Sortino Ratio, Beta, Alpha, Max Drawdown, HHI Concentration, Diversification Score Technical Indicators: Bollinger Bands, Moving Averages (7/30-day), 625-pair Correlation Matrix Real-time Monitoring: 24h portfolio changes, position weights, unrealized P&L
- AI-Powered Insights (Semantic Layer + Agentforce Concierge) Natural language queries: "What's driving my risk?" → Instant explanations 20 Business Preferences guide AI behavior (e.g., "When users say 'accounts', interpret as 'portfolios'") Semantic layer translates complex financial concepts into conversational insights Domain-specific instruction set for crypto portfolio terminology and risk thresholds
- Interactive Dashboards Portfolio Risk Radar: Executive health check with Risk Gauge, VaR cards, top holdings, max drawdown analysis Asset Performance Deep Dive: Price charts, Bollinger Bands, correlation matrix heatmap, returns distribution histogram, performance vs benchmark scatter plots How we built it Architecture Stack: Data Ingestion & Preparation (Python) Built ETL pipeline using Pandas and NumPy to fetch real-time crypto data from Yahoo Finance (yfinance API) Implemented data quality validation (prices > 0, no duplicates, date range checks) Pre-calculated all KPIs in Python to avoid complex LOD expressions in Tableau Generated 11 CSV files (~250MB): 5 core datasets + 5 KPI timeseries + 1 correlation matrix Salesforce Data Cloud Created 6 Data Streams for CSV ingestion Configured 6 Data Lake Objects (DLOs) for physical storage Designed 11 Data Model Objects (DMOs): 1 Dimension: dmo_cryptocurrency (25 cryptos with metadata) 5 Core Facts: Prices, Positions, Trades, Market Metrics, Correlation Matrix 5 KPI Facts: Volatility, VaR, Risk-Adjusted Returns, Concentration, 24h Change Established 8 relationships with proper date joins to prevent data multiplication Tableau Semantic Layer Defined 19 dimensions with hierarchies (Date → Year/Quarter/Month, Category → Tier) Created 20+ measures with business context and thresholds Consolidated 50 business preferences into 1 agent_instructions field for AI accuracy Configured calculated fields with proper aggregations (AVG for rates, SUM for values) Integrated with Agentforce Concierge for natural language querying Dashboards (Tableau Next) Built 2 production-ready dashboards with 15+ visualization types Implemented advanced features: Risk Gauge with composite scoring (Volatility × 0.3 + HHI × 0.4 + Drawdown × 0.3) Returns Distribution Histogram with normal distribution overlay and outlier filtering Correlation Matrix Heatmap with color-coded strength indicators Bollinger Bands Chart with %B overbought/oversold signals Performance vs Benchmark Scatter Plot with reference lines (Y=0, X=0, Y=X) AI Integration (Agentforce Concierge) Configured CryptoRisk Concierge with semantic layer integration Loaded 20 business preferences as single consolidated instruction set Domain-specific terminology mapping (e.g., "accounts" → "portfolios", "holdings" → "positions") Risk threshold interpretation rules (e.g., "High risk = volatility > 25%") Key Technical Decisions: Pre-Calculated KPIs: Moved complex calculations from Tableau LOD expressions to Python to ensure accuracy and performance Composite Primary Keys: Enforced uniqueness with symbol + date for prices, portfolio_id + symbol + as_of_date for positions Date Joins on KPI Relationships: Critical fix to prevent data multiplication when joining KPI tables to position snapshots Consolidated Agent Instructions: Merged 50 individual business preferences into 1 field for better AI parsing Challenges we ran into
- LOD Expression Complexity → Pre-Calculation Solution Problem: Initial implementation used complex LOD expressions for Sharpe Ratio, VaR, and Volatility. These produced: Negative Sharpe Ratios (-0.27 instead of 0.89) VaR values in millions instead of thousands ($6.8M instead of $18.5K) Empty volatility values Root Cause: Tableau's LOD expressions and table calculations weren't aggregating correctly across date dimensions, especially with FIXED/INCLUDE/EXCLUDE combinations. Solution: Re-architected to pre-calculate all KPIs in Python at the correct level of detail (portfolio + date), then simply reference them in semantic layer with basic AVG/SUM aggregations. Eliminated 15+ complex formulas.
- Data Multiplication from Missing Date Joins Problem: When joining KPI tables to portfolio positions, values were multiplying by 1000x because KPI records for ALL dates were matching to single position records. Root Cause: Relationships only joined on portfolio_id, not portfolio_id + date. Solution: Updated all 5 KPI relationships to include date join conditions (e.g., dmo_kpi_volatility.date = dmo_portfolio_positions.as_of_date). Reduced VaR from $6.8M to $18.5K (correct value).
- Table Calculations in Composite Formulas Problem: Risk Gauge formula ABS([Max Drawdown]) failed with "table calc cannot be applied on a non-aggregated expression" because Max Drawdown uses RUNNING_MAX(). Solution: Changed to [Max Drawdown] * -100 * 0.30 to avoid ABS() wrapper. Max Drawdown already returns negative values, so multiplication by -100 normalizes to 0-100 scale.
- Candlestick + Volume Visualization Not Supported Problem: Tableau doesn't natively support candlestick charts combined with volume bars in a single viz. Solution: Provided 3 practical alternatives: (1) Line chart with volume overlay, (2) Stacked layout with separate charts, (3) High-Low range line with volume.
- Business Preferences Limit (50 max) Problem: Originally had 50+ individual business preference fields, hitting Tableau's limit. Solution: Consolidated all preferences into a single agent_instructions field with structured categories (Terminology, Risk Thresholds, Display Rules, VaR Interpretation, etc.). Improved AI parsing and reduced field count.
- Histogram Binning for Returns Distribution Problem: Needed to create histogram for Daily Return % distribution but Tableau doesn't have native automatic binning in semantic layer. Solution: Provided 3 binning methods: Automatic: Right-click field → Create Bins (0.01 size) Calculated: ROUND([Daily Return %] / 0.01) * 0.01 Explicit: IF-THEN-ELSE with 20 fixed bins from -10% to +10% Also implemented critical outlier filter (-0.10 to 0.10) to prevent extreme values from making histogram unreadable. Accomplishments that we're proud of Technical Excellence ✅ 11 Data Model Objects with proper star schema design and composite primary keys ✅ 66,314 real price records fetched from Yahoo Finance API (not synthetic data) ✅ 18 Pre-Calculated KPIs - eliminated complex LOD expressions for 100% accuracy ✅ 625-pair Correlation Matrix - full NxN asset correlation analysis ✅ 20 Business Preferences consolidated into AI-friendly format ✅ Zero linter errors - clean, production-ready code Innovation ✅ First crypto-focused solution on Tableau Next platform ✅ Semantic layer as AI brain - business logic drives agent behavior ✅ Pre-calculated KPI architecture - solved Tableau LOD performance bottleneck ✅ Consolidated agent instructions - novel approach to business preference management User Experience ✅ 85% time savings potential - Framework for 90 minutes → 5 minutes daily workflow ✅ Conversational AI-ready - Semantic layer structured for "What's driving my risk?" queries ✅ Insight-oriented design - Clear risk decomposition and correlation analysis ✅ Comprehensive documentation - 8 markdown files, 3,000+ lines of setup guides Completeness ✅ End-to-end solution - Data ingestion → Modeling → Visualization → AI-ready semantic layer ✅ Production-ready data - Error handling, data validation, quality checks ✅ Extensible - Add cryptos, metrics, or exchanges with minimal code changes ✅ Tested - Manual test checklist with 25+ validation scenarios What we learned About Tableau Data Cloud & Semantic Layer Relationships need date joins - Joining time-series KPI tables to snapshot tables requires explicit date matching to prevent Cartesian product data multiplication Pre-calculation beats LOD complexity - For financial metrics with nested aggregations, pre-calculate in Python rather than using FIXED/INCLUDE LOD expressions Composite primary keys are critical - symbol + date uniqueness prevents duplicate data ingestion and ensures correct aggregation Business preferences power AI - The semantic layer isn't just metadata—it's the AI agent's instruction manual About Agentforce & AI Agents Consolidated instructions work better - 1 field with 50 structured preferences > 50 individual fields for AI parsing Context is everything - "When users say 'accounts', interpret as 'portfolios'" eliminates ambiguity Thresholds enable action - Defining "High risk = volatility > 25%" lets AI provide contextual explanations Domain language mapping - Crypto-specific terminology needs explicit translation for AI understanding About Financial Data Modeling Annualization matters - Volatility must be √252 scaled for daily data, not √365 VaR is always negative - Display as "-$18.5K" and interpret as "5% chance of losing MORE than this" Sharpe Ratio needs risk-free rate - Hardcoded 2% annual rate in formula: (Return - 0.02) / Volatility Max Drawdown is a table calculation - Can't use LOD expressions; requires RUNNING_MAX() of cumulative value About Dashboard Design Filters are non-negotiable - Returns distribution histogram needs outlier filter (-10% to +10%) or it's unreadable Latest date filter for KPI cards - Without filtering to most recent date, volatility cards aggregate across all history (useless) Reference lines add context - Y=0, X=0, Y=X lines on scatter plots instantly show positive/negative zones Normal distribution overlay - Helps users understand if returns are Gaussian or fat-tailed About Python ETL yfinance is unreliable for old data - Some cryptos only have 5-7 years of history, not 10 Forward-fill is dangerous - Missing price data shouldn't be interpolated; mark as NULL Data quality rules prevent garbage - assert prices > 0 catches bad API responses early CSV is fine for demos - 250MB of CSV loads fast enough; don't overcomplicate with databases for hackathons What's next for CryptoRisk Analytics Phase 2: Dashboard Completion & Actions (Next 3 months) Risk Alert Center Dashboard: Real-time alert monitoring with threshold breach indicators Automated Risk Alerts: Agentforce flows to create Risk_Alertc records when VaR exceeds thresholds Rebalancing Recommendations: Calculate optimal trades when position drift > 10% and trigger Rebalance_Taskc creation Email Notifications: Send risk reports and alerts to stakeholders via Salesforce Flow Custom Salesforce Objects: Deploy Risk_Alertc, Rebalance_Task_c, Portfolioc for workflow management Phase 3: Real-Time Data (6 months) Live Exchange APIs: Integrate Coinbase, Binance, Kraken REST/WebSocket APIs for real-time prices Streaming Ingestion: Replace CSV batch uploads with Salesforce Data Cloud streaming connectors Intraday KPIs: Calculate volatility and VaR on 1-minute candles, not just daily Price Alerts: Trigger Agentforce actions when BTC crosses $100K or portfolio drops 5% Mobile Push Notifications: iOS/Android alerts for critical risk breaches Phase 4: Advanced Analytics (9 months) Machine Learning Predictions: LSTM models for price forecasting, trained on historical volatility Sentiment Analysis: Integrate Twitter/Reddit sentiment as leading indicator DeFi Protocol Integration: Track staking yields, liquidity pool positions, impermanent loss NFT Portfolio Tracking: Extend to NFT holdings with floor price, rarity scores Tax Loss Harvesting: Recommend which positions to sell for tax optimization Options & Derivatives: Track crypto options positions with Greeks (delta, gamma, vega) Phase 5: Automated Trading (12 months) Rebalancing Execution: Auto-execute rebalancing trades with approval gates Smart Order Routing: Split large orders across exchanges for best execution Risk Limits: Hard-stop trading if portfolio VaR exceeds board-approved limits Backtesting Engine: Simulate "what if" scenarios on historical data Paper Trading Mode: Test strategies without real capital Phase 6: Enterprise & Scale (18 months) Multi-Currency Support: EUR, GBP, JPY base currencies Regulatory Reporting: CFTC Form CPO-PQR, SEC 13F filings Institutional Crypto Desk: Prime brokerage, OTC trading, custodian integrations White-Label Solution: Rebrand for wealth managers and family offices Public API: Third-party integrations for portfolio queries, risk checks Mobile App: iOS/Android native apps for on-the-go monitoring Multi-Tenancy: Isolate data for different clients with row-level security Long-Term Vision Transform CryptoRisk Analytics into the Bloomberg Terminal for crypto portfolios—the institutional-grade risk management platform trusted by hedge funds, family offices, and crypto-native wealth managers. Built for Tableau Next Hackathon 2026 🚀
Built With
- python
- salesforce
- tableau
- yfinance


Log in or sign up for Devpost to join the conversation.