Inspiration
While contributing to pyjanitor, an open-source Python library, I ran into a problem that many new contributors eventually face: I had a question about a specific file, but no idea who to ask.
Yes, GitHub has commit history, but manually scrolling through commits to figure out who actually understands a file—or who's still active—felt inefficient. It made us wonder:
"What if GitHub could instantly tell you who knows this file best?"
That idea quickly grew into something bigger. Every open-source project and software team faces the same challenge: knowledge gets scattered across hundreds of files, contributors come and go, and it's difficult to know the right person to contact. We wanted to build a tool that makes that knowledge visible using information that already exists inside every GitHub repository.
What it does
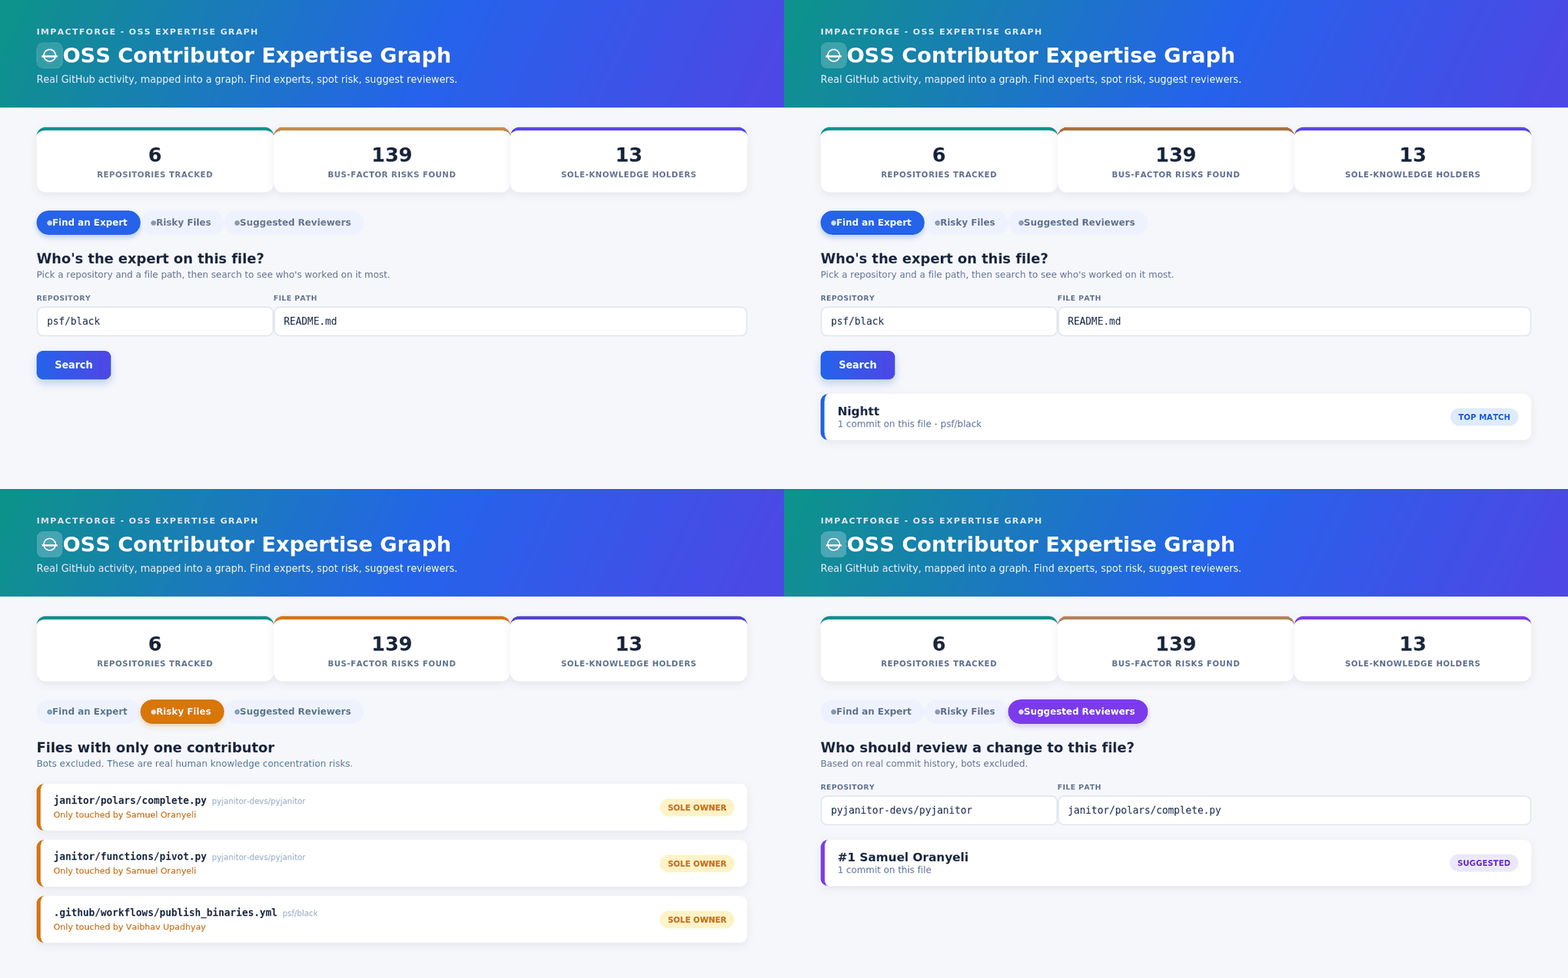
Open-Source Contributor Expertise Graph transforms GitHub commit history into an interactive knowledge graph using Neo4j.
The application currently analyzes multiple repositories—including our own project, pyjanitor, and pandas—and maps relationships between repositories, contributors, commits, and files.
Using that graph, the application answers three practical questions:
🎯 File Experts – Given a file, who has contributed to it the most? Contributors are ranked using commit frequency and code changes. ⚠️ Knowledge Risk – Which files depend heavily on a single contributor? These files represent potential knowledge concentration and may become difficult to maintain if that contributor becomes unavailable. 🧠 Methodology – The application explains how expertise scores are calculated so users understand why contributors are ranked the way they are.
Instead of manually digging through commit history, users can quickly discover who understands a piece of code and identify potential knowledge bottlenecks.
How we built it
We built the project in four stages.
Data Collection
We used the GitHub REST API to collect repository metadata, commits, contributors, and the files modified in each commit. A personal access token helped us stay within GitHub's API rate limits.
Graph Database
The collected data is stored in Neo4j AuraDB as a graph consisting of four node types:
Repository Person Commit File
These are connected using relationships such as AUTHORED, CHANGED, and BELONGS_TO.
A graph database was a natural choice because our questions are relationship-based ("Who worked on this file?" or "Which files depend on one contributor?"), making graph traversals much simpler than complex SQL joins.
Backend
We wrote reusable Cypher queries to retrieve repository summaries, contributor expertise rankings, and knowledge-risk information. These queries are wrapped inside Python functions to keep the application modular.
Frontend
The user interface was built using Streamlit, allowing us to rapidly turn our backend logic into an interactive dashboard.
We intentionally started with a single repository before expanding to multiple repositories. Building a small, working pipeline first helped us validate our graph model and catch design issues early.
Challenges we ran into
One of the biggest challenges was learning graph databases and Cypher from scratch. Thinking in terms of nodes and relationships instead of tables required a completely different mindset.
Working with the GitHub API also introduced rate limits, so we had to carefully manage how much history we downloaded and cache responses while developing.
Another interesting challenge came from the data itself. Automated accounts such as dependabot and GitHub Actions sometimes appeared to be the primary contributor for certain files. While technically correct, that didn't represent real human expertise, so we added filters to remove bot accounts from our analysis.
We also learned that pulling only a small number of recent commits can produce misleading results. Early versions of our application flagged almost every file as a knowledge risk simply because there wasn't enough historical data. Increasing the available history made the results much more meaningful.
Accomplishments that we're proud of
Built a complete end-to-end pipeline from GitHub → Neo4j → Cypher → Streamlit. Successfully scaled from analyzing one repository to multiple repositories without changing the overall architecture. Created an application that makes graph databases approachable for developers who may have never worked with Neo4j before. Designed a clean, interactive dashboard that helps users explore repository knowledge instead of manually searching through commit history.
What we learned
This project taught us that graph databases are an excellent fit for problems centered around relationships rather than individual records.
We also learned that real-world data is rarely clean. Bot accounts, incomplete commit histories, and inconsistent contributor activity all required thoughtful handling before meaningful insights could be generated.
Most importantly, we learned the value of building a small, working version first and then expanding it incrementally instead of trying to build everything at once.
What's next
We're excited to continue improving the project by adding:
📈 Deeper commit history for more accurate expertise scoring. 🌐 Interactive graph visualizations showing relationships between contributors and files. 🔗 Support for analyzing any public GitHub repository directly instead of selecting from a predefined list. 🤝 Organization-wide expertise analysis across multiple repositories. 📊 Additional contributor metrics such as recency of contributions and pull request activity. Built With: Python Streamlit Neo4j AuraDB Cypher GitHub REST API

Log in or sign up for Devpost to join the conversation.