-
These United States of America
Inspiration
I'm American and my friends make fun of me for it all the time :(. Here's another one of their indictments of the situation at home. Roger and Marcus wanted to work with Leap so we let them, and you can now move the map with leap!
What it does
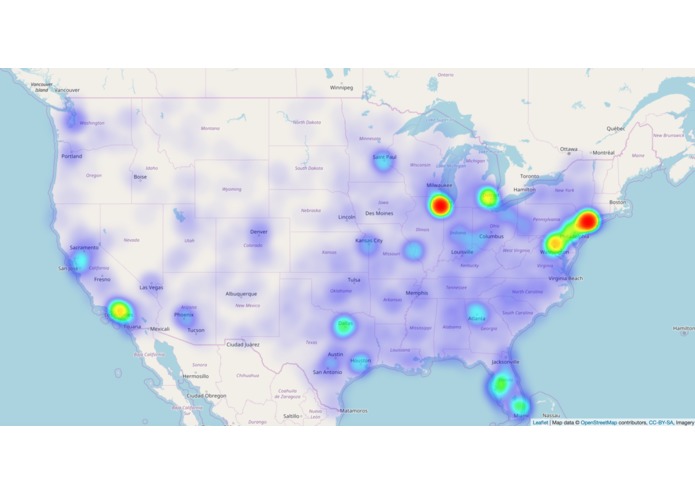
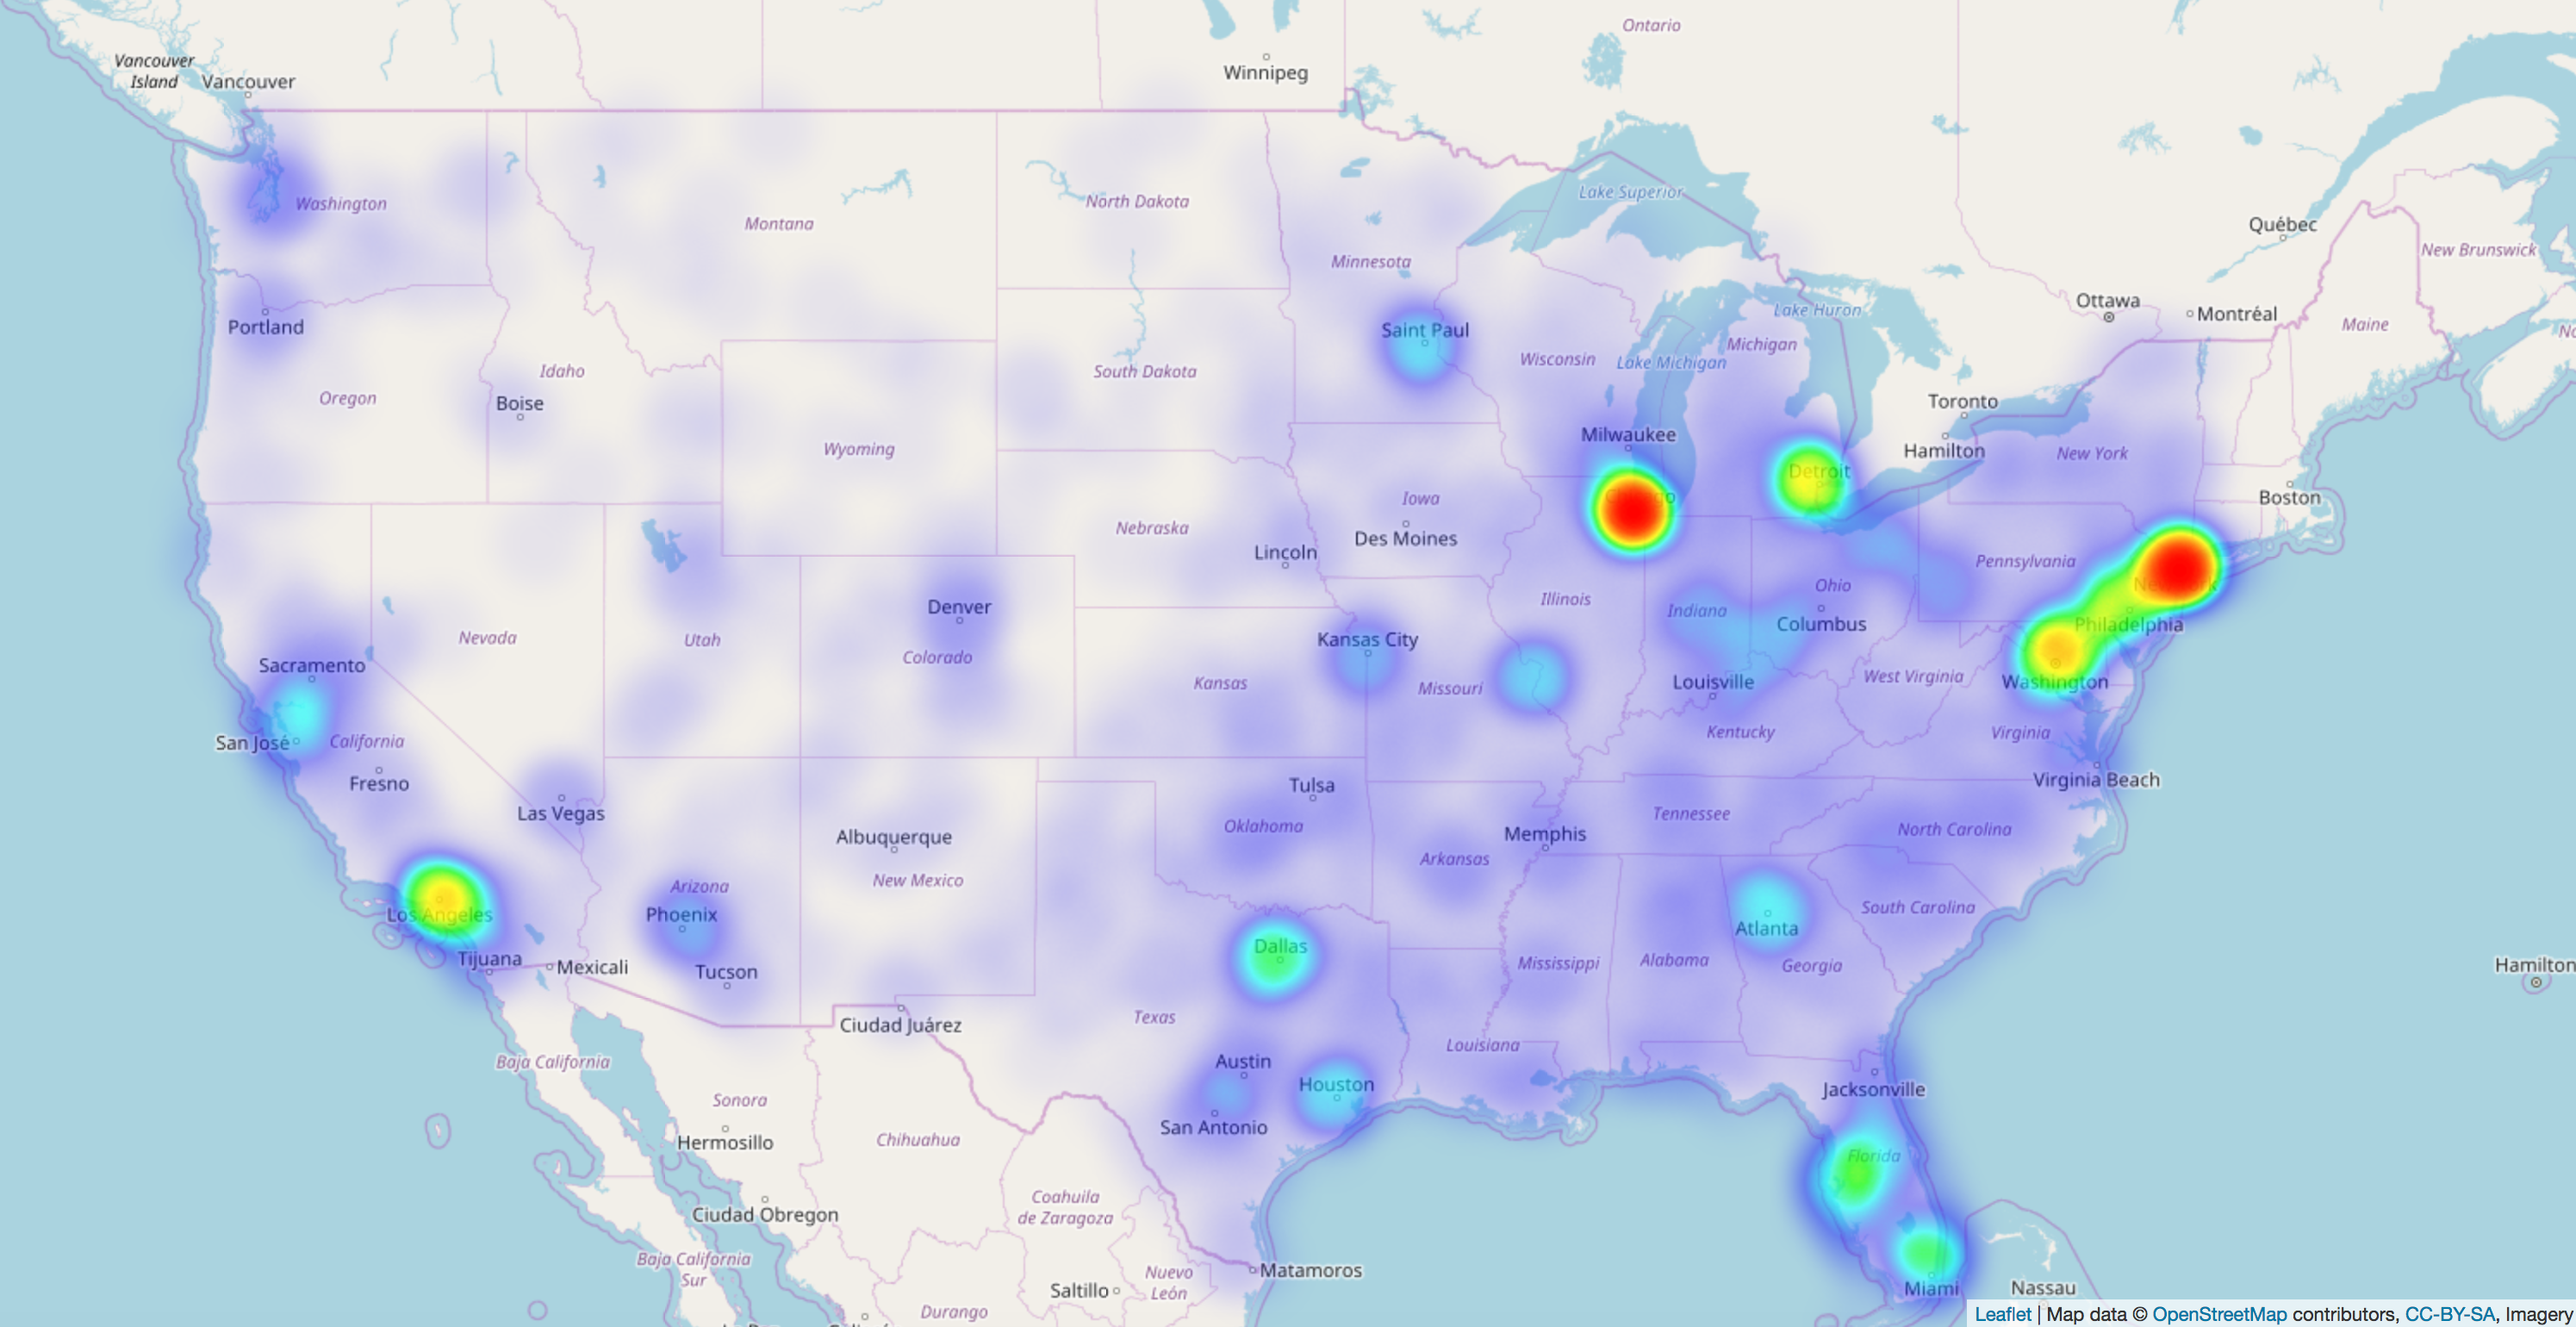
OHC shows you where it's most expensive to be sick in America.
How we built it
We used leaflet.js and a package for it called leaflet-heat to draw the map and then draw a heatmap. It gets data from a python web server hosted on AWS which parses a massive 35 megabyte CSV from the US government's open data source, data.gov. You can control this map with leap, using a different repo
Challenges we ran into
Getting leap to work was quite the challenge. Most of us were essentially new to Javascript, not to mention the Javascript API for the leap! Setting the max bounds and max zoom for the map was quite difficult as well.
Accomplishments that we're proud of
We're really happy that we got everything in the scope of our project working! Getting the leap to work in-browser was very impressive as well, we think!
What we learned
Javascript is insufferable, but it's something we all need to learn because web is the future and nothing is about to change that.
What's next for Open Health Charges
We're going to get a
Built With
- amazon-web-services
- data.gov
- jekyll
- leaflet-heat
- leaflet.js
- leap-motion
- python


Log in or sign up for Devpost to join the conversation.