-
-
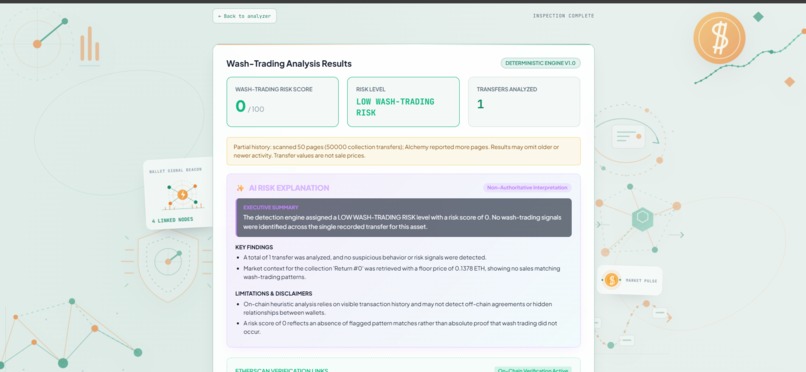
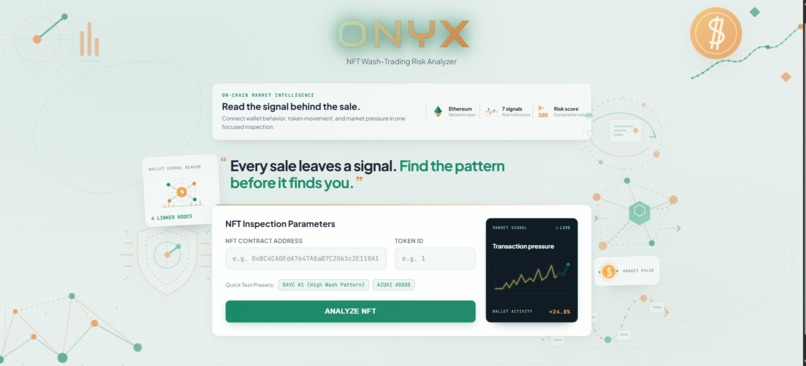
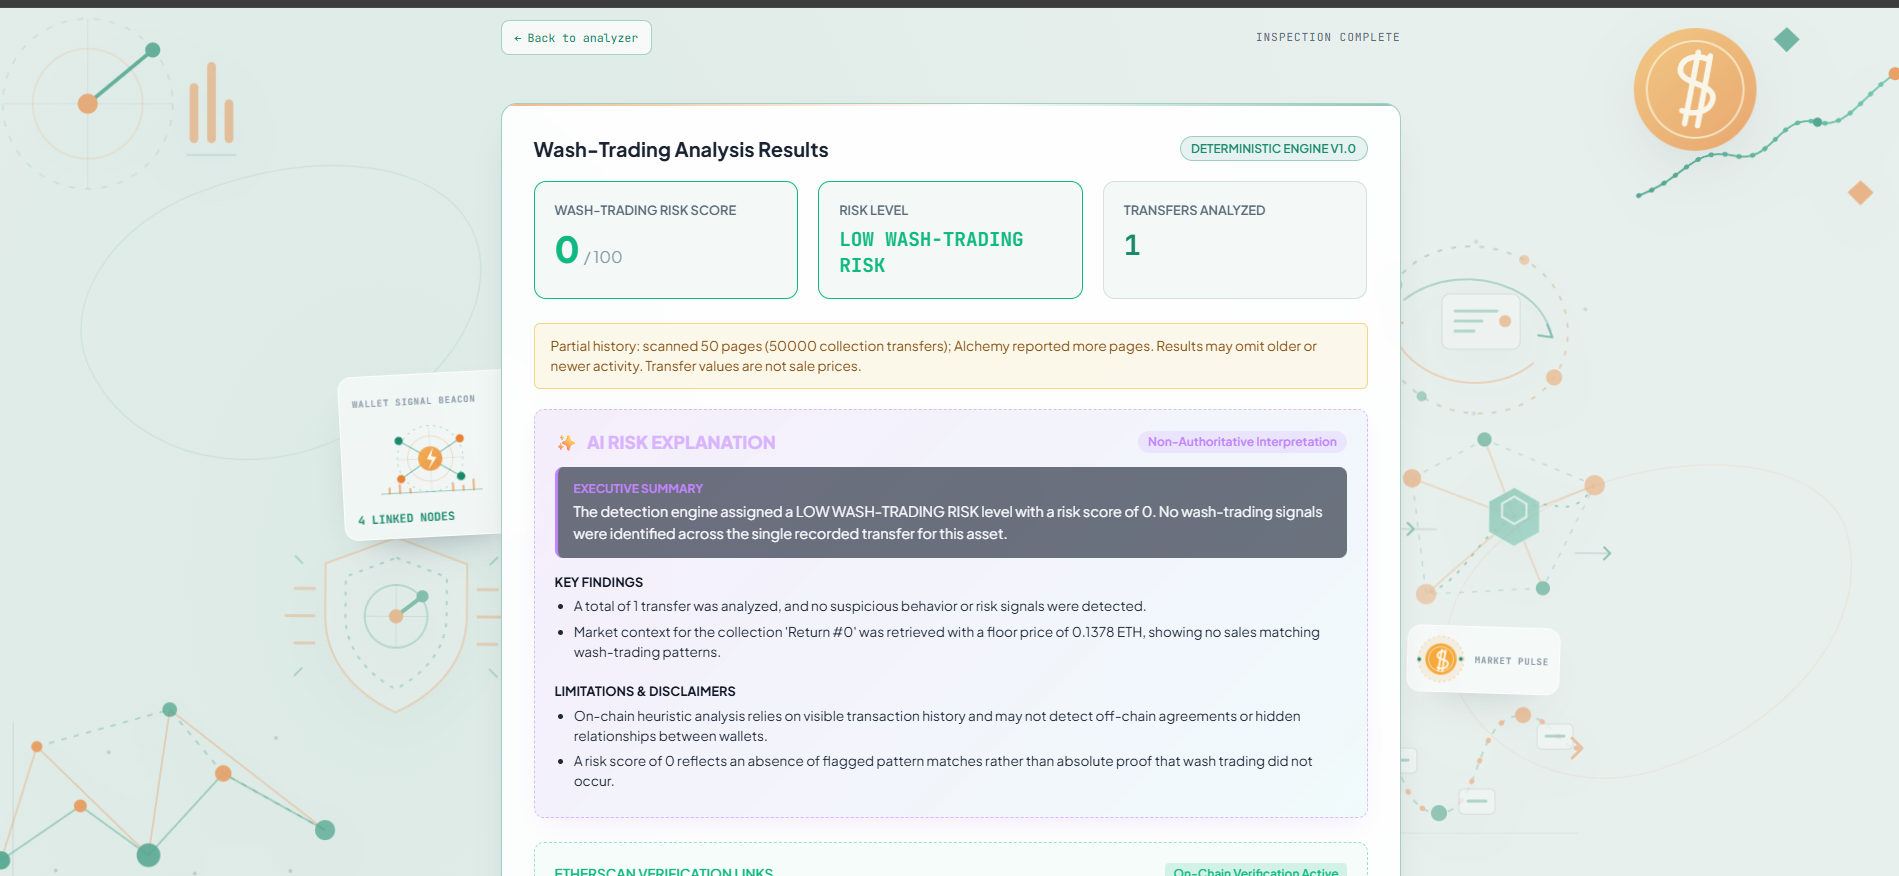
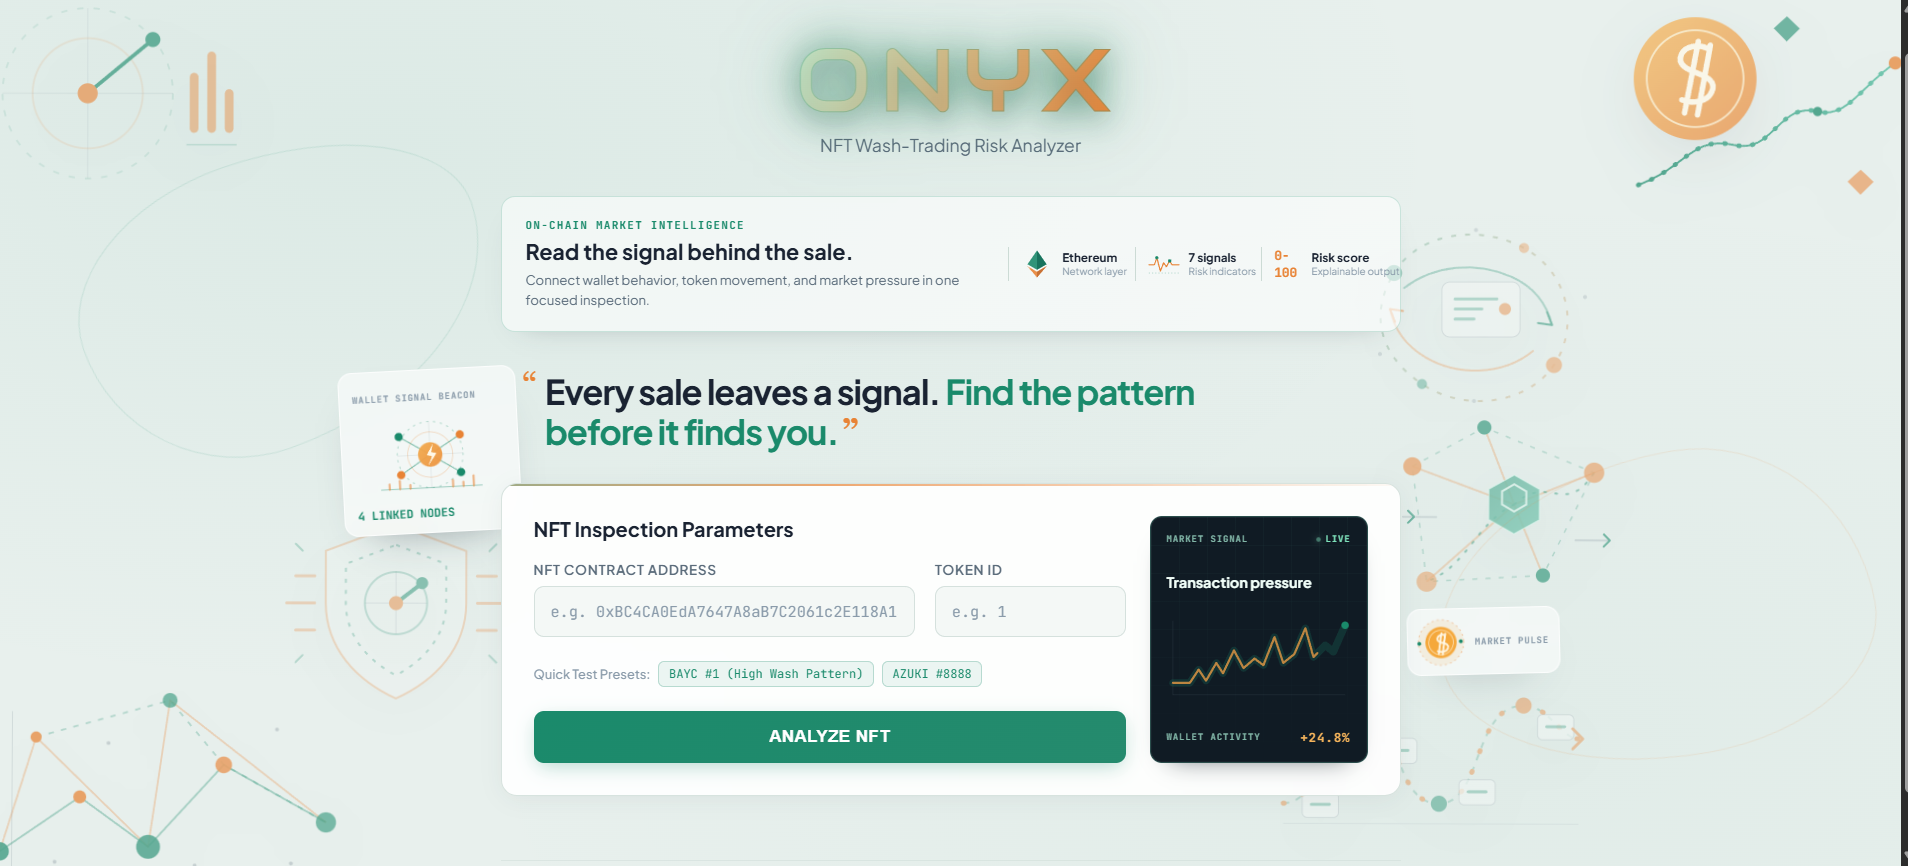
Frontend of Onyx - NFT wash trading risk analyzer
-
Onyx: The Story Behind the Project
This project started with a simple question: how can we detect suspicious NFT trading before it looks normal? I was inspired by the way NFT markets can appear healthy while hiding wash-trading patterns through repeated wallet activity, circular transfers, and inflated volume. I wanted to build a tool that could analyze blockchain evidence, surface risky behavior, and explain it clearly to users.
Inspiration
The inspiration for Onyx came from curiosity, concern, and a desire to build something useful.
We had seen crypto and NFT communities celebrate trading volume without enough scrutiny of whether that volume was genuine. At the same time, blockchain data is incredibly rich but also noisy. Wallets, transactions, and token movements are difficult to interpret without a clear framework.
We wanted to create a tool that:
- analyzes NFT trading patterns using blockchain evidence
- highlights suspicious activity in a transparent way
- explains the result in an understandable way to non-experts
- avoids pretending to know intent where only patterns can be observed
What we Learned
This project taught us a lot about both software engineering and blockchain data analysis.
Data is powerful, but context is everything
Blockchain data alone is not enough. The same transaction pattern might look suspicious in one context and harmless in another. You need to combine:
- wallet relationships
- trade frequency
- price anomalies
- funding patterns
- market context
This led us to think of detection as a reasoning problem, not just a query problem.
Explainability matters as much as accuracy
A system is much more valuable when it can explain itself. In trust-sensitive contexts, users want to know why a score exists, not just what it is.
That is why we built Onyx around explainable signals and a transparent risk model. The final score is not a black box—it is built from interpretable features.
Frontend and backend must feel like one system
This project is not just about API calls or rendering graphs. It requires the frontend, backend, and data logic to work together as a unified product.
we learned how important intuitive UX is when working with complex data. If the interface is confusing, even a strong detection engine loses value.
Real-world problems are messy
Blockchain data is inconsistent, APIs fail, and external services are unreliable. I learned to design for resilience and build systems that degrade gracefully rather than break.
How We have Built It
Onyx combines a Python backend, blockchain and market data APIs, deterministic risk scoring, and a React frontend for interaction and visualization.
Architecture
The backend collects transaction and market data from Alchemy, OpenSea, and Etherscan. It evaluates NFT wallets and collections against multiple signals that indicate wash-trading behavior, then combines them into a single score.
The frontend presents findings as an interactive dashboard with visual network graphs of wallet relationships and transaction flows.
Risk Score Model
The system combines weighted indicators into a single score:
$$\text{Risk Score} = \sum_{i=1}^{n} w_i s_i$$
where \(w_i\) is the weight for signal \(i\) and \(s_i\) is the normalized signal score.
The score stays within 0–100 to make it easy to communicate and compare risk levels.
Seven Explainable Signals
- Repeated Trading (Max 25 pts) — How often the same wallets trade the same NFT
- Circular Trading (Max 20 pts) — Transactions that flow in cycles between wallets
- Shared Funding (Max 15 pts) — Wallets funded from common sources
- Rapid Trading (Max 10 pts) — Abnormally fast transaction velocity
- Price / Value Anomaly (Max 15 pts) — Trading at prices far from market
- Wallet Behavior (Max 10 pts) — Unusual wallet activity patterns
- Funding / Gas Relationship (Max 5 pts) — Mismatches between funding and gas usage
Each signal contributes interpretable evidence to the final score.
Frontend Experience
The dashboard displays wallets as nodes and transactions as directed edges with ETH values. Circular trades are highlighted visually. This lets users inspect the network and understand the evidence behind the risk score without parsing raw data.
Challenges we Faced
Handling incomplete or inconsistent blockchain data
Blockchain APIs do not always behave consistently. Some requests fail, return partial results, or require fallback strategies.
I designed the backend to be resilient and handle incomplete datasets carefully, with graceful degradation when external services are unavailable.
Distinguishing pattern from intent
One of the biggest conceptual challenges is that blockchain analysis reveals patterns without proving intent. A suspicious pattern may indicate risk, but does not necessarily prove malicious behavior.
This is why Onyx frames its output as a risk assessment, not an accusation. It is a heuristic tool, not a final judgment.
Designing a clear explanation layer
The hardest part was translating technical findings into plain English without overselling them. Users should feel informed, not confused or alarmed.
I worked on making explanations clear, concise, and grounded in evidence—using Gemini AI to translate structured data into readable summaries while respecting the underlying scores.
Balancing complexity with usability
It is easy for a technical project to become overwhelming. We wanted the tool to feel polished and approachable while handling sophisticated analysis.
This required tradeoffs between detailed analysis and clean UX. The result is a system that is explainable without being cluttered.
Final Thoughts
Onyx sits at the intersection of blockchain analysis, data storytelling, and product design.
What started as an idea about detecting suspicious NFT trading evolved into a full-stack product focused on trust, transparency, and explainability. It taught me how to combine technical rigor with practical product thinking.
We are proud that Onyx does more than compute a score. It helps people see the evidence, understand the patterns, and ask better questions about market behavior.
If nothing else, we hope this project demonstrates that blockchain data can be used not just to observe markets, but to make them more understandable and safer to navigate.
Built With
- ai
- analytics
- api
- blockchain
- crypto
- dashboard
- data-visualization
- ethereum
- fastapi
- fraud-detection
- gemini
- javascript
- nft
- python
- react
- risk-analysis
- vite
- wash-trading
- web3


Log in or sign up for Devpost to join the conversation.