Inspiration
When someone calls 911, the minutes before an ambulance arrives matter. Yet most EMS reporting gives a single monthly average, which hides two very different problems: places that are always slow, and places that just got slower. A quality supervisor needs to tell these apart. A persistent gap might call for more resources, while a sudden change points to something specific, like a station closure or a summer surge, worth investigating now.
We picked the Health Systems: Emergency Response prompt and asked one question: can we give an EMS quality supervisor a dashboard that separates real problems from random noise, using statistics they can trust?
What it does
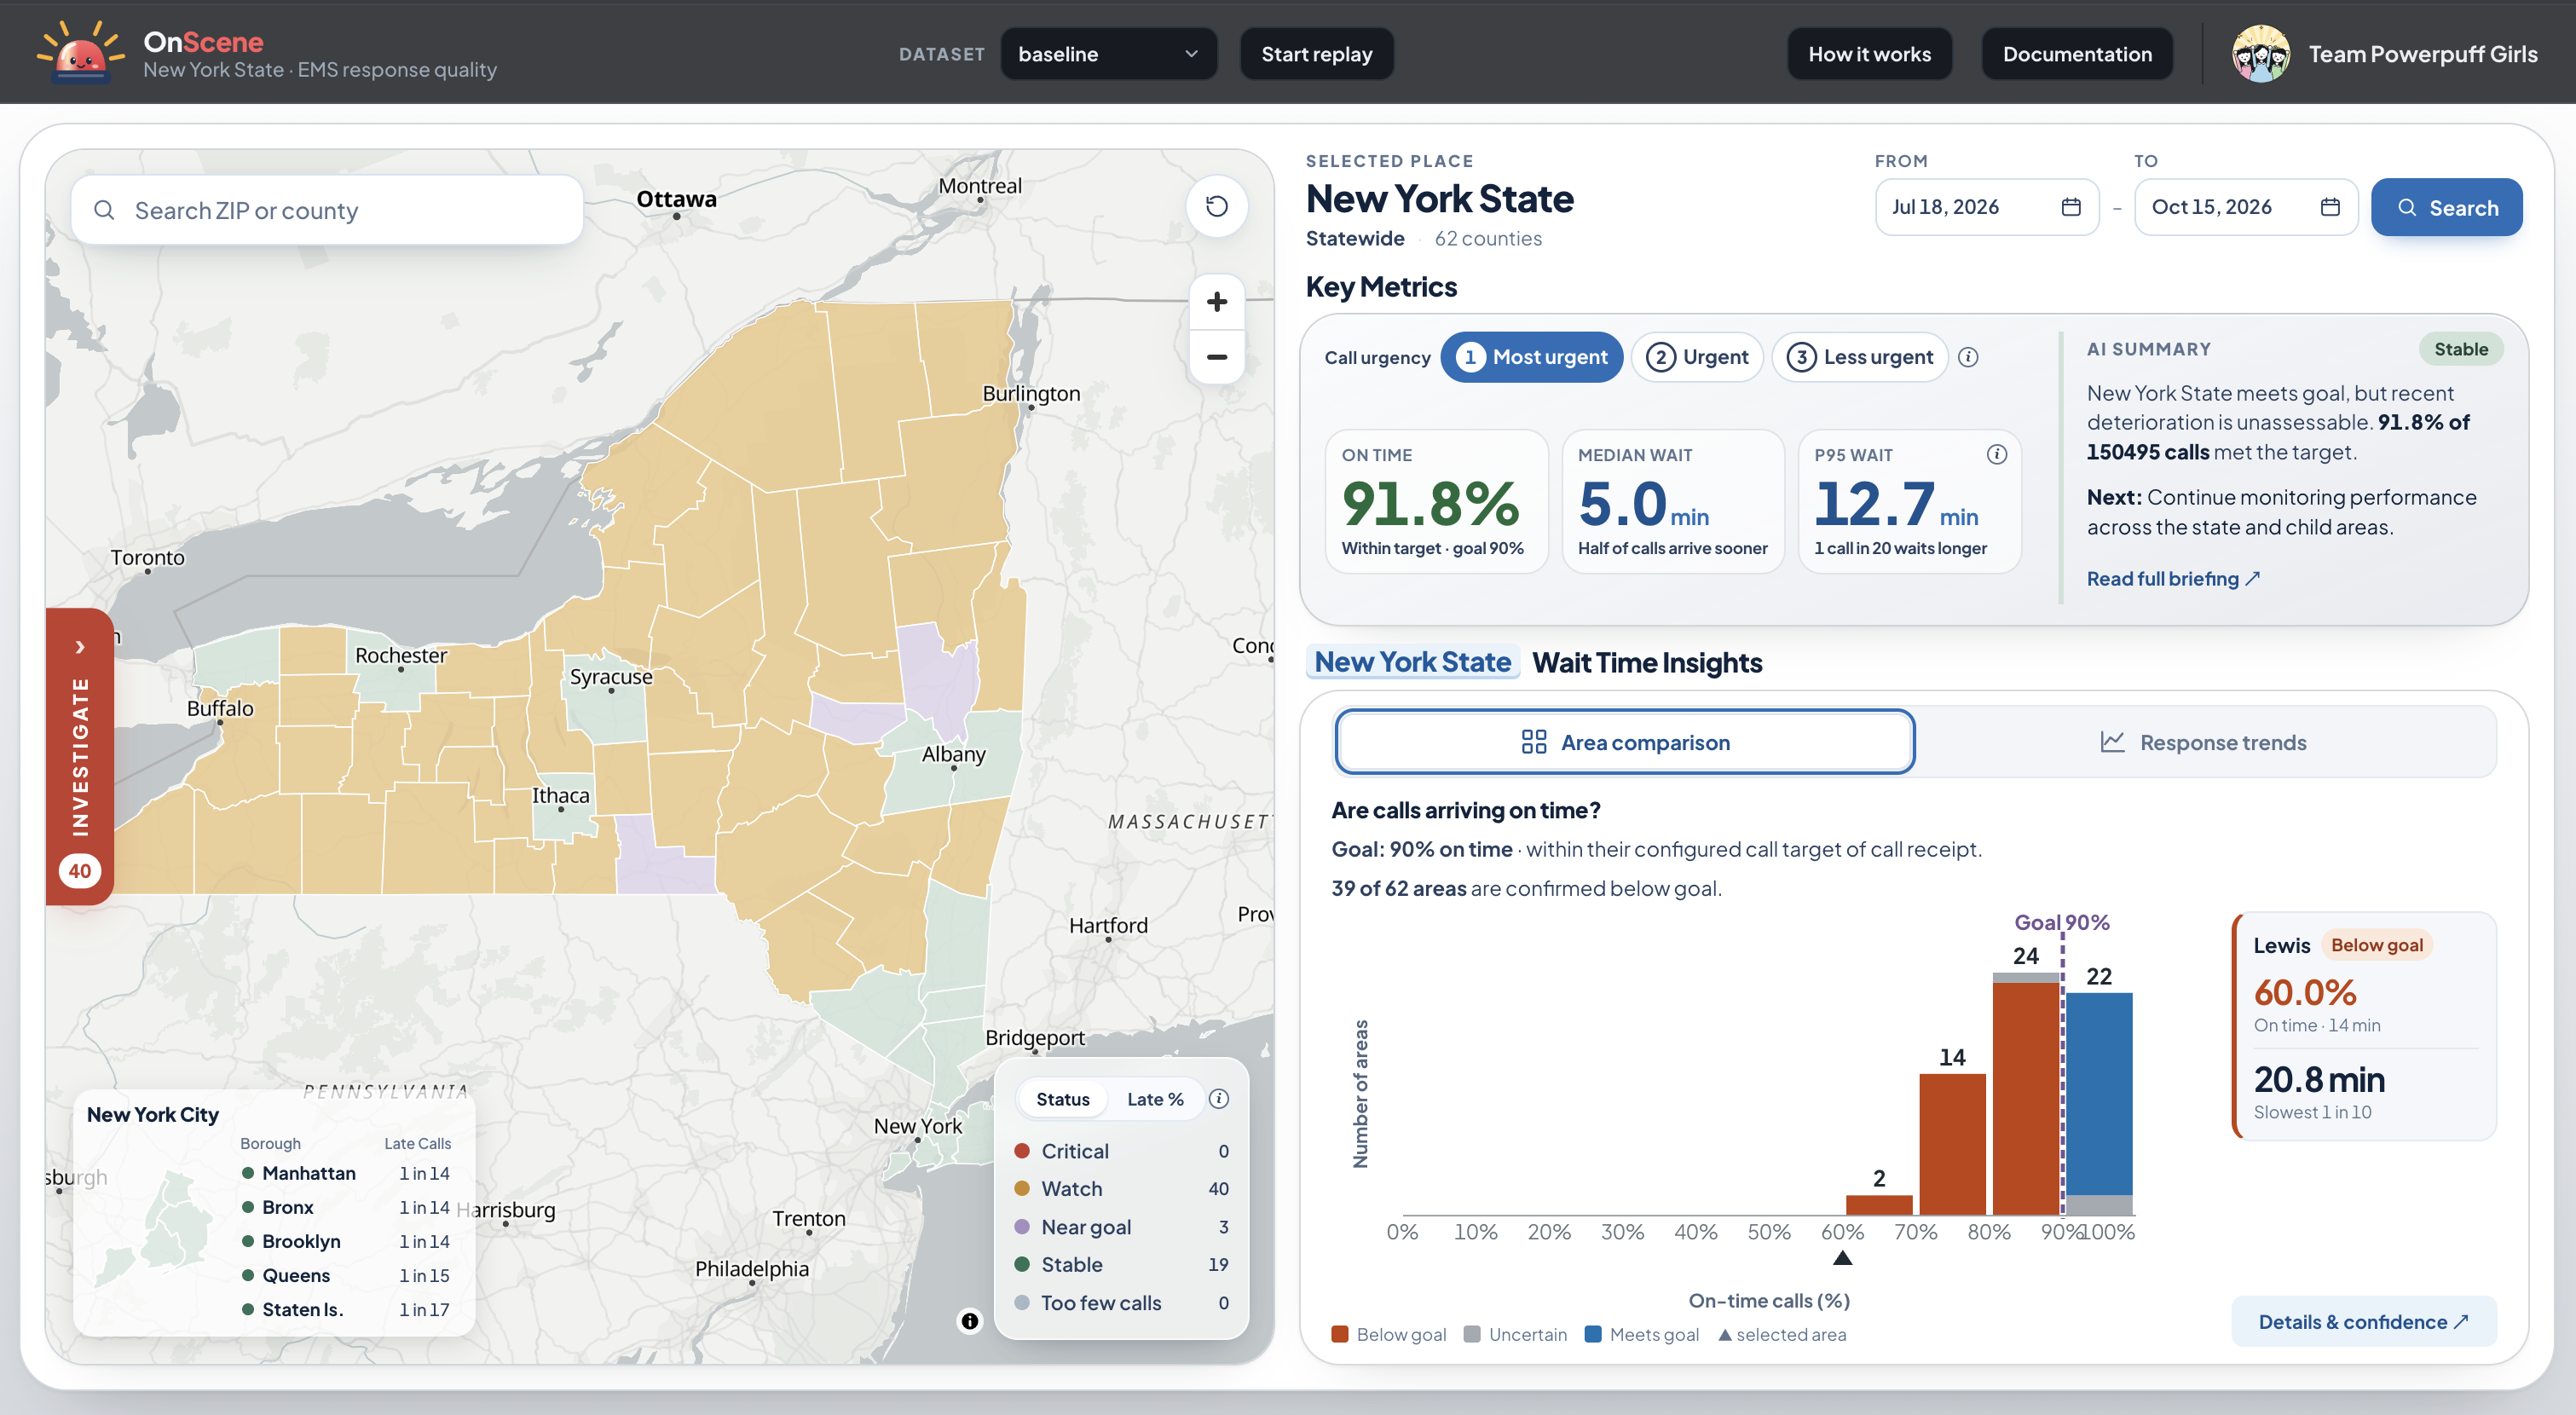
OnScene is a read-only quality-monitoring dashboard for EMS response times across New York State. It drills down from the state to its 62 counties to 1,826 ZIP code areas.
For every place, OnScene makes two separate judgments and keeps them apart, because they answer different questions:
| Question | Method | Result |
|---|---|---|
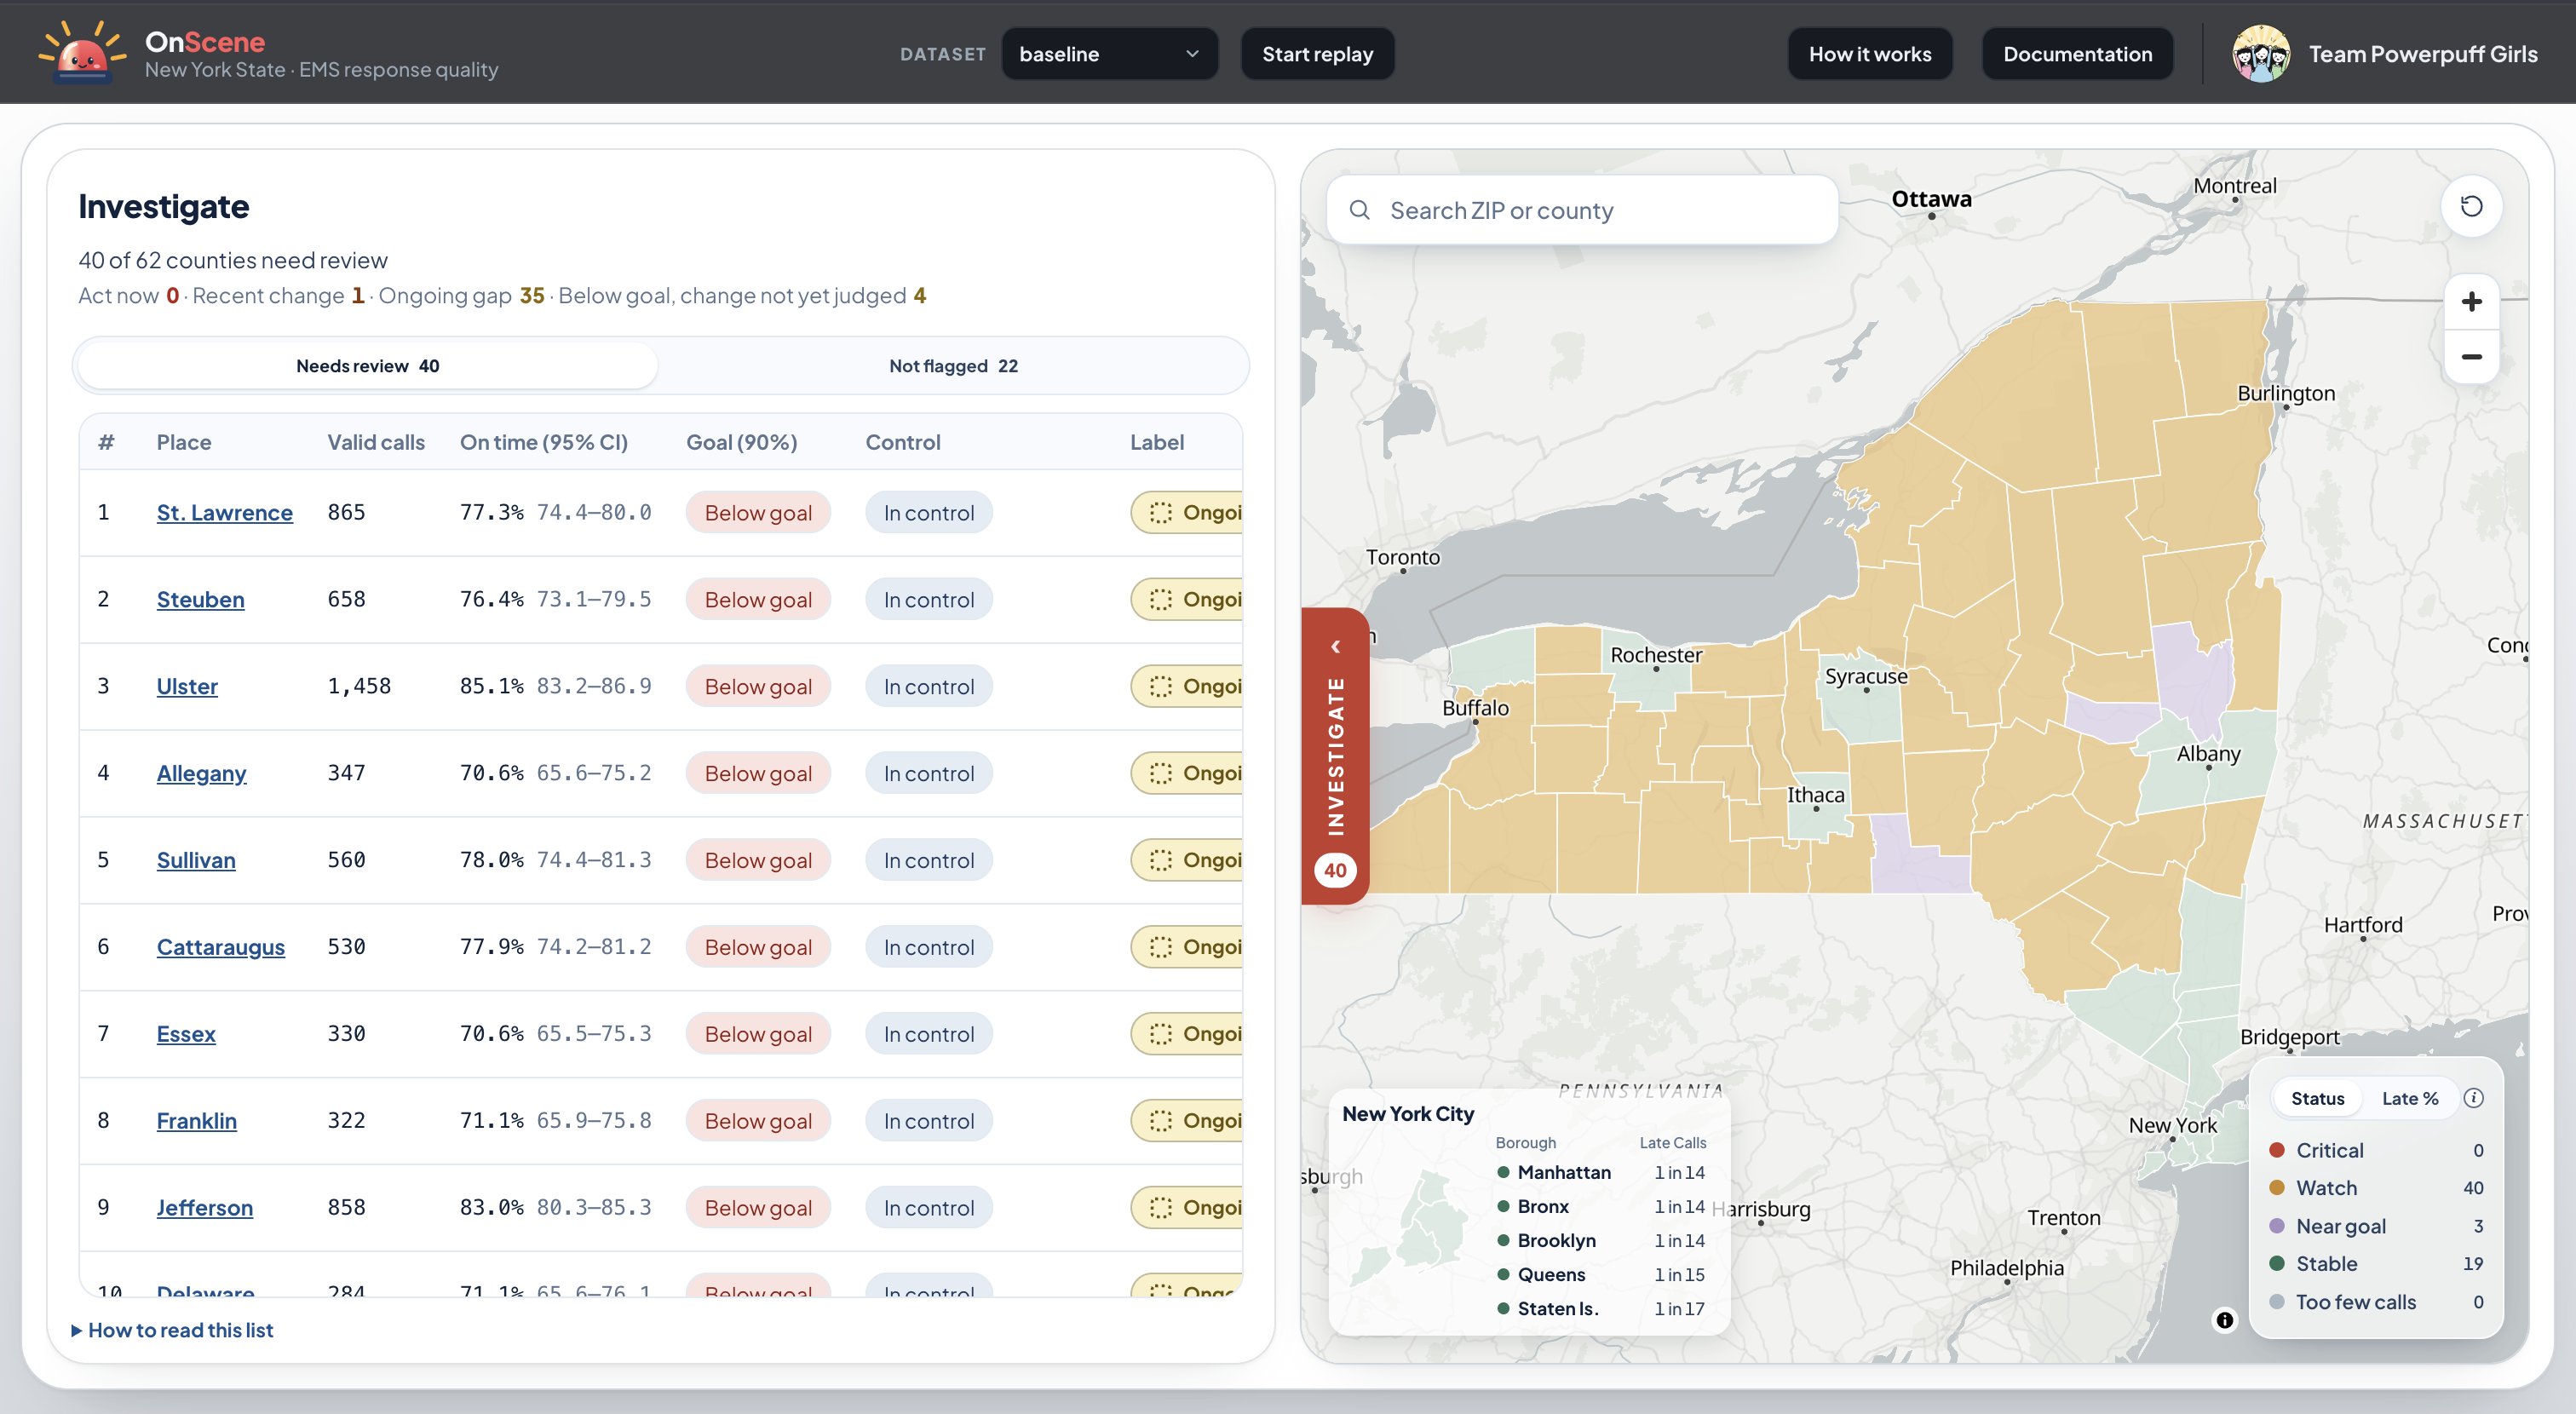
| Are calls meeting the service goal? | On-time rate with a 95% Wilson interval | Meets goal / Below goal / Inconclusive |
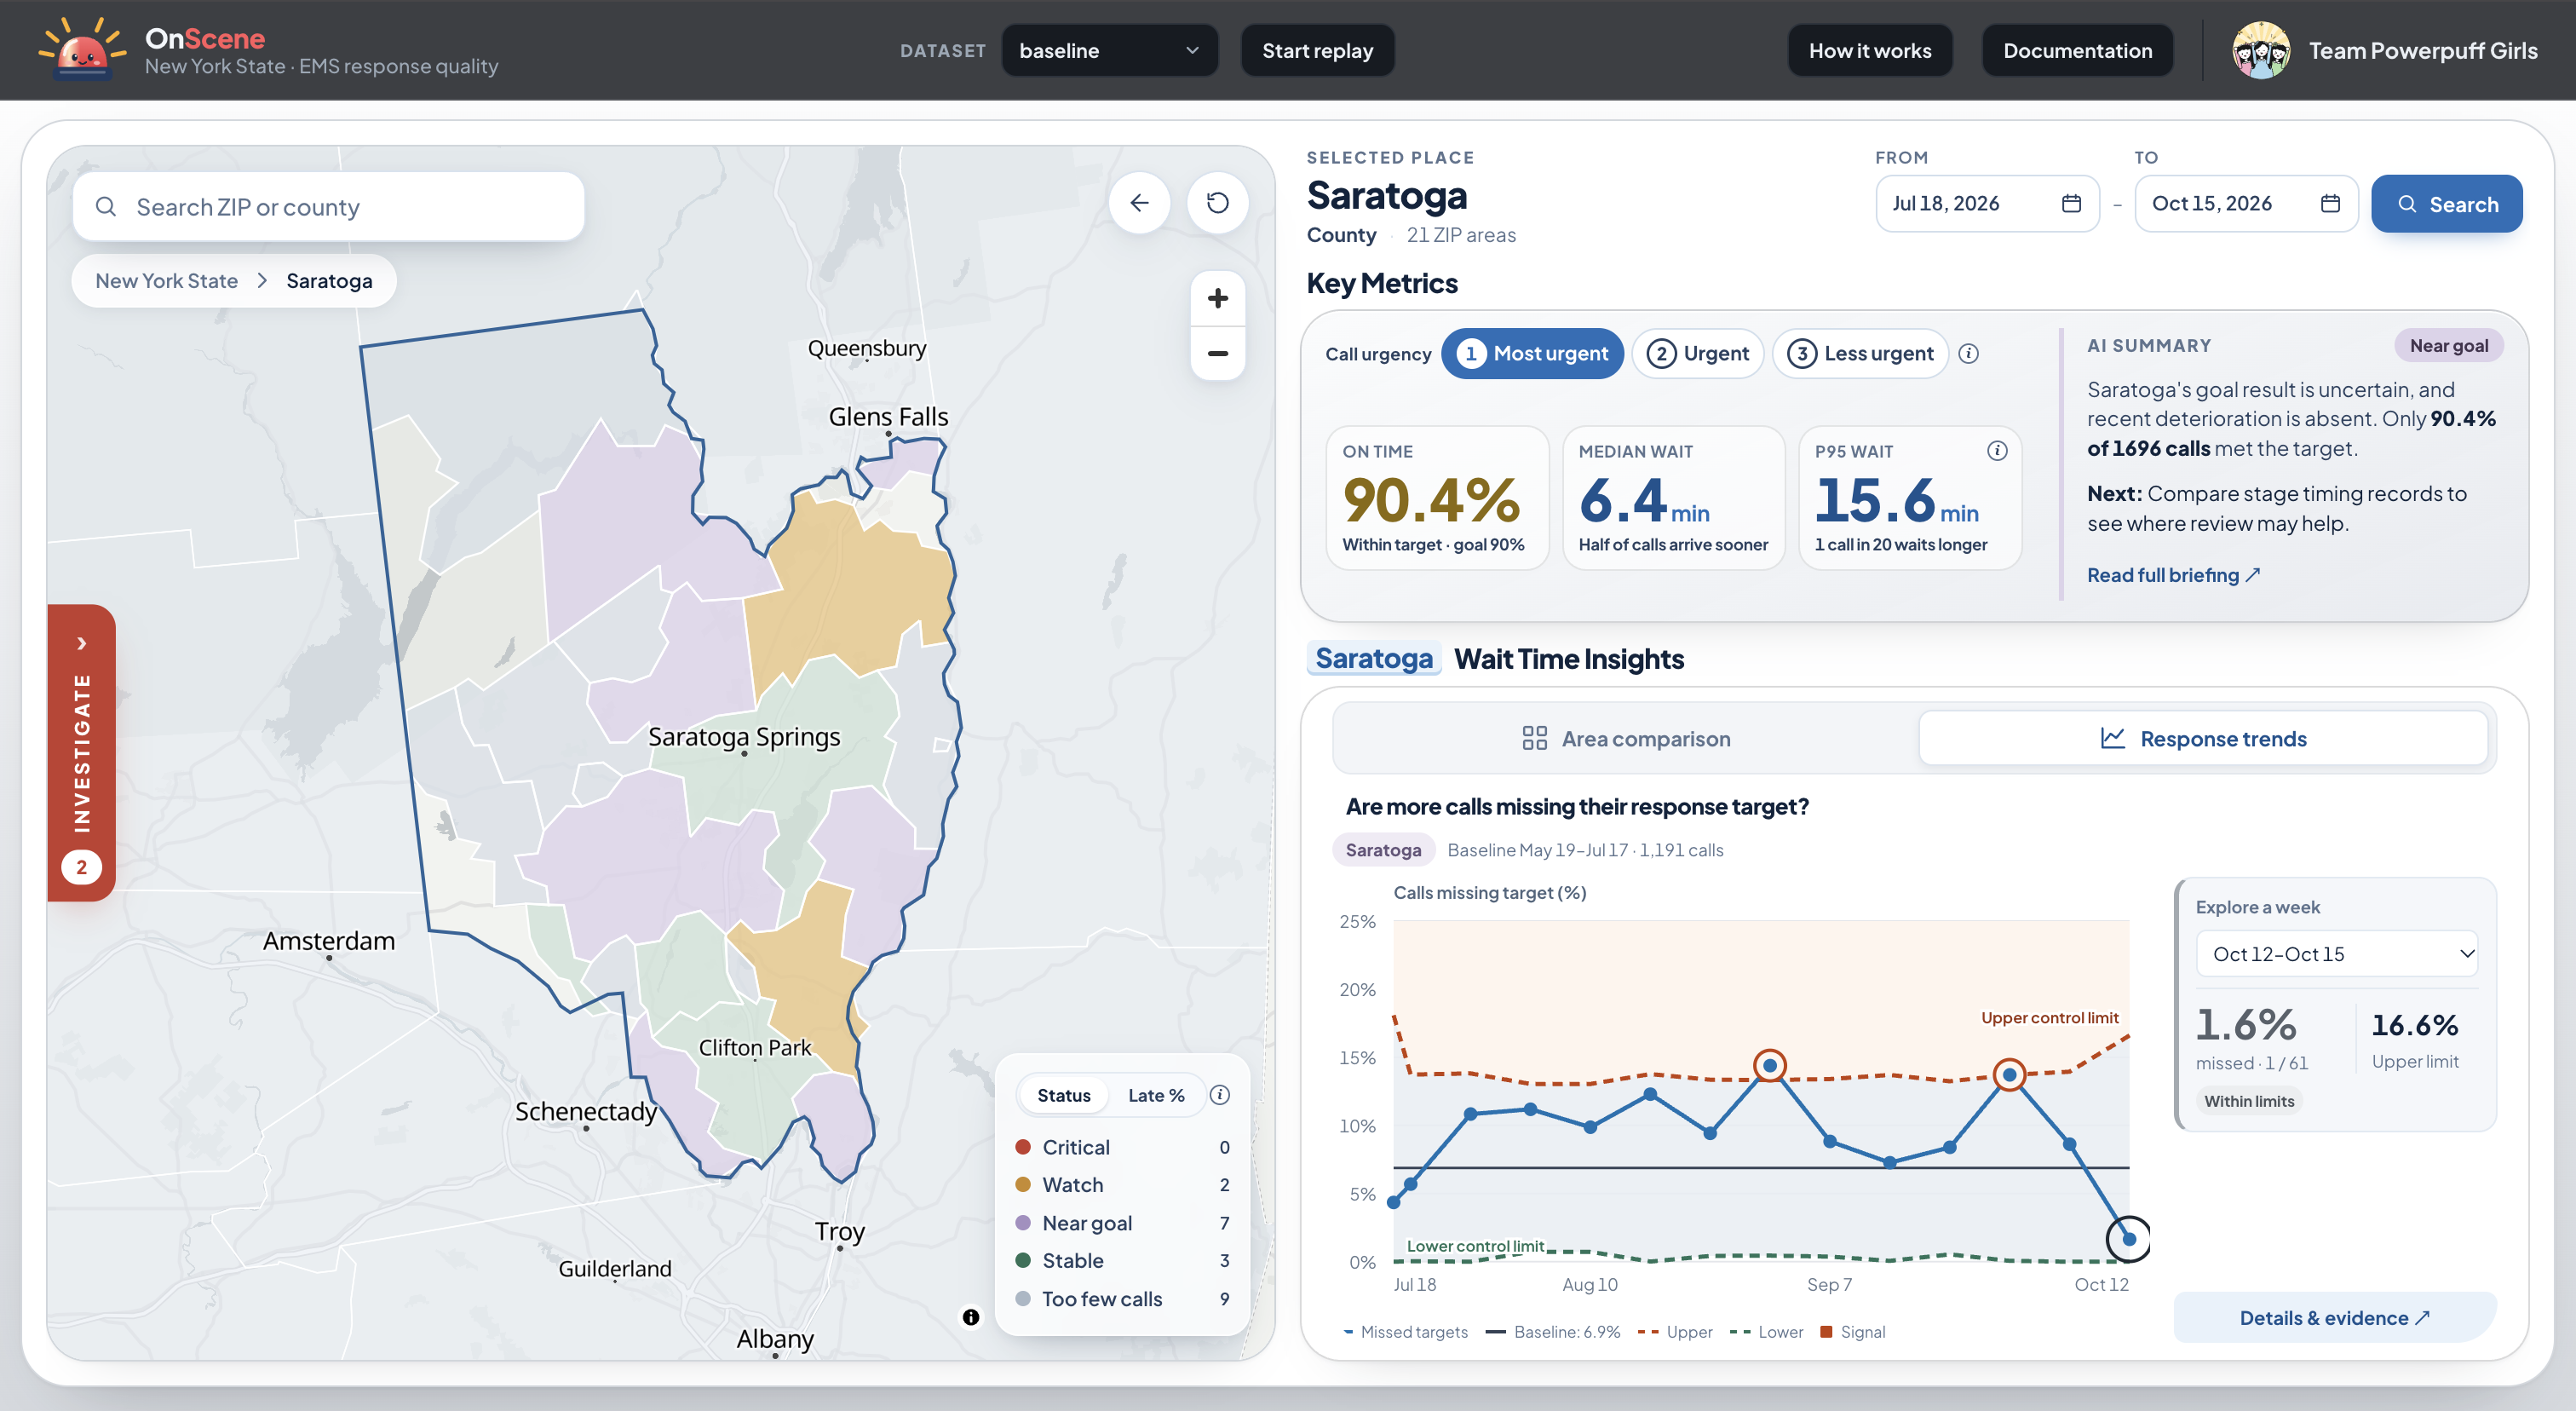
| Has performance worsened compared with this place's own history? | p chart of late-call share against a fixed 60-day baseline | Out of control / In control / Insufficient baseline |
"In control" does not mean "good," and "Below goal" does not mean "recently changed." The two judgments combine into an action queue: Act now, Ongoing gap, Recent process change, Meets goal, or Needs more data. The map colors every county and ZIP area by that status.
Supervisors can also:
- Filter by priority (mosent) and date range
- See Key Metrics: on-time %, median and 95th-percentile wait, each with a confidence interval
- Open the p chart to see exactly which periods crossed the control limit
- Compare stage times (receiv on scene) against thebaseline, as descriptive evidence rather than blame
- Run Simulation / Replayward one simulated day every 3 seconds so you can watch a problem appear
- Read an optional **AI invesummarizes the numbers alreadyon screen. It cannot create statistical judgments or assign causes.
How we built it
- Statistics: every calcu Python module (
qc.py),written and checked against known answers before any UI work - Backend: FastAPI serviner three synthetic datasets of about 1.8 million calls each
- Frontend: React + Vite,r the state → county → ZIPdrill-down
- Geography: real 2020 Ceoundaries (the incidentsthemselves are synthetic)
- Deployment: Posit Conne
- AI briefing: an Ollama Cloud model behind the backend, limited to summarizing evidence the dashboard alread
Service-goal judgment. Fo on time, we compute theWilson score interval for $\hat p = k/n$ and compare it with the goal $g = 0.90$:
$$ \text{Meets goal if } L \ge gif } U < g, \qquad\text{otherwise Inconclusive (or if } n < 30\text{)} $$ Process-control judgment.are of late calls in eachperiod against a baseline taken from the 60 days before the selected range, so the baseline never overlaps what $$ \text{UCL}_i = \min!\left(1,\; \bar p + 3\sqrt{\frac{\bar p(1-\bar p)}{n_i}}\right) $$ A point only counts as a sign*and* has an exact binomialtail probability below $0.00135$. "Out of control" requires two such signals, or one that survives a Bonferroni co. We built three synthetic daios to prove the methodworks: 1. Baseline: seasonal varh no planted change - Station closure: longer travel times in ZIP 11368 (Corona, Queens) from September 1
- Summer surge: higher volume and dispatch delay in Monroe County in July and August
Challenges we ran into
- Keeping "below goal" and "out of control" separate. Our first design merged them into one status. We spliause a place can beconsistently slow (in control and below goal), and that's exactly what a single flag would hide.
- False alarms. With hundreds of places and many periods, something will cross a 3-sigma line by chance. We ada two-signal confirmation rule and a Bonferroni option, then measured false alarms on the no-change dataset instead of assuming there wer
- Sparse ZIP areas. Many rural ZIP areas have too few calls for a confident judgment. Instead of calling Inconclusive or*Insufficient baseline* and show the sample size.
- Unstable baselines. A bown spike produces misleadinglimits. We screen baseline periods for extreme values, runs and overdispersion before trusting them.
- Scale and speed. About 1.8 million calls per dataset had to load fast enough for a live demo. We cut per-dout 26 s to about 10 s.
- Honest wording. We removed every phrase that implied a cause, like "this dispatcher caused the delay."to look*, not who to blame.
Accomplishments that we're
- The planted problems are caught: ZIP 11368 and Monroe County both reach "Act now" in their scenario dataset flagged 0 of 62counties as changed in our original check.
- Every statistic is checked edge cases. For example, 85on-time calls out of 100 gives a Wilson interval of about $[0.767,\,0.907]$, and zero calls never produces a confid
- More than 200 backend tests and more than 100 frontend tests.
- A dashboard that admits uncvals, sample sizes and"Inconclusive" labels everywhere.
- It's deployed and runs frommmand.
What we learned
- Statistical control and meeting the goal are different questions. A process can be perfectly stable and still
- Saying "we don't know yet" is a feature. Labeling sparse areas "Inconclusive" is more useful than a confide
- Test the method before the UI. Planting known problems in synthetic data was the only way to prove the cha ignore noise.
- AI agents need firm direction. We wrote the statistical rules first and used AI coding tools to implement theee.
What's next for OnScene
- Connect to a real (anonymized) CAD extract and confirm its timestamp definitions
- Replace the illustrative reocally approved ones
- Seasonal adjustment for the p chart, and time-of-day analysis
- Alerts when a place moves i
- Tests on real-world data to measure false-alarm rates beyond our synthetic generator
Built With
- ai
- positconnect
- python

Log in or sign up for Devpost to join the conversation.