-
-
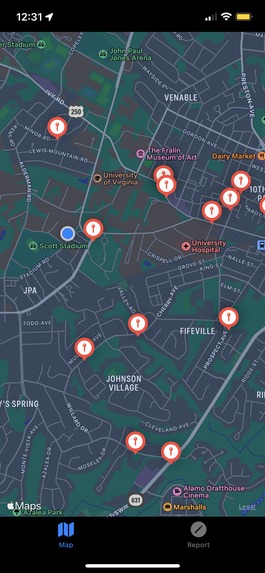
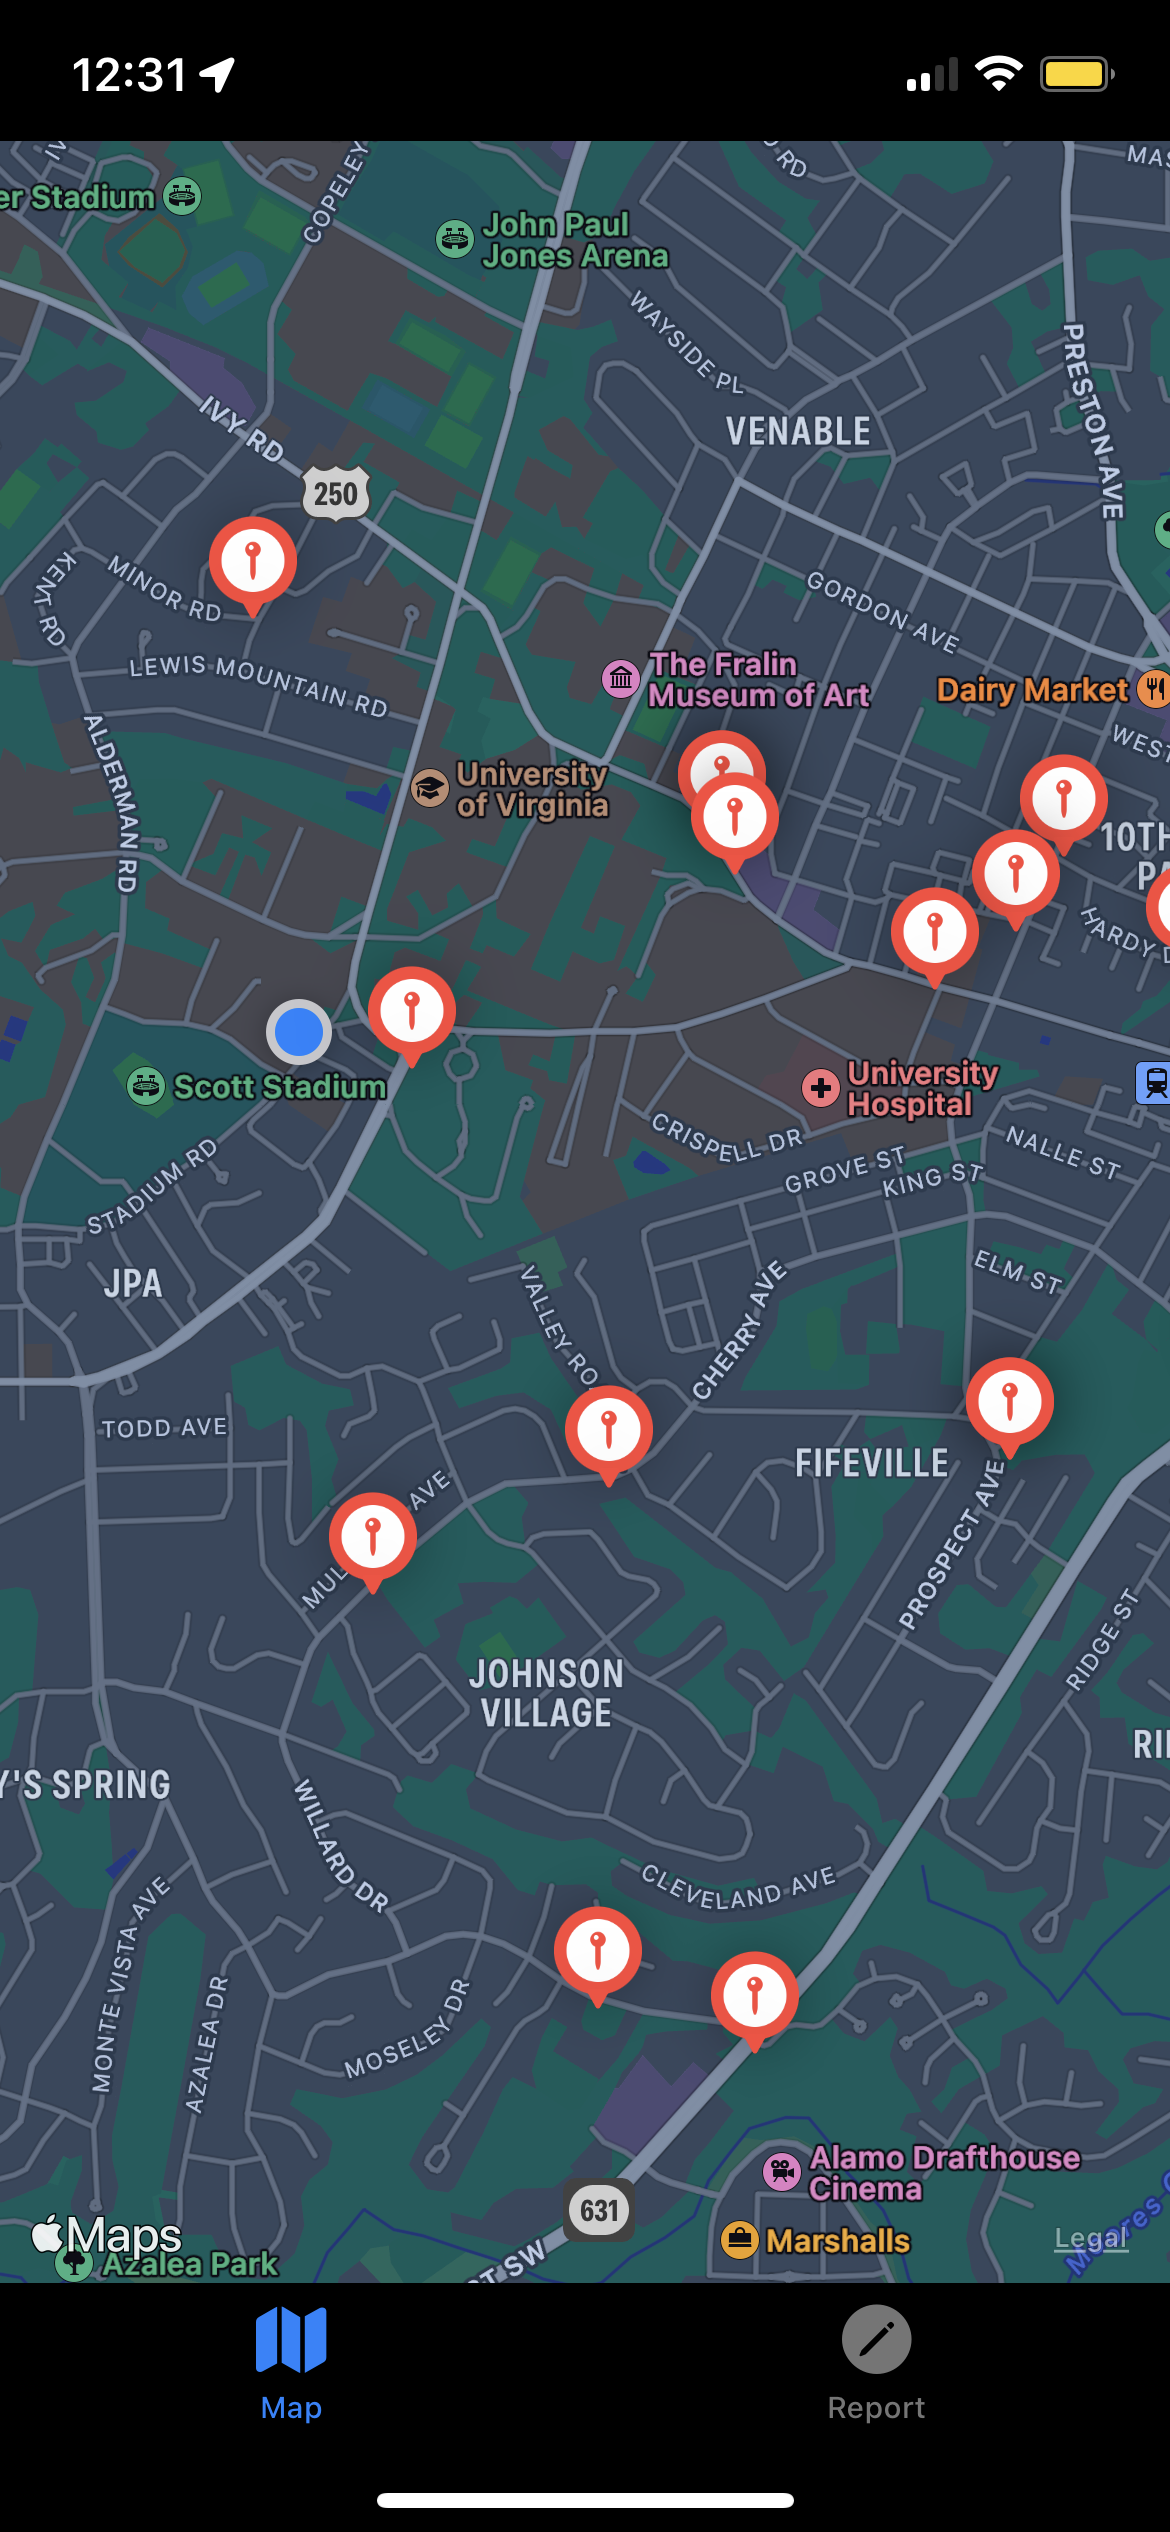
Crime incidents in a small area
-

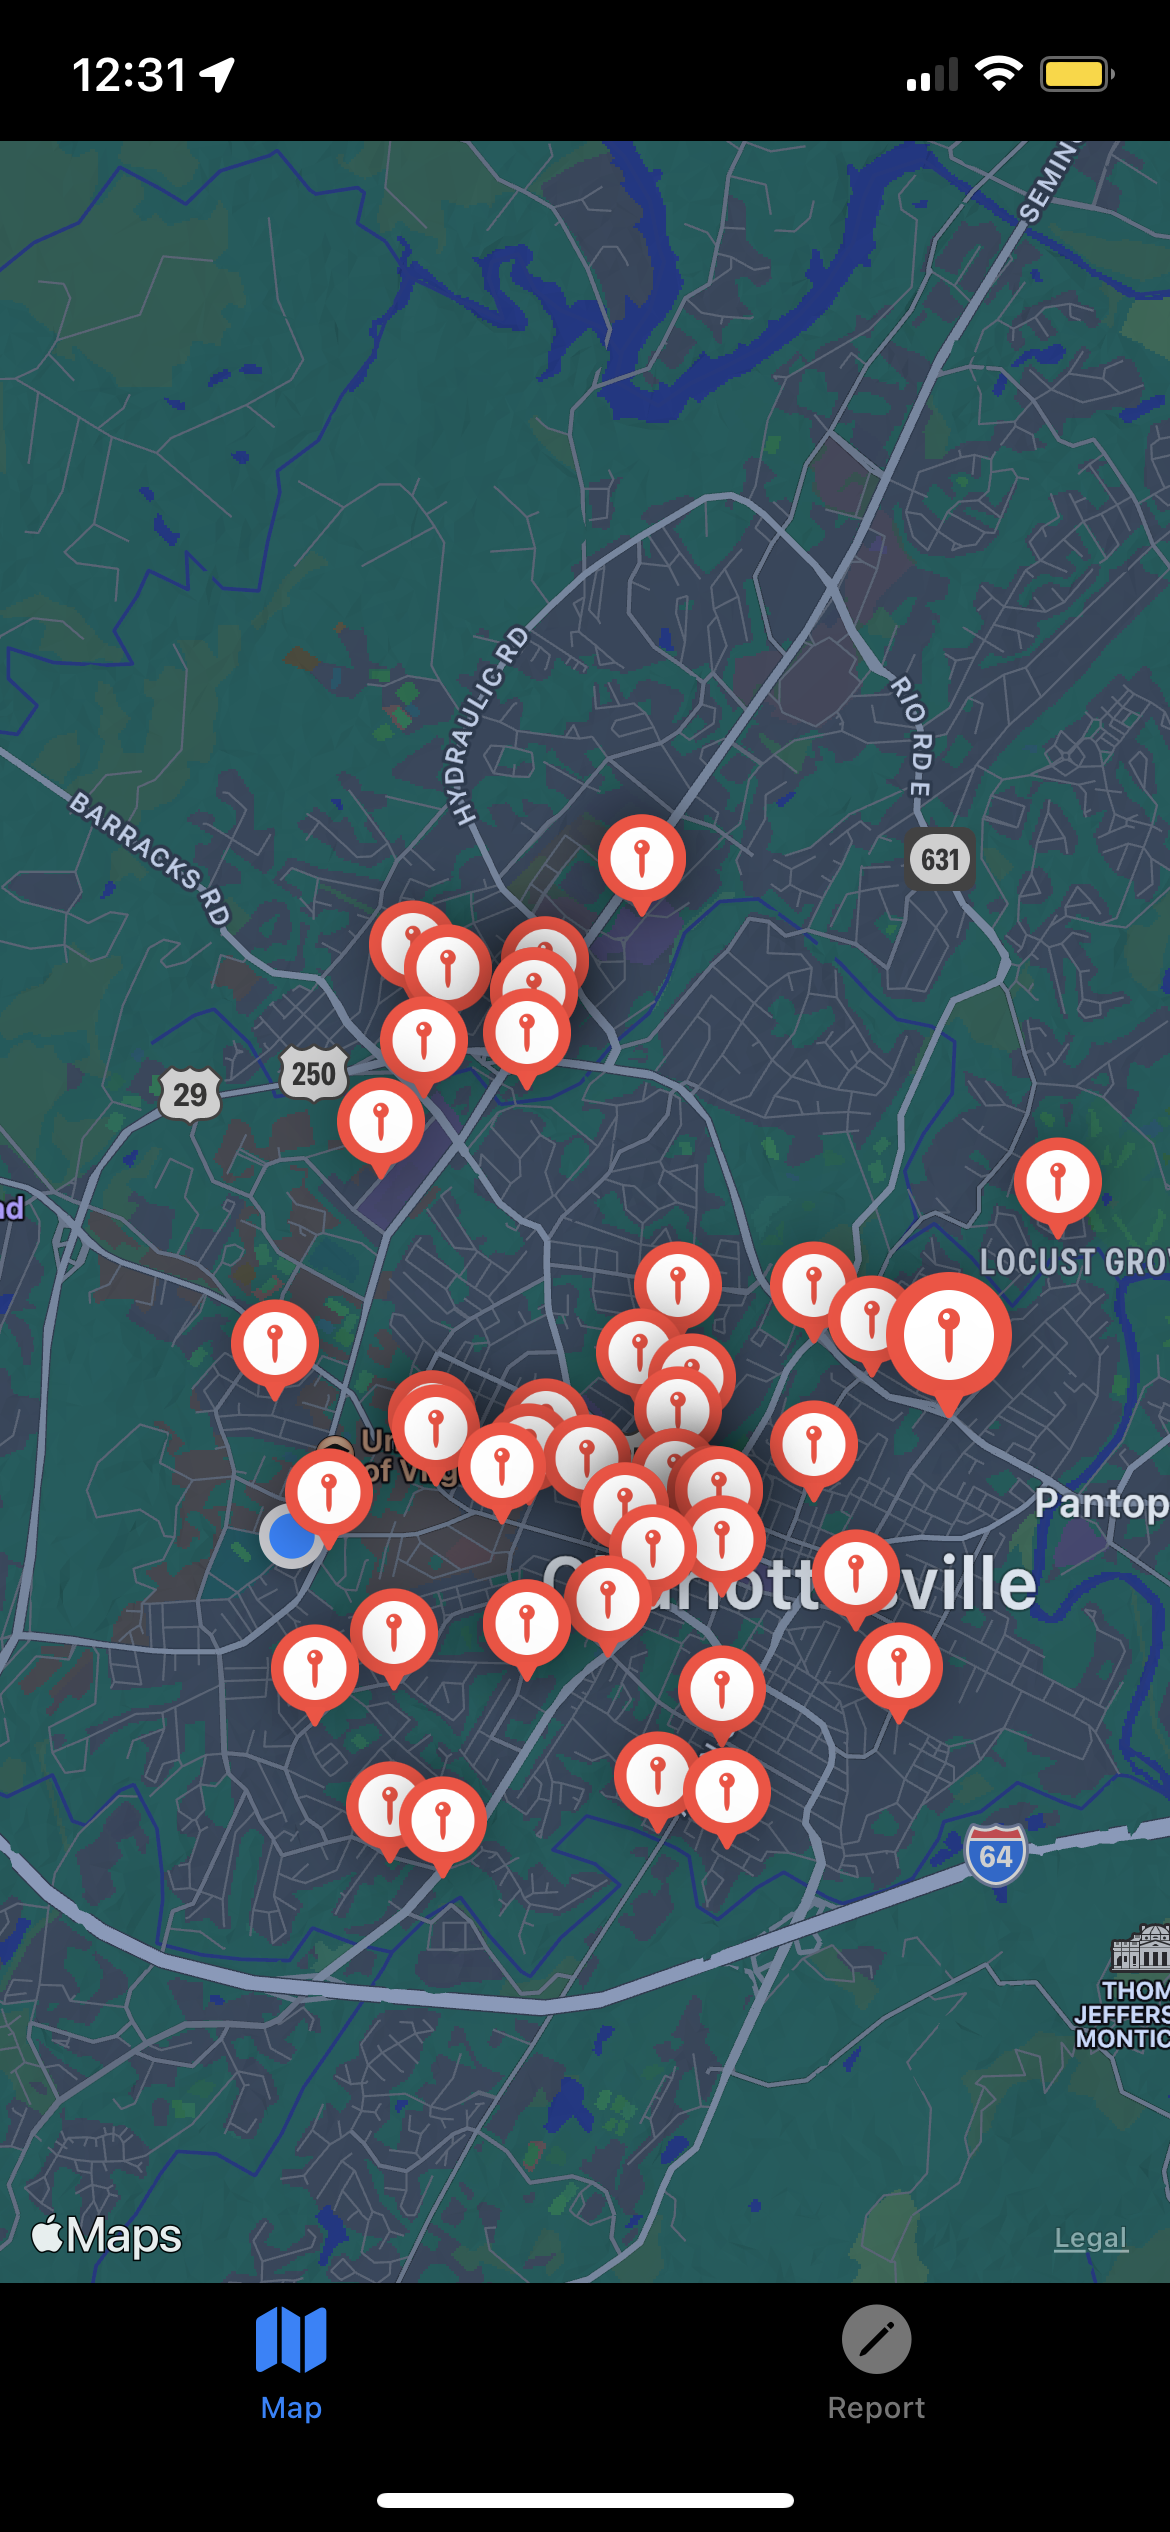
Zoomed out crime concentrations
-
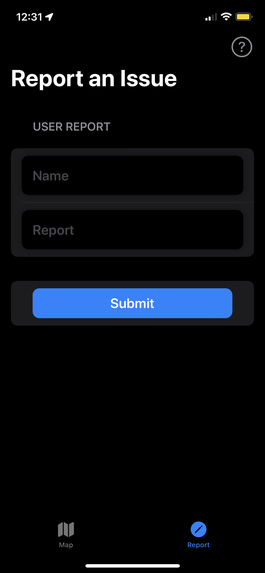
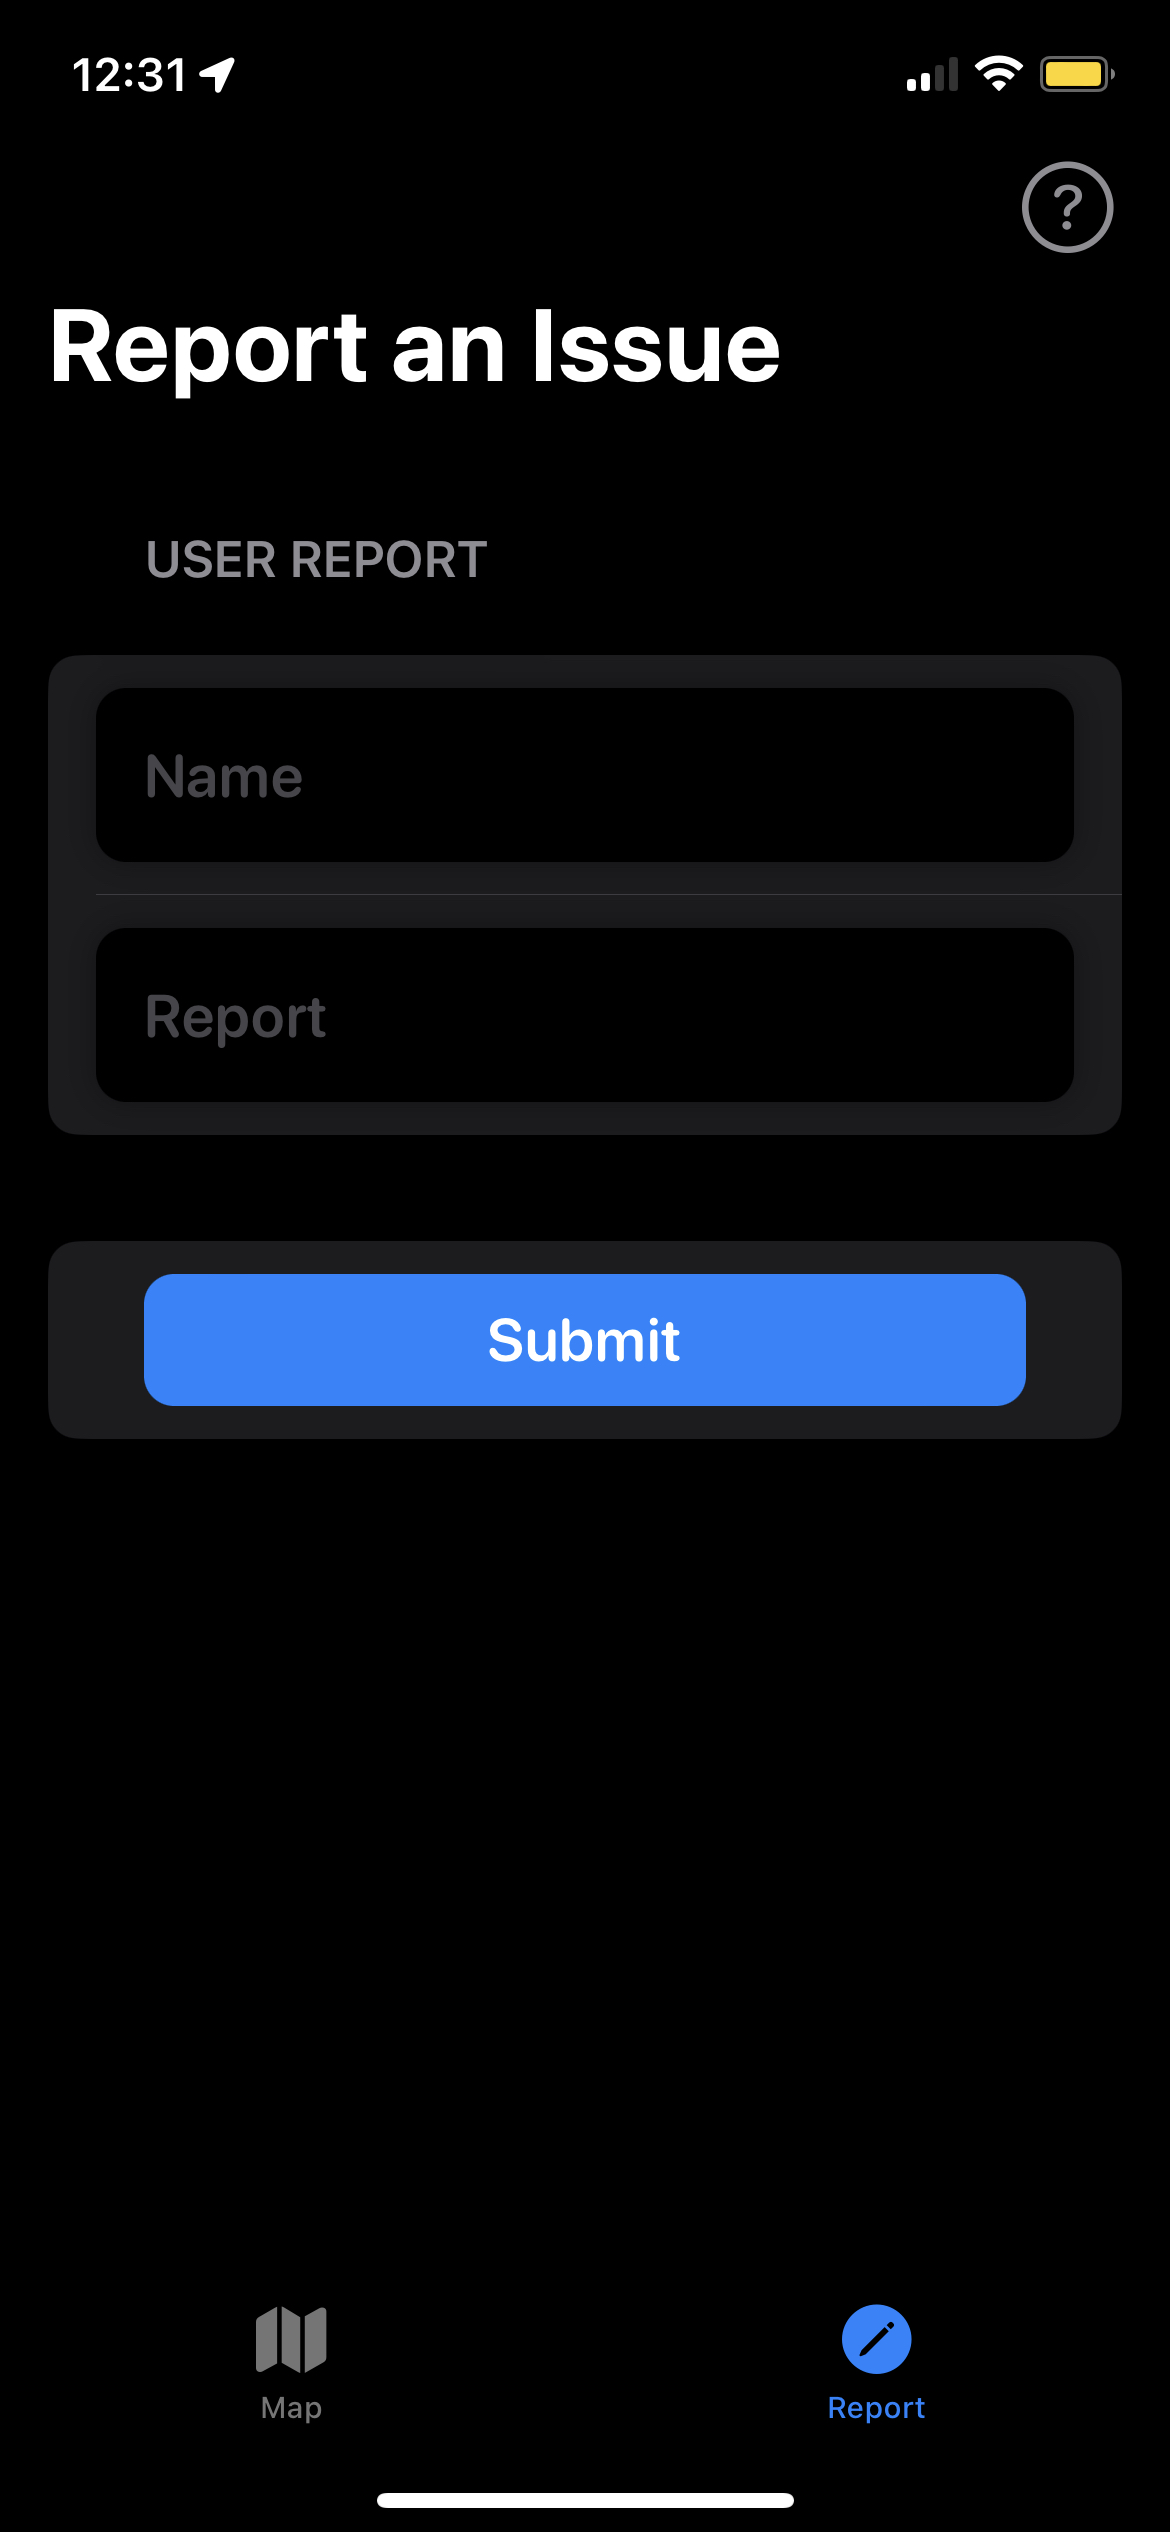
Incident Report Form
Inspiration
The team members like to hang out together, but have never felt safe walking at night and have not felt reassured by sporadic and vague community alerts. We imagined the idea of a reassuring phone app you could use to stay situationally aware at all times.
What it does
onGuard sources crime data files from the local police force (in development we have chosen Charlottesville). It then cleans the data, selecting incidents of larger concern (more violent, publically-dangerous crimes from this calendar year). These incidents are then clustered together and analyzed under three categories: frequency of a certain crime type, concentration in a certain area, and crime severity. Each cluster then has a circular area drawn around it, alerting users who enter the area of possible danger.
How we built it
The backend of onGuard was built via Python, Pymango, Sklearn, and Geopy. The input police data is processed and filtered with Python, then uploaded to a server database with Pymango. The police data comes with street addresses, which are converted to GPS coordinates with Geopy and grouped with Sklearn’s k-clustering. This data is sent to the frontend app, which was built using the Swift language on X-code. The app interacts with additional python programs to retrieve information such as crime locations, and cluster crime severity.
Challenges we ran into
One of the first challenges we ran into was clustering the data. We didn’t want large clusters spread throughout the map, making everywhere a potential danger area. As a result, we decided to use K-clustering and limit how many clusters are created, allowing for a larger number of clusters with more specific grouping. Another challenge was filtering the data to remove unwanted entries while moving the data between databases. This would often lead to formatting or uploading issues, which were eventually solved with patience and gradual problem solving.
Accomplishments that we're proud of
We are most proud of our intuitive and creative algorithms which very accurately depict realistic conditions in Charlottesville (centralized data points downtown, in residential areas) and represent our frequency, concentration, and severity variables. Our front end is built in Swift for which we have no prior experience, yet we managed to create a polished UI, and our data warehouse produces extremely curated tables which could be reused in other applications.
What we learned
We learned that it can be essential in fast sprint hackathons for each team member to have a deep familiarity with every layer. Divide and conquer is a worthy strategy, although communication is a lot better when group members know what needs to be integrated or tweaked to work for the next layer up. We also learned that being ambitious can pay off but also hamper progress, and there is no need to be extremely cutting-edge.
What's next for onGuard
We wish to expand functionality to other cities, and create comprehensive filters to view crime information (filter by type, violent crime, nighttime crime), and we would love to work directly with law enforcement to instantly update the database and provide more situational details to our users.
MongoDB
How we used MongoDB: MongoDB was used to build a no-sql organization data warehouse for our project. We performed an Extract, Transform, and Load on a comma-separated-value file sourced from Charlottesville PD Crime Data resources using numerous Python libraries, including Pandas (for data manipulation) and Pymongo to integrate MongoDB. The original CSV file is converted to a readable table and uploaded to an Atlas server we created. We then separate it into condensed topical dimensional tables, including tables for location, incident type, and time, which we then perform transformations on and further separate into more condensed information columns for easy querying. The location dimensional table is formed from the merging of data from Cville PD with .txt/.csv files we generated by repetitively running coordinate generation and cluster matching algorithms on our address data. Finally, we create a star schema with fact_crime as a centralized table for easy reading.

Log in or sign up for Devpost to join the conversation.