
Inspiration
We were inspired by the challenge cities face in modernizing their aging energy grids. With buildings accounting for nearly 40% of global energy consumption, cities are investing billions in infrastructure upgrades and renewable energy projects, yet they are doing so without a detailed understanding of where and how energy is actually used. We wanted to tackle this data gap to help cities build more sustainable, resilient, and equitable energy systems.
What it does
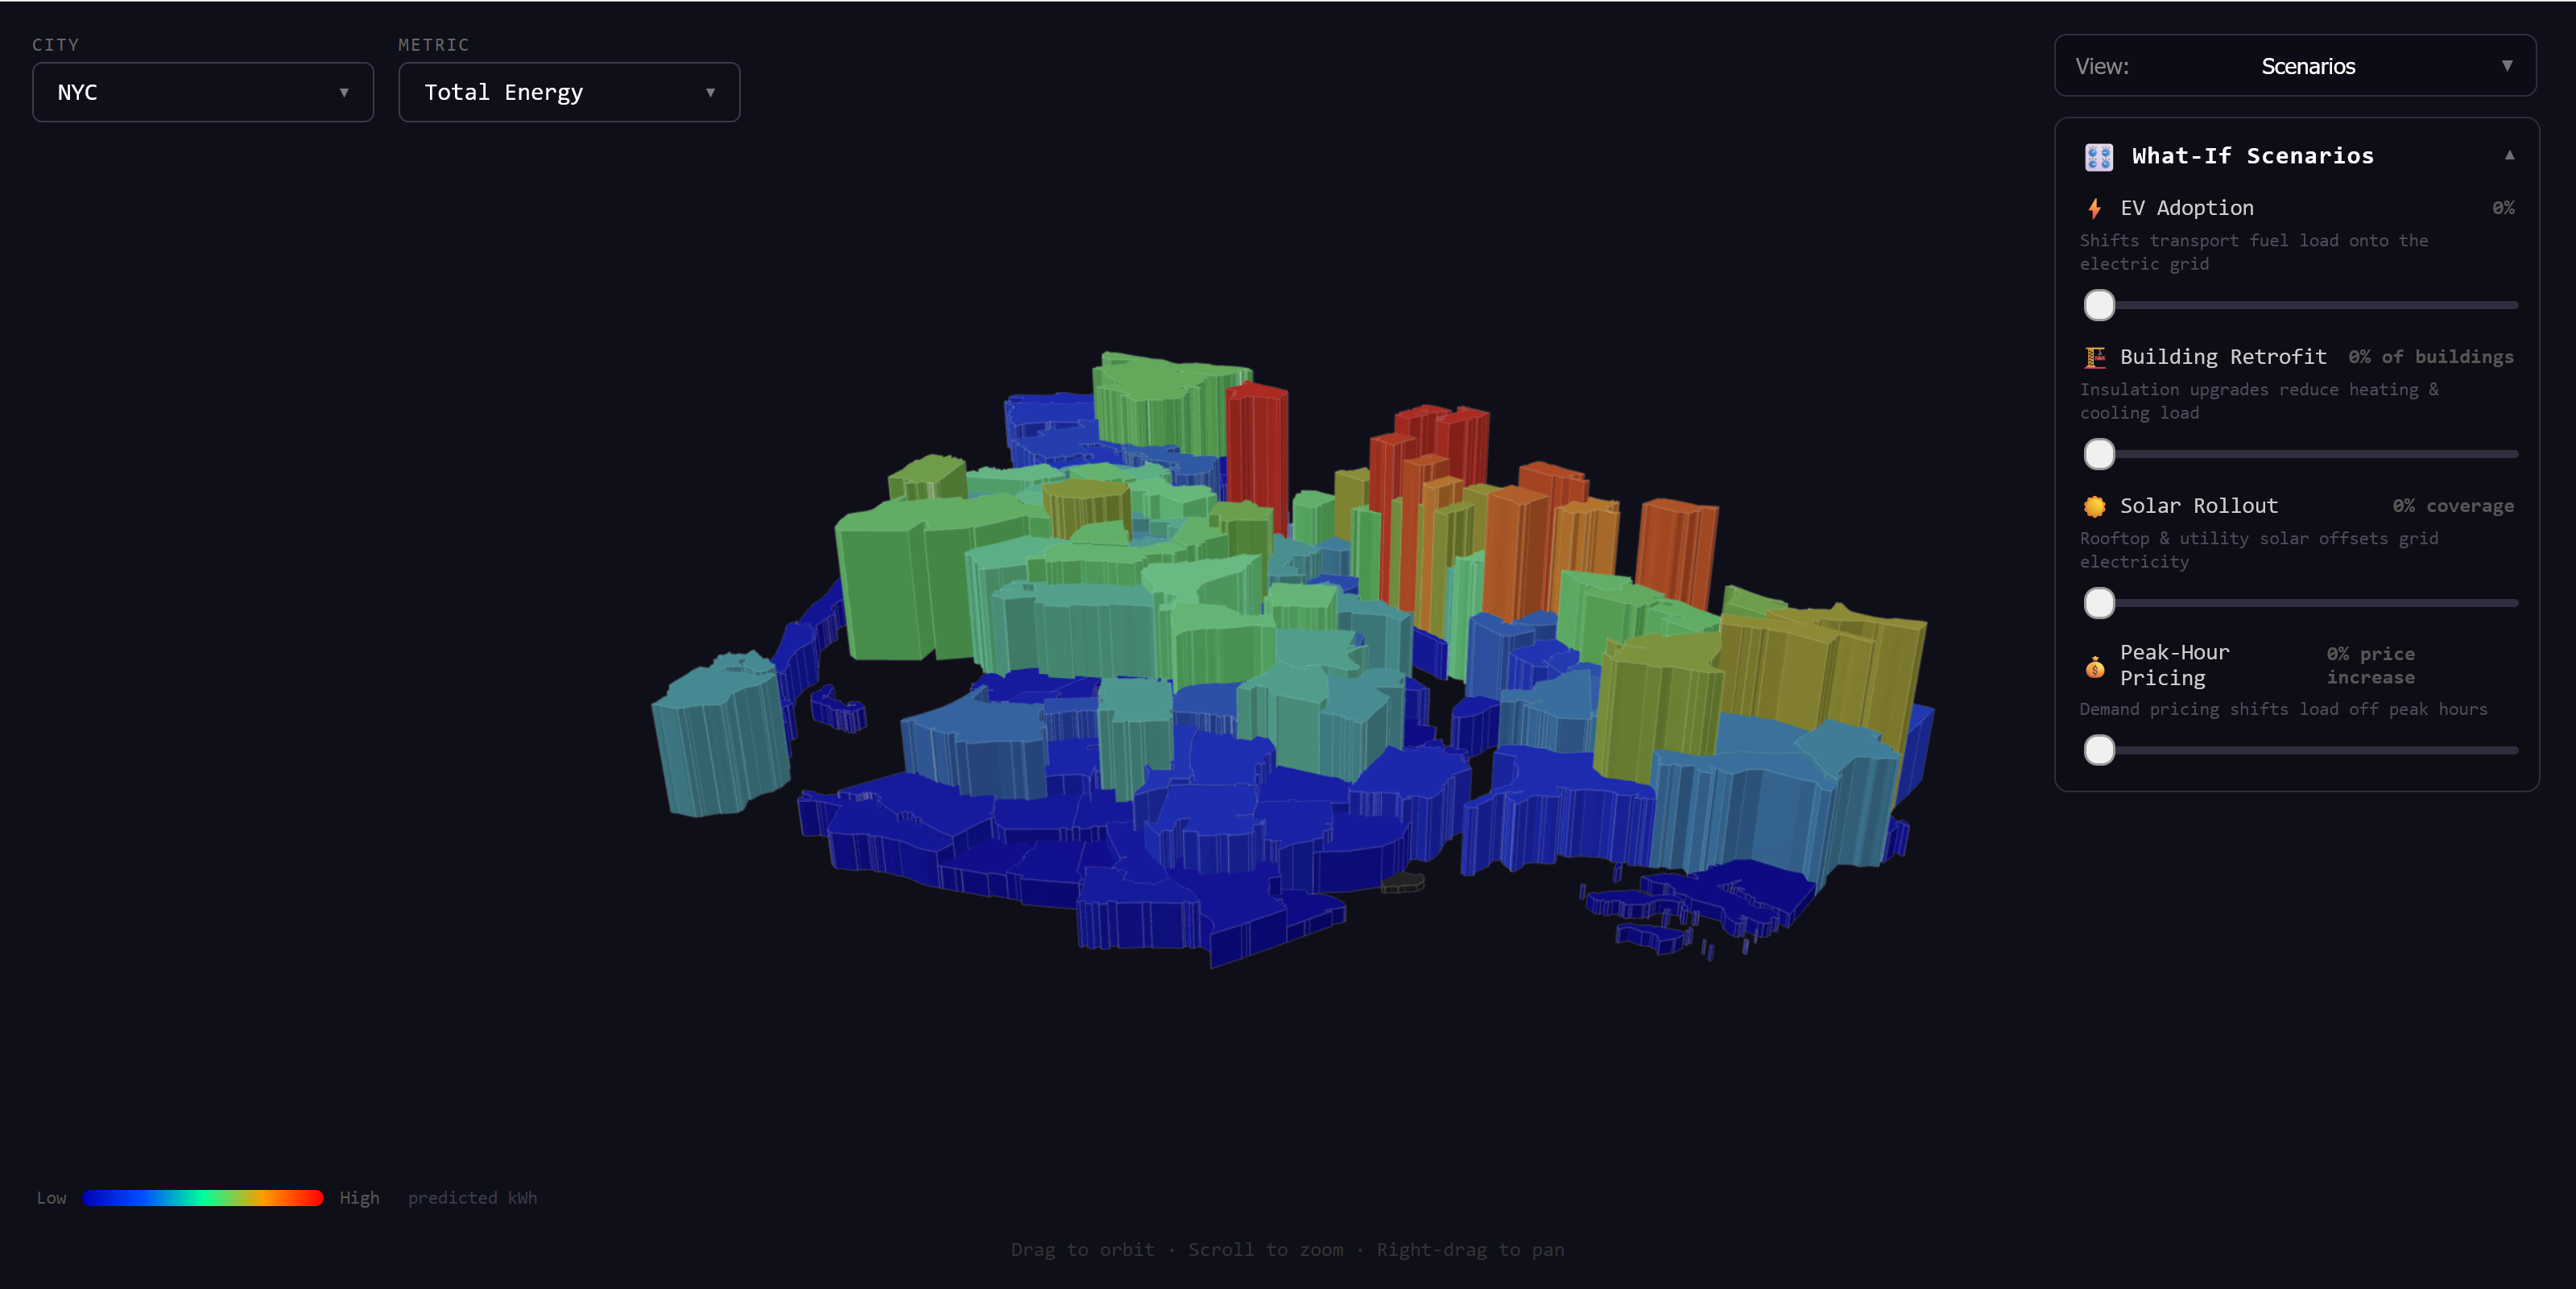
One World is a data-driven platform that maps and predicts building energy consumption across a city, down to the ZIP code and building type. By applying a robust regression model to public city data, it estimates electricity and fuel usage, then breaks it down into four key end-uses: space heating, space cooling, water heating, and base electric loads. The platform features an interactive map for urban planners, utilities, and policymakers to explore energy hotspots, identify intervention opportunities, and make informed, data-driven decisions.
How we built it
We built One World by leveraging AI and Web tools to create a comprehensive simulation and interface for it. The backend analysis engine uses a Python stack, including pandas, geopandas, and scikit-learn, to run a Huber robust linear regression model on real-world datasets from four major US cities. We paired this with a user-friendly frontend built in React and TypeScript, using mapping libraries to visualize the complex spatial data in an intuitive way.
Challenges we ran into
One major challenge was sourcing and harmonizing messy, inconsistent real-world data from different municipalities. Each city had unique data formats, building classifications, and levels of quality—for example, some cities provided separate electricity and fuel data, while others only offered a combined metric. Ensuring our model was robust enough to handle these variations while still producing valuable insights was a significant hurdle.
Accomplishments that we're proud of
We’re proud of successfully replicating and validating a sophisticated academic model with real-world data across four major US cities: Chicago, NYC, Los Angeles, and Seattle. We achieved an exceptional R² accuracy of 0.988 for Chicago's electricity model, proving the methodology's effectiveness. Most importantly, we translated this complex analysis into a functional, interactive tool that makes abstract data tangible and actionable for city planners.
What we learned
We learned that data quality is paramount; the high-quality, separated energy data from Chicago yielded far more accurate results than the combined data from Los Angeles. This underscored a crucial lesson: the first step to a "smart city" is better data collection. We also learned that even a model with moderate accuracy can provide immense strategic value by highlighting high-intensity buildings and neighborhoods, proving you don't need perfect data to make smarter decisions.
What's next
Next, we plan to enhance the model by incorporating more variables like building age and weather data. We aim to develop an AI-powered recommendations engine to suggest specific interventions (like CHP or solar installations) based on a neighborhood's energy profile and partner with city governments and utilities to integrate real-time data feeds for dynamic, operational energy planning.

Log in or sign up for Devpost to join the conversation.