-
-
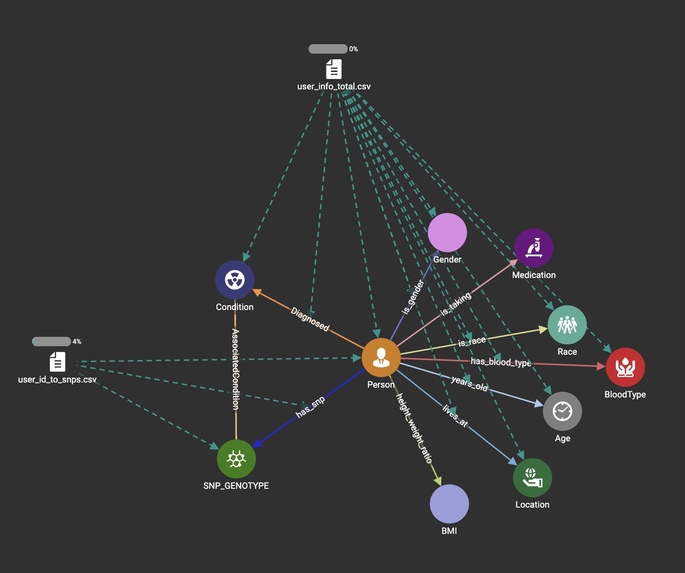
Database Schema

The Problem
Have you ever disassembled furniture and reassembled it without the instructions. Sounds crazy right? What if I told you that our human genome sequence is the instruction manual for a human being and the only difference between you and me is just one tiny piece. A little over a decade ago the use of genetic tests was a novelty in medicine that helped researchers identify strong risk factors that caused anything from metabolic to oncological diseases. As genome sequencing technology has become easily accessible to the common man the question that lies upon us is how we use that information. Are we capable of understanding the complexity of our genome, or are we overestimating the accessibility of our times? Recent studies have demonstrated that around 62% of practicing primary care physicians have no formal training associated with the use and application of genetic testing. (1) In an era of an overflow of information our task is to not only provide the best resources to obtain that information but also what to do with it.
The Challenge
Current genetic home testing companies facilitate access to certain genetic data and a simple orientation towards how important that information is. By introducing the visual and quantitative power of graph models we can help any user understand how that piece fits. Physicians are trained in the big picture and the future of medicine is based on facilitating new learning models that are user-friendly. The COVID-19 pandemic showed the multiple flaws in our systematic adaptation to challenges. In this age of technology and information learning and connecting the dots should be easier and more open to future possibilities. Within our genetic data, a specific set of differences (polymorphisms) exists creating a mosaic of individual diversity; these are commonly referred to as single-nucleotide polymorphisms (SNPs). Our challenge is to facilitate current evidence-based SNPs and their risk associated with some of the most deadly cancers. Visual network interpretation facilitates the correlation of clinical characteristics and genetic data to orient clinical decision-making without risking interpretation bias.
How we built it
Our graph is built using Tiger Graph and Tiger Graph ML Workbench
Challenges we ran into
We joined this project pretty late after the start of the hackathon. We completed as much as possible in about 48hrs. Time was a major challenge but we are excited to see how this project can evolve even after the deadline.
Accomplishments that we're proud of
We are proud of creating such an expansive graph in such a short amount of time. Our data represents over 50016k SNPs.
What we learned
We learned how to use Tiger Graph and the Tiger Graph query language.
What's next for Oncogenetic Graph
We are going to create a web application that allows for interacting with the graph. Users will also be able to upload their own SNP data to see how they compare.
Sources
Haga SB, Kim E, Myers RA, Ginsburg GS. Primary Care Physicians' Knowledge, Attitudes, and Experience with Personal Genetic Testing. J Pers Med. 2019 May 24;9(2):29. doi: 10.3390/jpm9020029. PMID: 31137623; PMCID: PMC6617198.
Further information: https://www.genome.gov/human-genome-project/Completion-FAQ


Log in or sign up for Devpost to join the conversation.