Catastrophes (U.S. Edition)
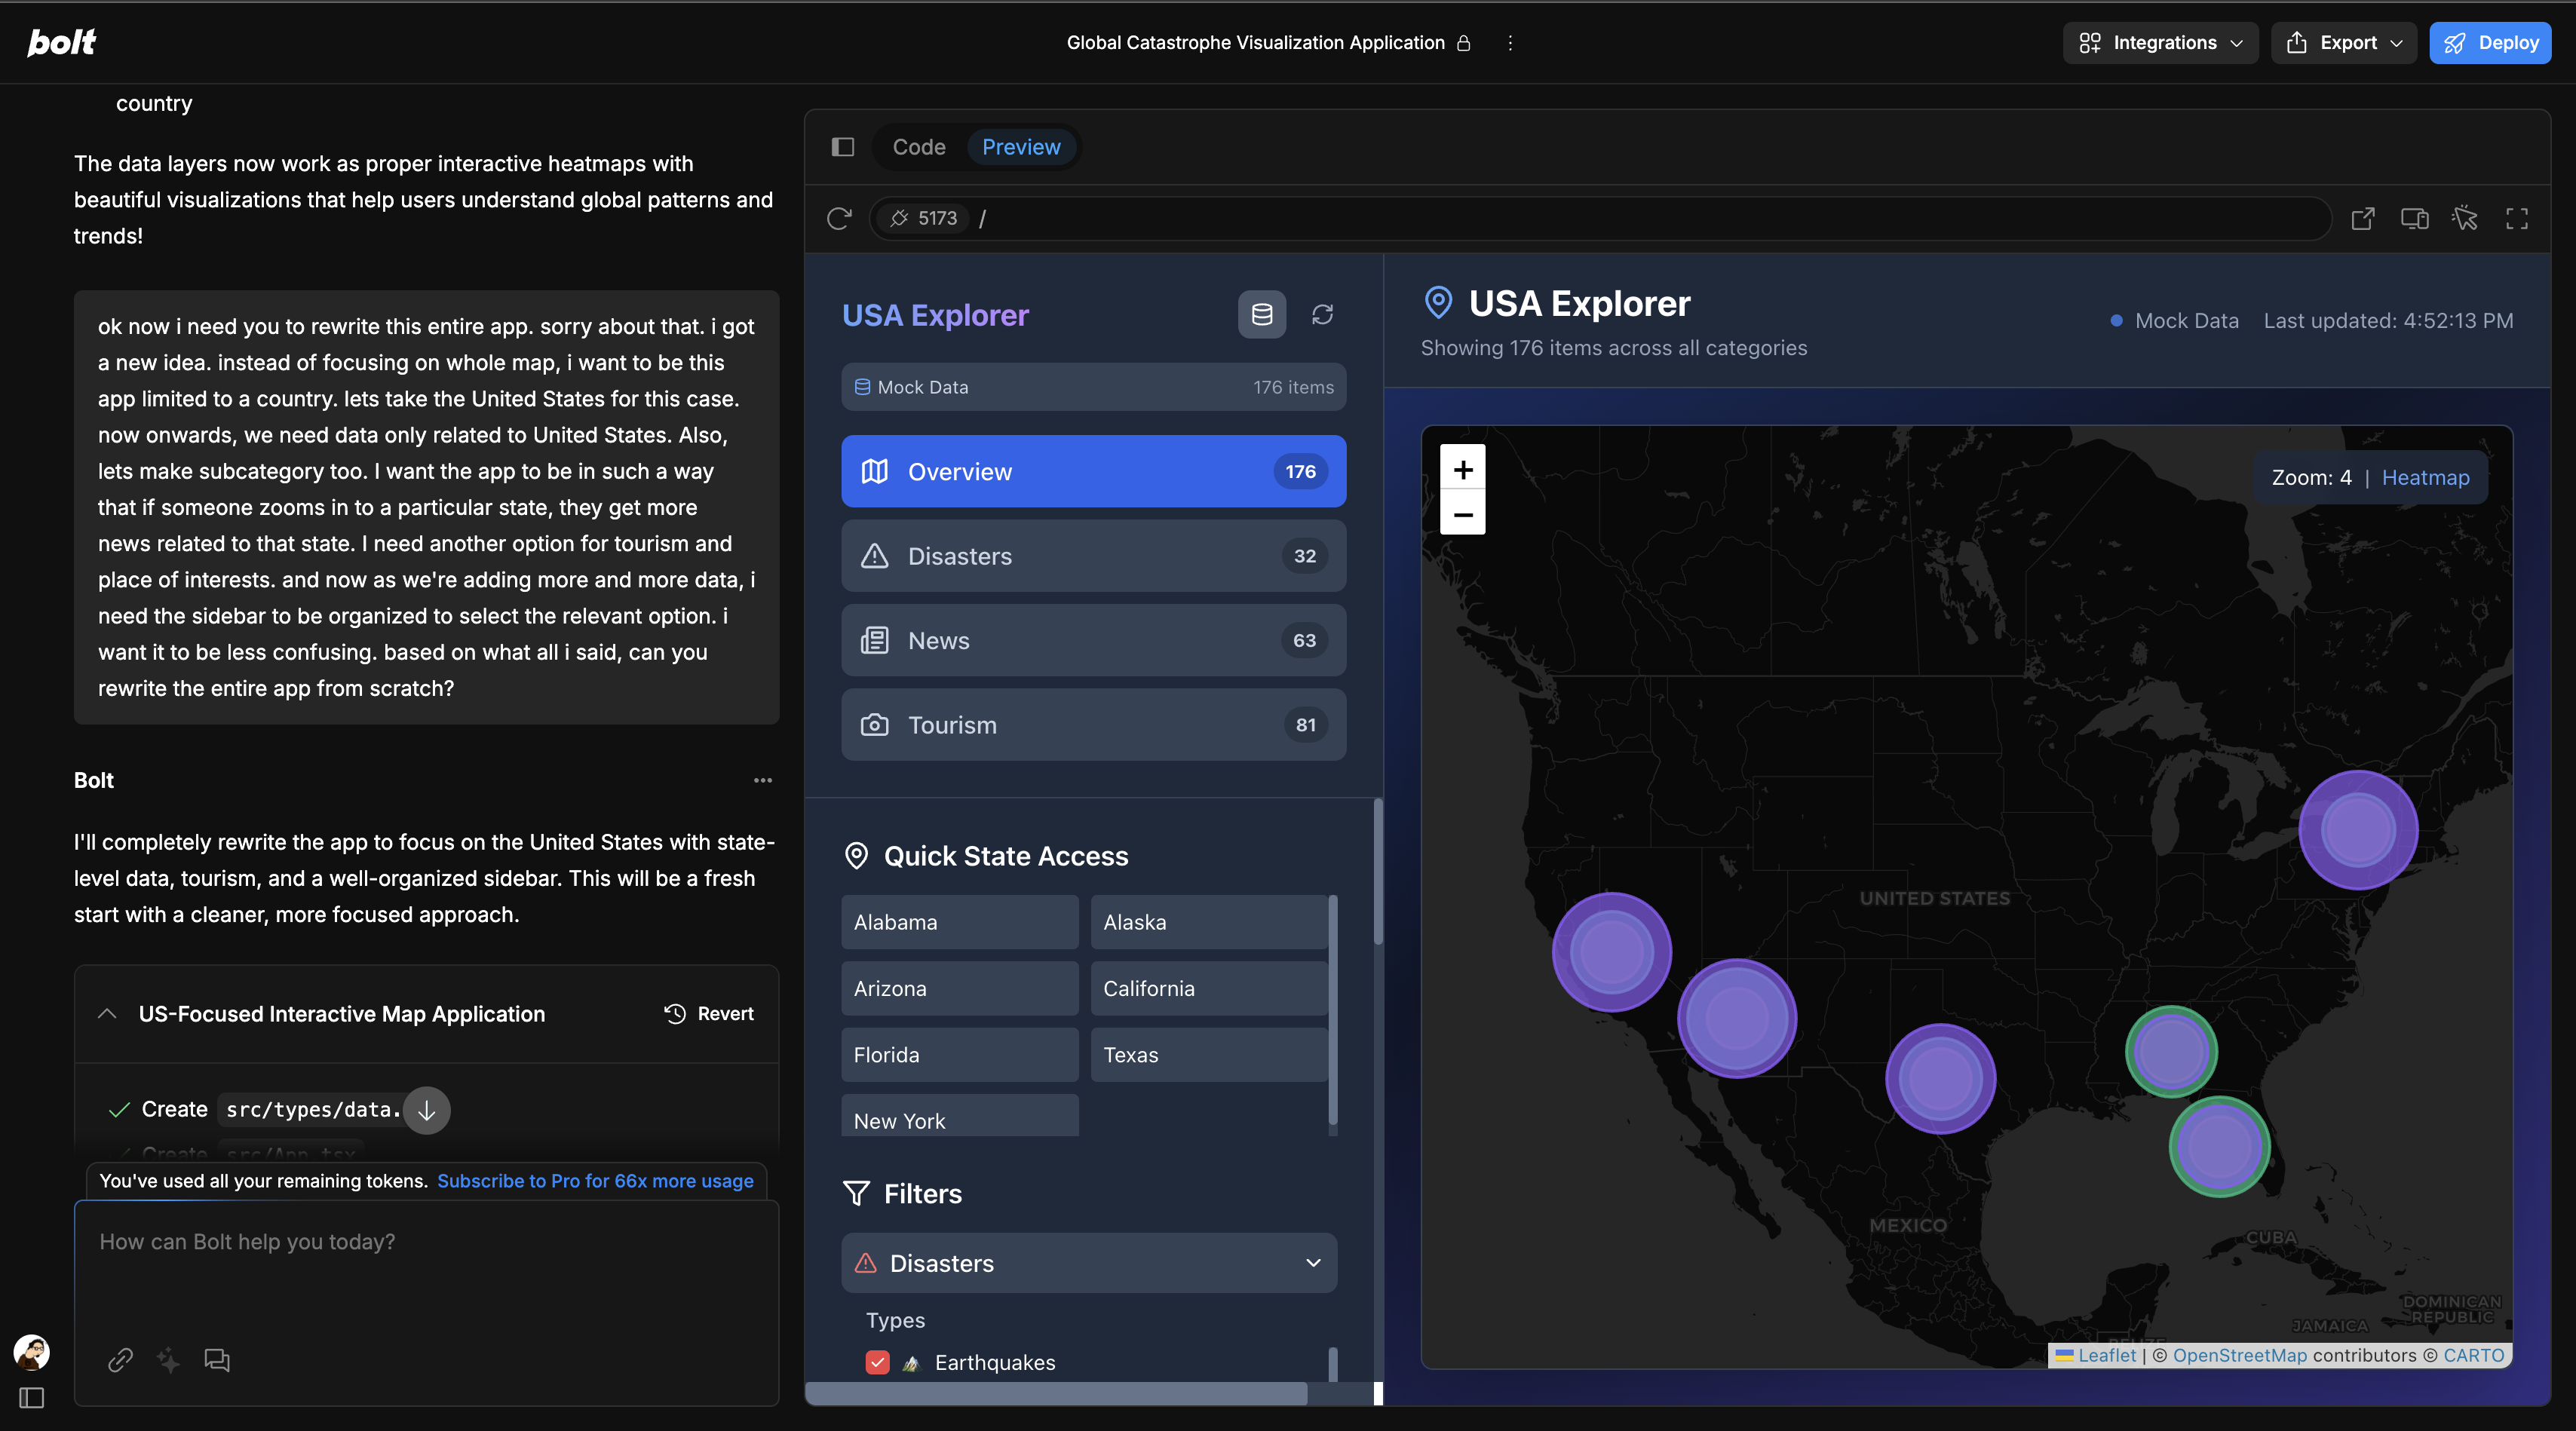
A React-based news-mapping web app that visualizes top trending events and points of interest across the United States, with state-level detail and an organized, multi-category sidebar.
🏁 Getting Started
- Live Demo: https://catastrophes.netlify.app
- Tech Stack
- Frontend: React + Leaflet (map), Redux or Context for state
- Data Fetching: Axios / Fetch from custom News+Tourism APIs
- Styling: Tailwind CSS or plain CSS modules
- Build & Deploy: Vite (or Create React App) + Netlify
- Frontend: React + Leaflet (map), Redux or Context for state
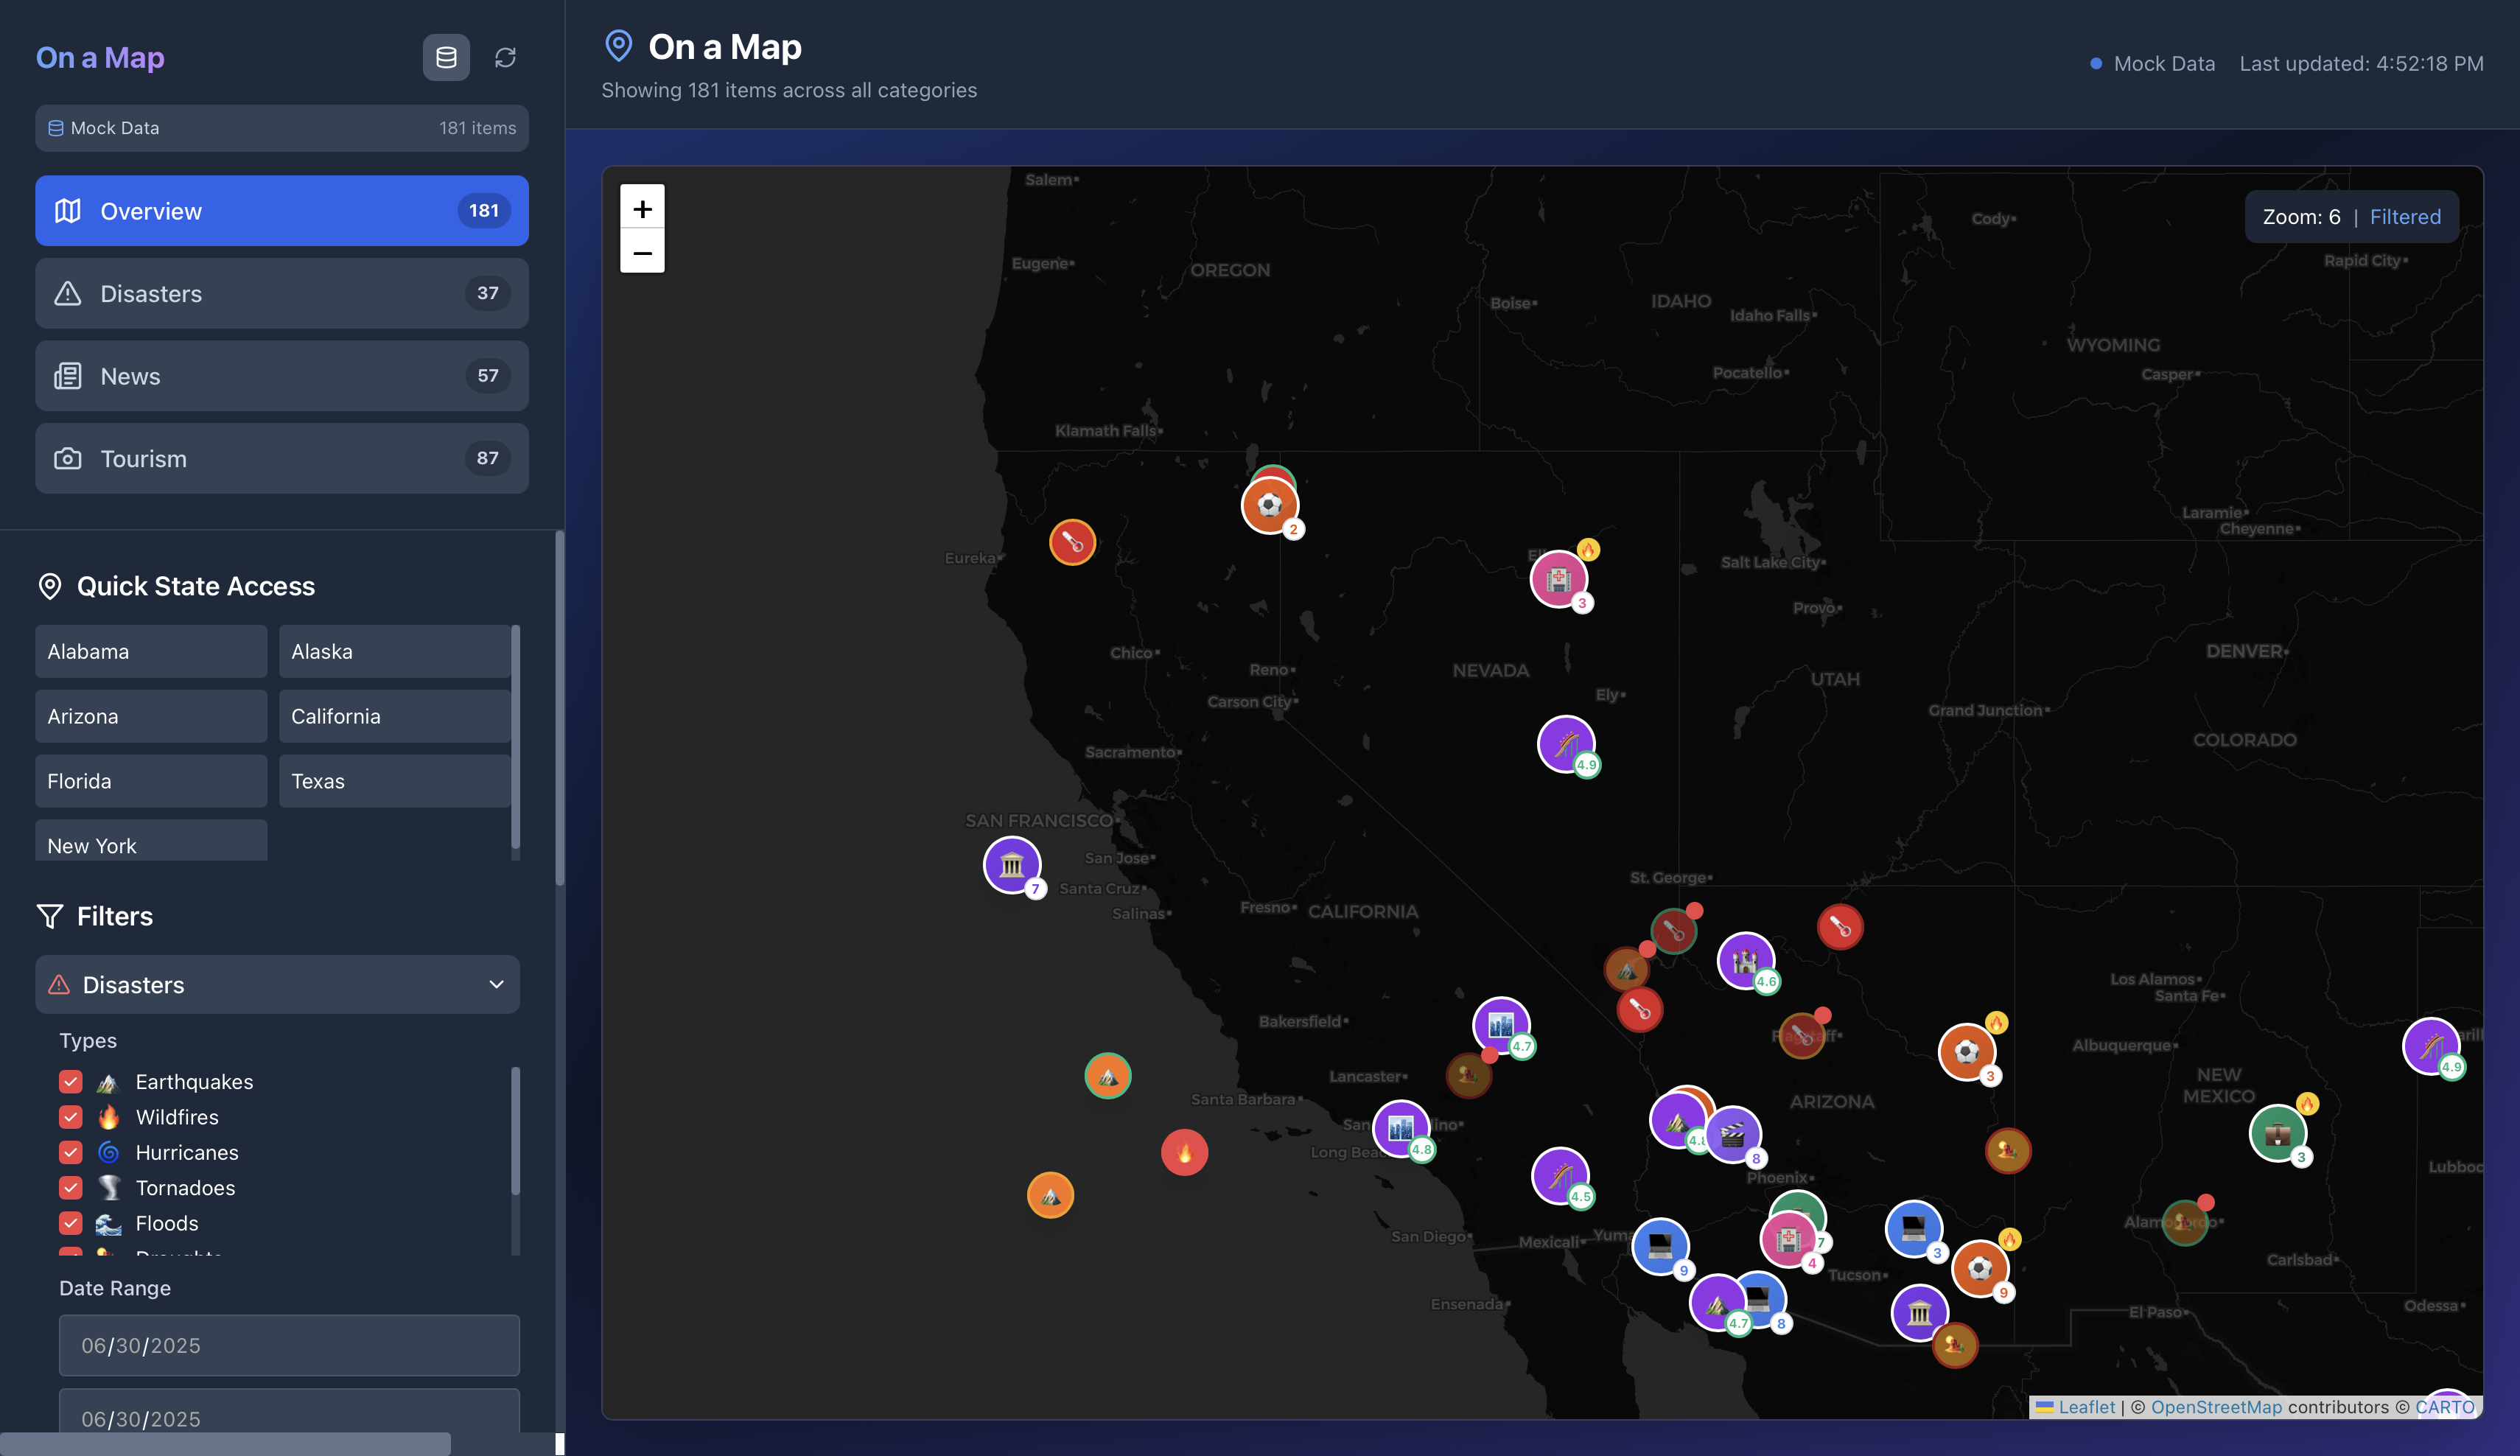
🎯 Key Features
U.S.-Only Map
- Initial viewport constrained to continental U.S.
- Zoom control limits: Min zoom shows entire country; max zoom to neighborhood level.
- Initial viewport constrained to continental U.S.
State-Level Drill-Down
- Zoom in to any state → fetch & display news stories specific to that state.
- Markers sized by “intensity” (popularity/trending score).
- Zoom in to any state → fetch & display news stories specific to that state.
Multi-Category Sidebar
- Categories:
- National News
- State News (dynamically updates when zoomed)
- Tourism & Points of Interest
- Submenus collapse/expand for clarity (e.g. list of states, list of POI types).
- Categories:
Tourism & POI Layer
- Toggle on/off: shows popular attractions (parks, monuments, museums) as distinct markers.
- Sidebar filters by “Type” (e.g. “National Parks,” “Historic Sites,” “Beaches”).
- Toggle on/off: shows popular attractions (parks, monuments, museums) as distinct markers.
Responsive UI
- Sidebar collapses into a hamburger menu on mobile.
- Map resizes fluidly; popups adapt to screen width.
- Sidebar collapses into a hamburger menu on mobile.
🔍 Data Flow
Initial Load
- Fetch top 50 national headlines (e.g. via NewsAPI).
- Plot markers at state centroids sized by article count.
- Fetch top 50 national headlines (e.g. via NewsAPI).
On Zoom / State Select
- Detect current map bounds or clicked state polygon.
- Fetch state-specific headlines (limit 20).
- Update “State News” list in sidebar.
- Detect current map bounds or clicked state polygon.
Tourism Toggle
- On enable, fetch POI data from tourism API (e.g. Foursquare, Google Places).
- Display icons by category; clicking shows name + brief description.
- On enable, fetch POI data from tourism API (e.g. Foursquare, Google Places).
🎨 UI / UX Flow
Landing:
- Full-screen U.S. map, sidebar open on left showing National News.
Zoom into State:
- State polygon highlights; sidebar auto-switches to “State News.”
Toggle Tourism:
- Sidebar category shows “Tourism” → select “National Parks” → map overlays park locations.
Filter & Search:
- Quick search field at top of sidebar to filter any list (news or POI).
🚀 Next Steps
- Authentication: allow users to save favorite states or POIs.
- Time Slider: view historical trends (e.g. past 24 hrs vs. 7 days).
- Offline Caching: implement service worker for faster reloads.
Built With
- react
- react-leaflet
- tailwind
- vite


Log in or sign up for Devpost to join the conversation.