-
-

OmniRisk
-
Dashboard
-
Hub
-
Simulator
-
Beacon
-
Beacon
-
Beacon

Inspiration
Utility field crews get hurt by hazards that were knowable the night before: lightning, extreme heat, flooding, soft soil. The data exists, but it lives in a dozen places and nobody turns it into a decision. We built OmniRisk for the PlanIT Control challenge to close that gap, from the forecast all the way to the equipment switch.
What it does
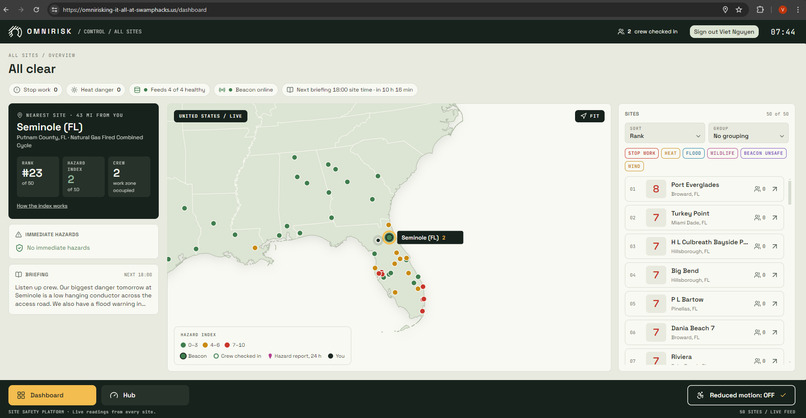
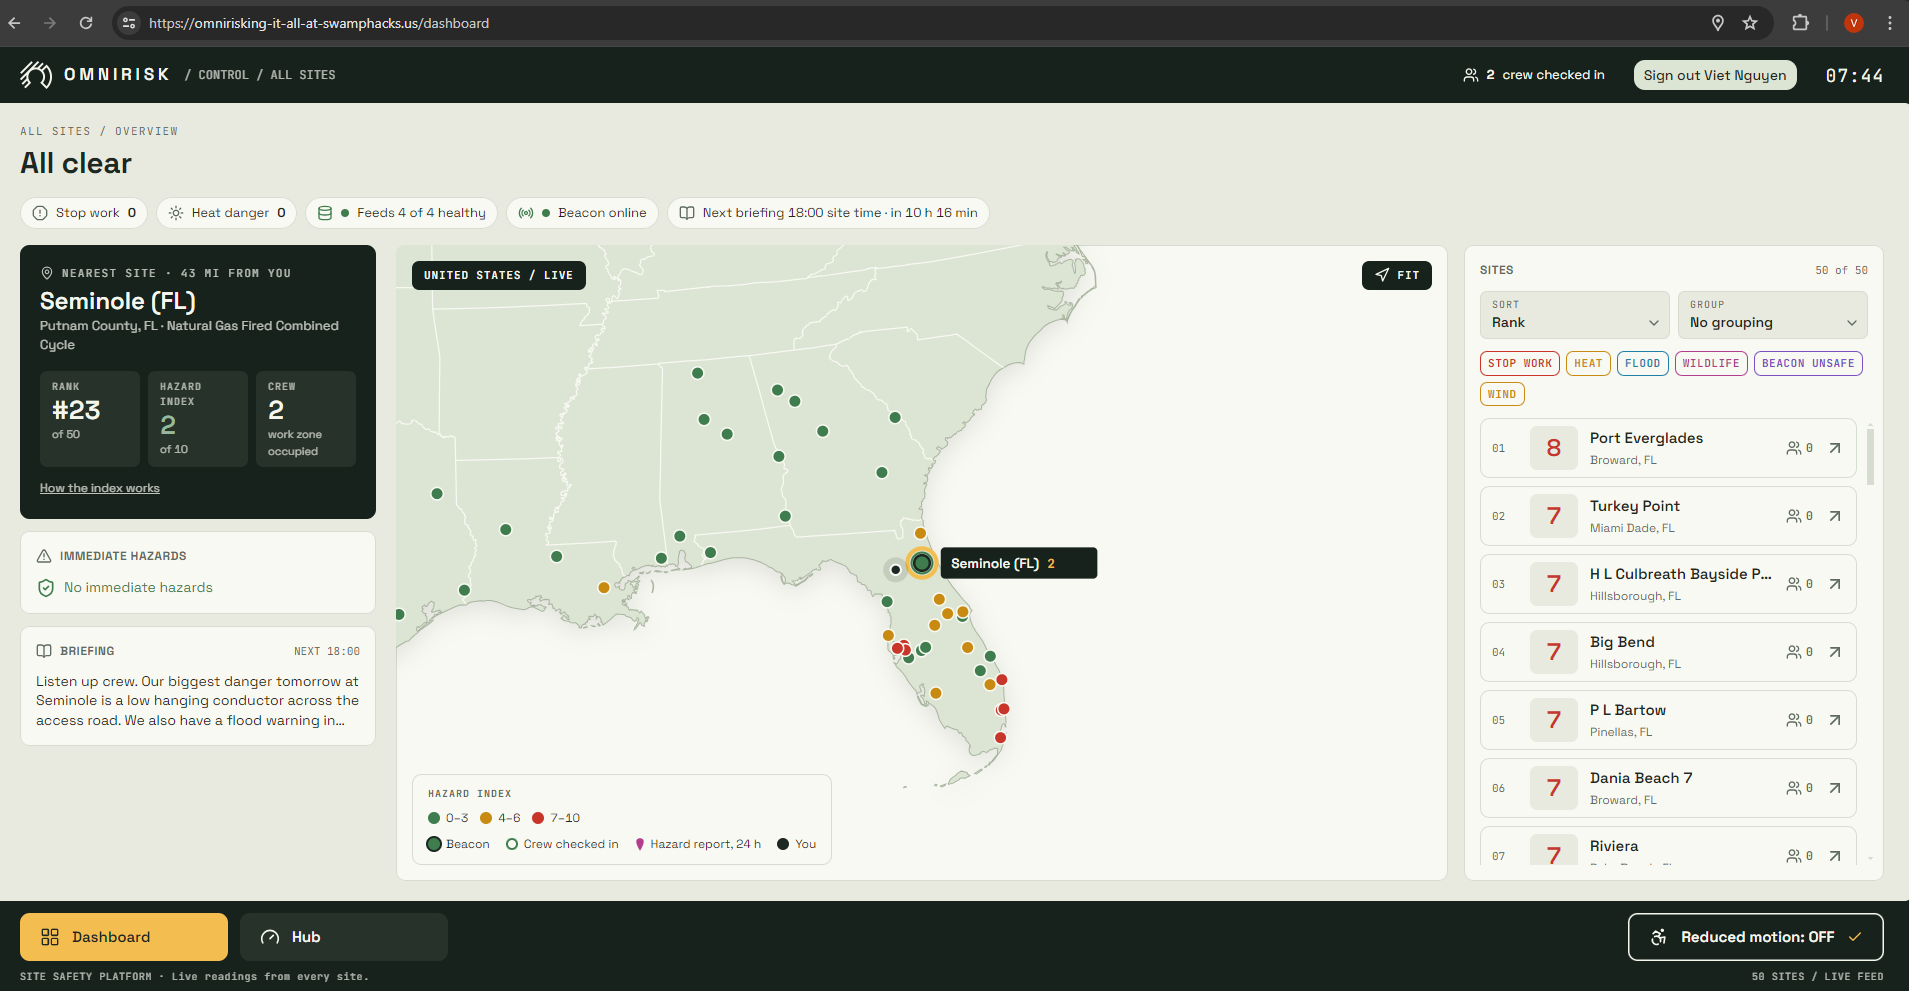
- A single pane of truth: the dashboard watches 50 real power plant sites across Florida and the Gulf states (25 in Florida, plus Texas, Alabama, Georgia, Louisiana and Mississippi), merging weather, heat, rain, soil moisture, river, FEMA flood zone, lightning, wind and wildlife data into one risk picture per site, ranked by a 0 to 10 machine learning hazard index with the three reasons behind it.
- Stop work rules: a lightning strike within 10 miles opens a 30 minute stop work countdown that restarts on every new strike. Heat index alerts fire at 103 °F (warning) and 115 °F (danger, with a 15 minute rest break sent to the beacon), river sites get flood warnings after heavy rain, standing water confirms a flood, and gusts raise wind alerts at 28 mph (aerial lifts down) and 40 mph (the job stops).
- 6 PM briefings: every evening at 6 PM in each site's local time, each site gets a next day briefing in English and Spanish, and a supervisor can run it on demand.
- Crew hazard photos: a crew member snaps a hazard on their phone, AI tags it, and it is pinned to the site map by distance and direction.
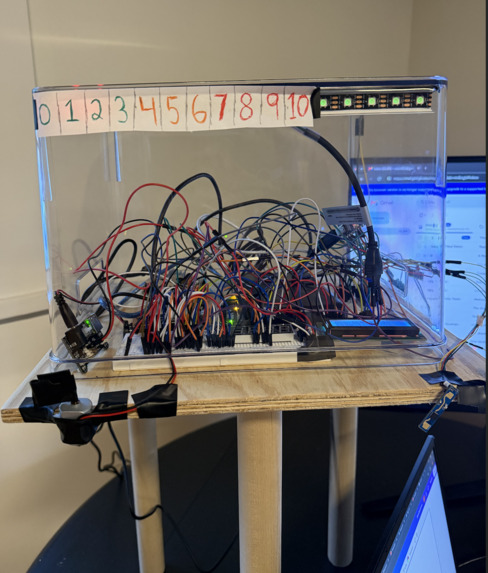
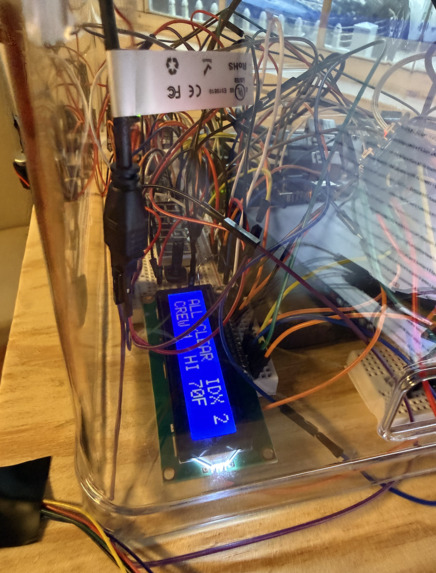
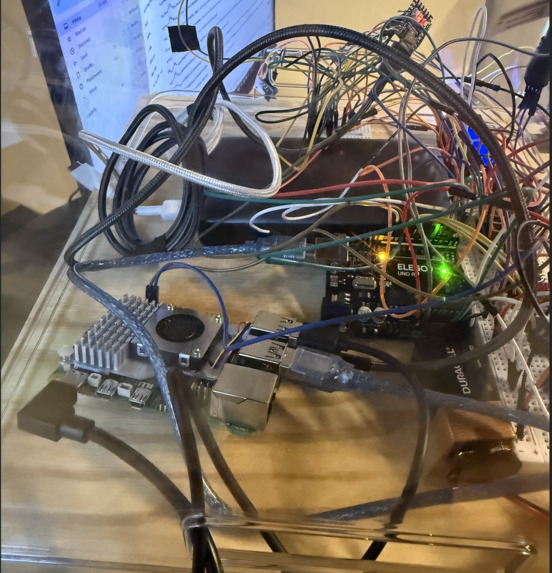
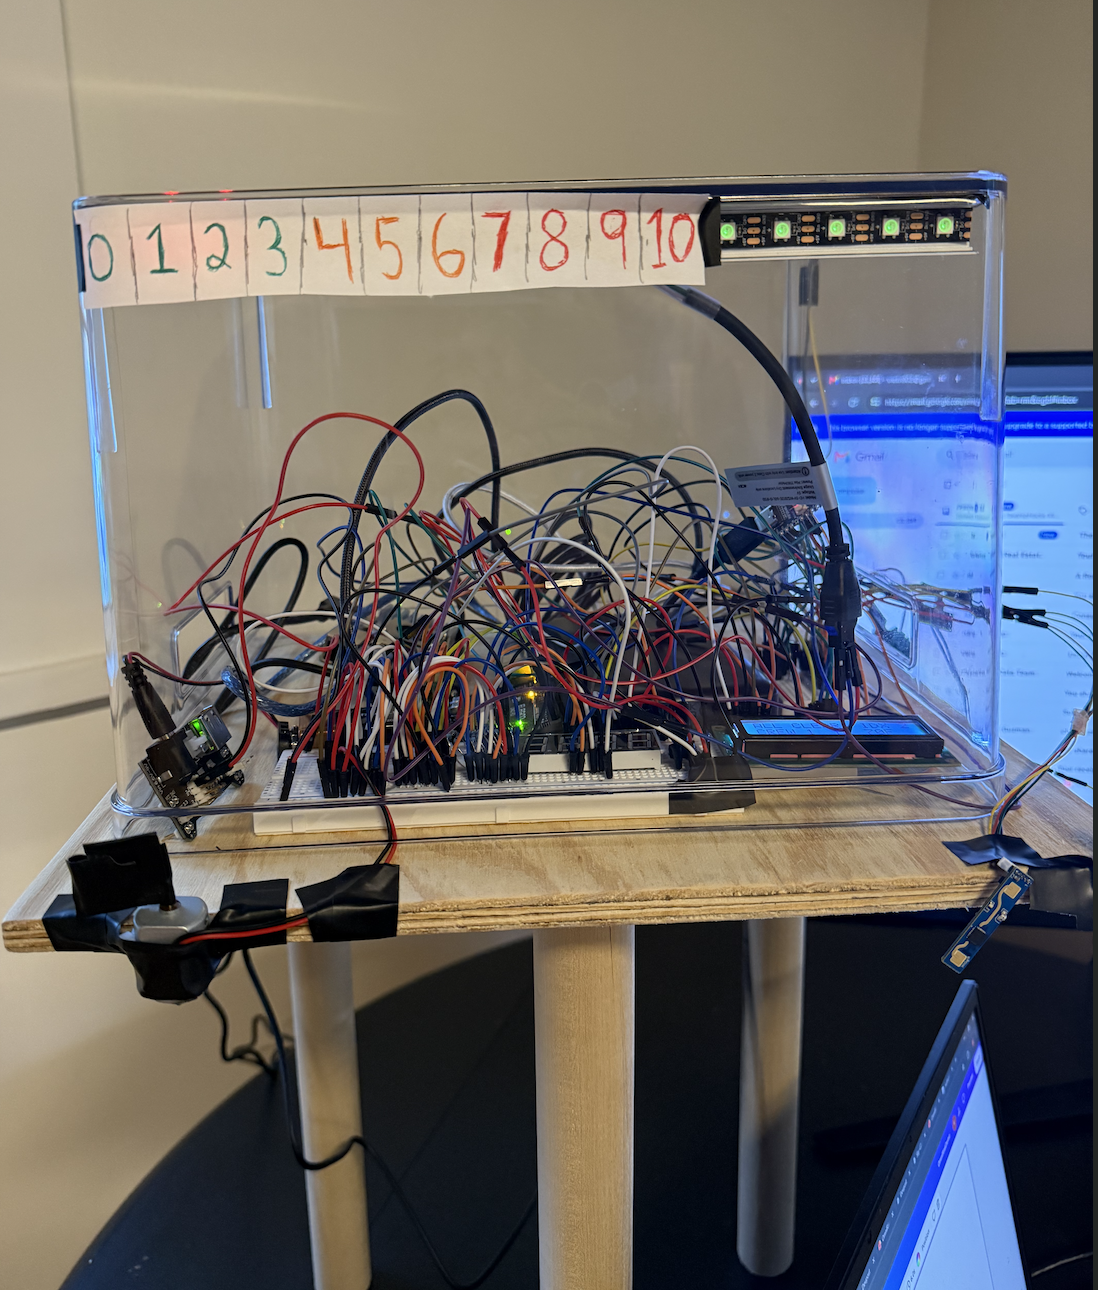
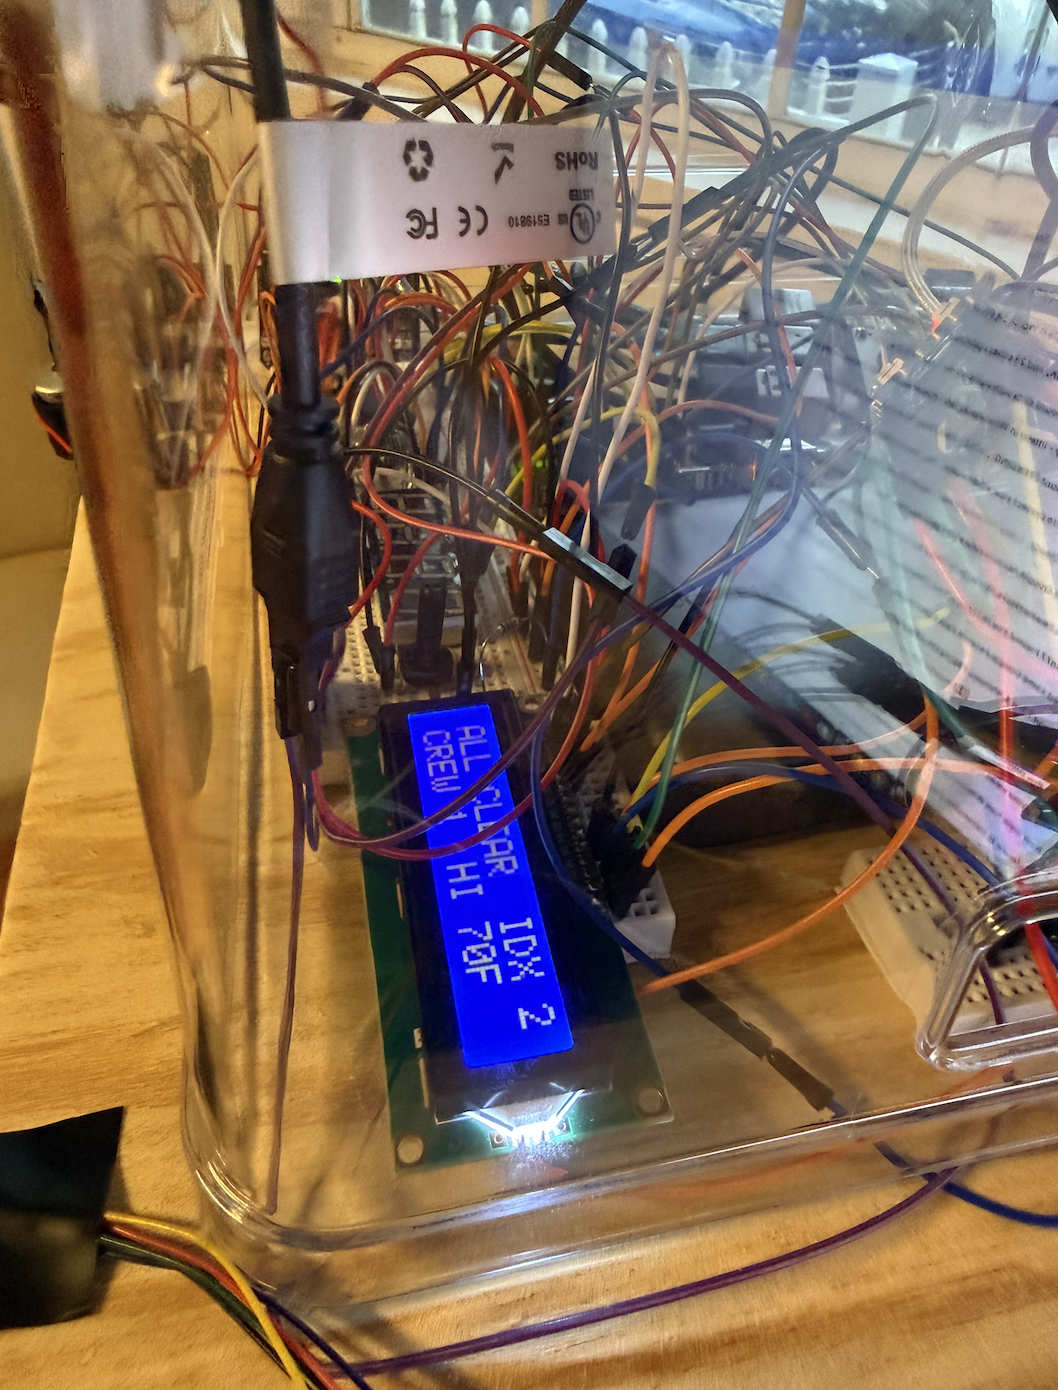
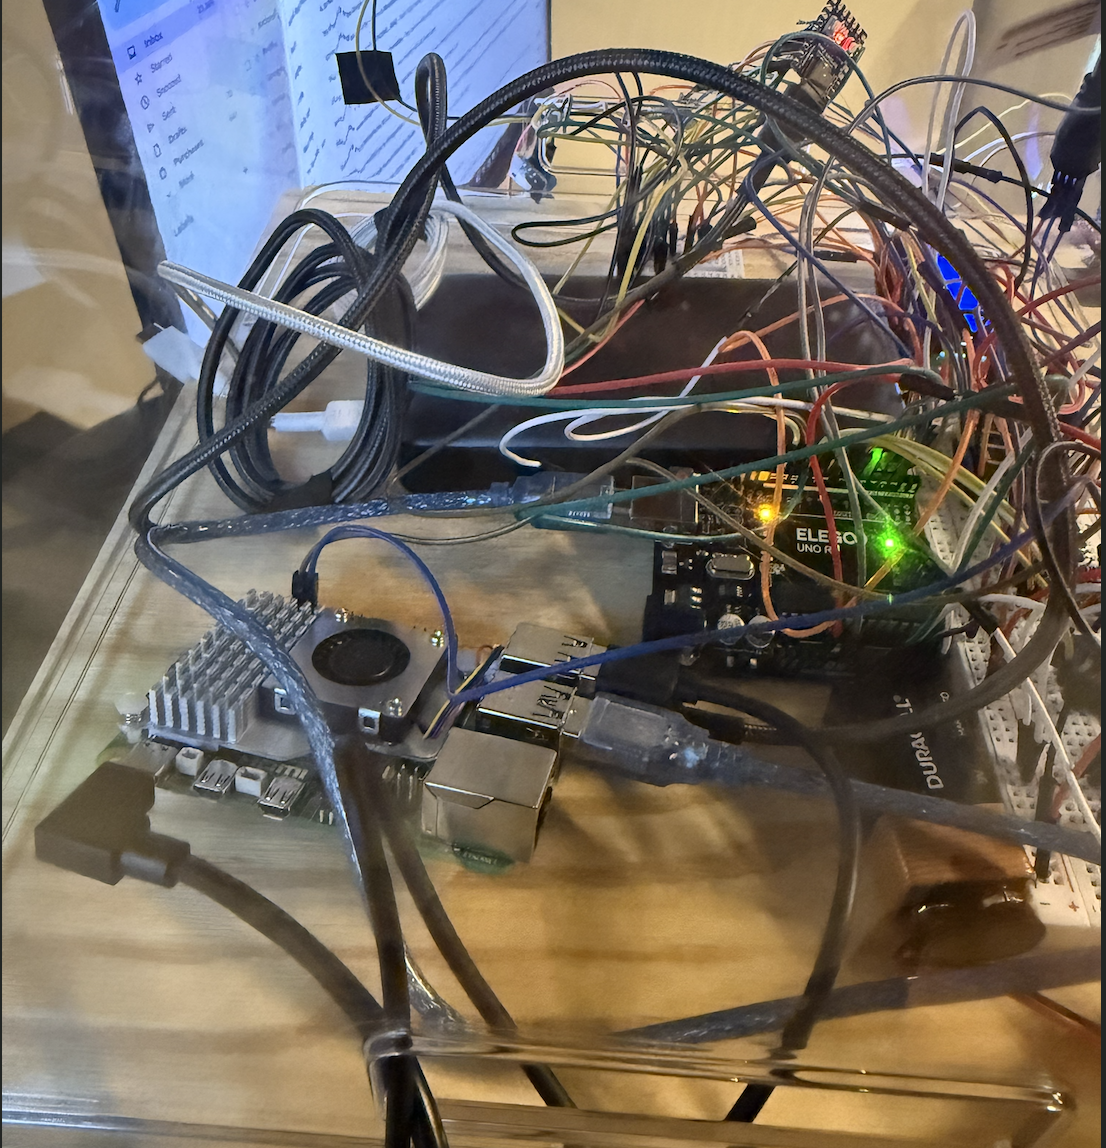
- Physical beacon: a Raspberry Pi 5 gateway, an RP2040 sensor pod and an Arduino UNO beacon head. It sees a lightning flash with its own photoresistor, cuts the equipment motor, shows the countdown, speaks the alert, and keeps enforcing its rules with no internet. A supervisor PIN on the IR remote restores power. Crew check in from their phones or the remote, a 29 LED strip shows the hazard index as a gauge, and its radar confirms the work zone is clear.
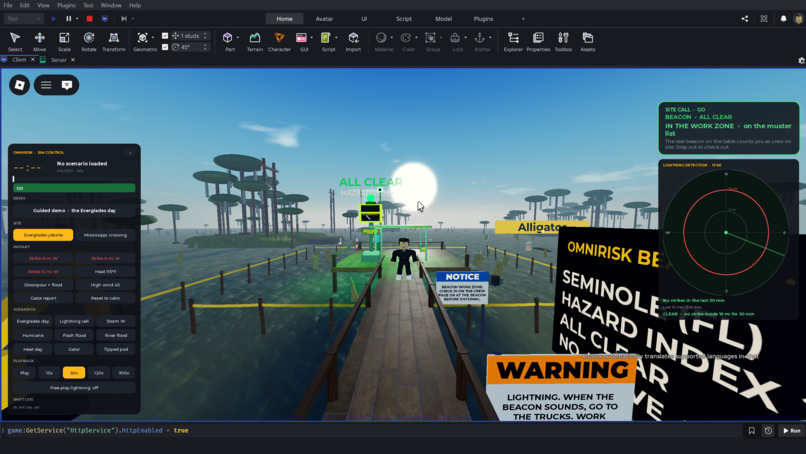
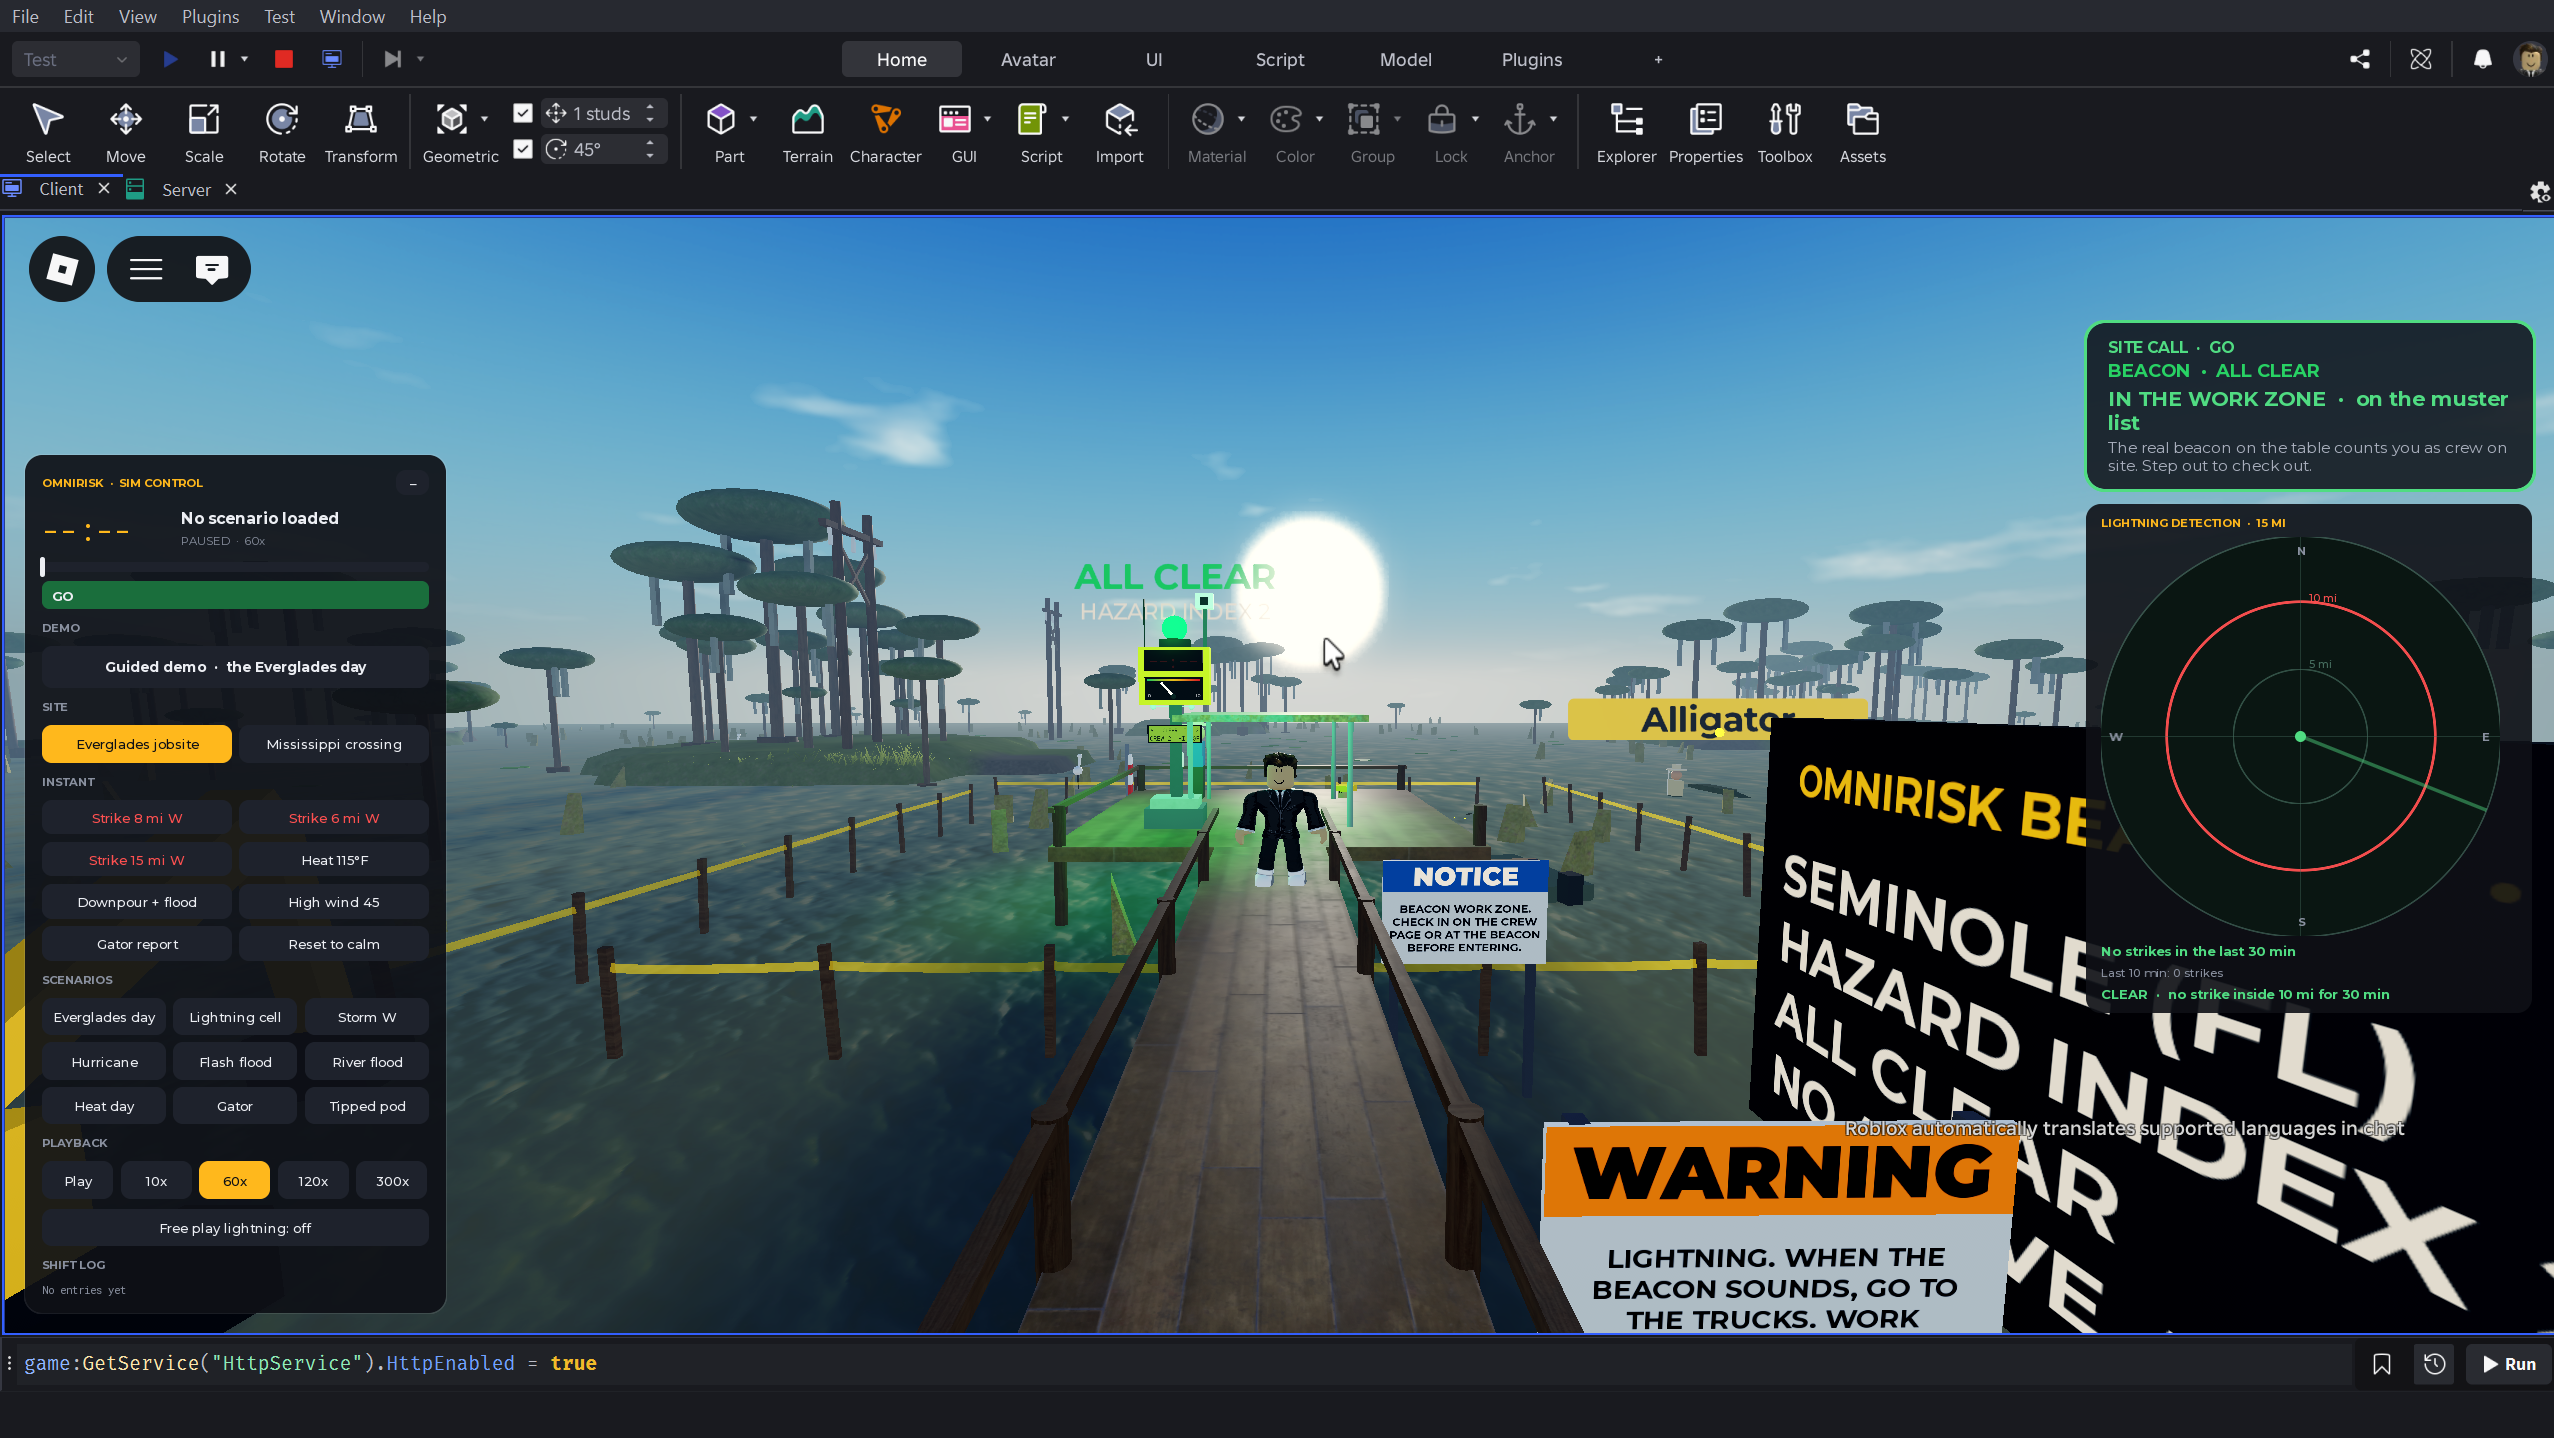
- Roblox digital twin: a physically simulated storm walks in toward the site. Every strike inside 10 miles reaches the real beacon, the in world beacon mirrors the real one, and a player who walks into the work zone appears on the muster list.
How we built it
Architecture
Four pieces talk through written contracts (event shapes, serial lines, websocket messages, REST routes), which let four people build in parallel.
flowchart LR
  subgraph Feeds["Public data"]
    OM["Open-Meteo forecast and flood API"]
    NWS["NWS alerts"]
    INAT["iNaturalist"]
    FEMA["FEMA flood zones"]
  end
  subgraph Cloud["Vultr: Docker and Caddy"]
    API["FastAPI backend<br/>rules engine and scheduler"]
    ML["LightGBM hazard index<br/>and SHAP reasons"]
    GEM["Gemini<br/>briefings and photo tags"]
  end
  DB[("Tiger Data<br/>TimescaleDB")]
  WEB["React web app<br/>Dashboard, Hub, Crew phone"]
  PI["Raspberry Pi 5 gateway"]
  POD["RP2040 sensor pod"]
  UNO["Arduino UNO beacon head"]
  FAN["Fan motor via L293D"]
  RBX["Roblox site twin<br/>World and Bridge"]
  Feeds --> API
  API <--> DB
  API --> ML
  API --> GEM
  API <-->|REST and websocket| WEB
  API <-->|websocket| PI
  RBX -->|HTTPS /sim/*| API
  POD -->|USB serial| PI
  PI -->|USB serial| UNO
  PI -->|GPIO 18| FAN
Backend and rules engine
FastAPI with asyncpg on Tiger Data (TimescaleDB hypertables for conditions and events), APScheduler for the feeds (Open-Meteo weather and NWS alerts every 15 minutes, the Open-Meteo flood API hourly, iNaturalist every 6 hours) and a per site 6 PM job in each site's own time zone. Auth0 JWTs carry a supervisor role claim. Three websockets connect everything live: one per site for the dashboard, one for the Pi gateway, and the Roblox bridge over HTTPS. It runs in Docker on Vultr behind Caddy with Let's Encrypt.
Distance to a strike uses the haversine formula, with $R = 6371$ km:
$$d = 2R \arcsin\sqrt{\sin^2\frac{\Delta\varphi}{2} + \cos\varphi_1\cos\varphi_2\sin^2\frac{\Delta\lambda}{2}}$$
The lightning rule. A strike $s$ at time $t_s$ counts if $d_s \le 16{,}093$ m (10 miles). The site is clear only once 30 minutes pass with no counting strike:
$$t_{\text{clear}} = \max_{s\,:\,d_s \le 16{,}093\ \text{m}} \left(t_s + 1800\ \text{s}\right)$$
When the clock runs out the beacon stays locked out until a supervisor releases it, so the equipment never restarts on its own.
Heat index, from the National Weather Service Rothfusz regression, with $T$ in °F and $R$ the relative humidity in percent (for $T \ge 80$ °F; below that $HI = T$):
$$\begin{aligned}HI ={}& -42.379 + 2.04901523\,T + 10.14333127\,R - 0.22475541\,TR - 6.83783\times10^{-3}\,T^2 \ & - 5.481717\times10^{-2}\,R^2 + 1.22874\times10^{-3}\,T^2R + 8.5282\times10^{-4}\,TR^2 - 1.99\times10^{-6}\,T^2R^2\end{aligned}$$
$HI \ge 103$ °F opens a heat warning; $HI \ge 115$ °F opens heat danger and sends the beacon a 15 minute rest break.
Floods. River sites get a flood warning when the 24 hour rain total exceeds 50 mm or the river discharge $Q$ exceeds 2.5 times its 90 day mean, $Q > 2.5\,\bar{Q}_{90}$. Standing water on the site (the beacon's probe or the twin's flood) confirms the flood, and the alert clears when the water reads 0 again.
Wind. Gusts of 28 mph or more raise a wind warning (aerial lifts and bucket trucks grounded) and 40 mph or more a wind danger (the job stops). Heat, flood and wind alerts refresh while the condition lasts and expire an hour after it ends.
The hazard index (machine learning)
flowchart TB
  EIA["EIA-860M: the 50 largest plants<br/>25 in Florida, 25 across the Gulf states"] --> W["Open-Meteo archive, 2016 to 2024<br/>daily weather per site"]
  NOAA["NOAA Storm Events<br/>within 40 km, same day"] --> L["Site-day labels<br/>164,400 site-days"]
  OSHA["OSHA severe injuries<br/>outdoor, within 25 km"] --> L
  W --> F["20 features"]
  STATIC["FEMA flood zone, coastal, river, lat, lon"] --> F
  F --> S{"Split by time"}
  L --> S
  S -->|"2016 to 2022"| T["LightGBM training"]
  S -->|"2023"| V["Early stopping, isotonic calibration, decile cuts"]
  S -->|"2024"| X["Held out test year"]
  V --> P["Live: tomorrow's forecast to probability,<br/>index and three SHAP reasons"]
Sites. The 50 largest power plants by capacity from the EIA-860M generator inventory (generator rows summed per plant): the top 25 in Florida and the top 25 in Texas, Alabama, Georgia, Louisiana and Mississippi. Each site carries its FEMA flood zone, a coastal flag and a river flag.
Labels. Every site and day from 2016 to 2024 is one example: $50 \times 3288 = 164{,}400$ site-days. A site-day is positive if any of these happened that day:
- a NOAA Storm Events record (heat, lightning, flood, flash flood, coastal flood, thunderstorm wind, high or strong wind, tornado, hail, tropical storm, hurricane) with coordinates within 40 km of the site,
- a zone-based Storm Events record (mostly heat) whose county matches the site's county,
- an OSHA severe injury report flagged outdoor (construction or electric utility NAICS, or a narrative mentioning heat, lightning, storm, flood, mud, trench, pole, line, or bucket truck) within 25 km.
About 6% of site-days are positive (5.8% in the test year).
Features (20). Daily max, apparent max and min temperature, max relative humidity, precipitation and rain totals, 3 and 7 day precipitation, soil moisture, max gust and wind, heat index (as the apparent temperature max in °F, which avoids pairing dawn humidity with afternoon heat), month and day of year as $\sin(2\pi d/365)$ and $\cos(2\pi d/365)$, and the static FEMA flood zone, coastal, river, latitude and longitude.
Model. Gradient boosted trees (LightGBM). Each round adds a tree to the log-odds score,
$$F_m(x) = F_{m-1}(x) + \eta\, h_m(x), \qquad \eta = 0.05,$$
with 31 leaf trees, at least 50 samples per leaf and 80% of features per tree. Positives are rare, so they are weighted by $w = N_{\text{neg}}/N_{\text{pos}}$ in the log loss:
$$\mathcal{L} = -\sum_i w_i\left[y_i \log p_i + (1-y_i)\log(1-p_i)\right], \qquad p_i = \sigma(F(x_i))$$
Training stopped early on the 2023 validation year's average precision, at 182 trees.
Split by time, never at random. The same storm hits neighboring sites on the same day, so a random split would leak it into both training and test. We trained on 2016 to 2022, validated and calibrated on 2023, and tested once on 2024.
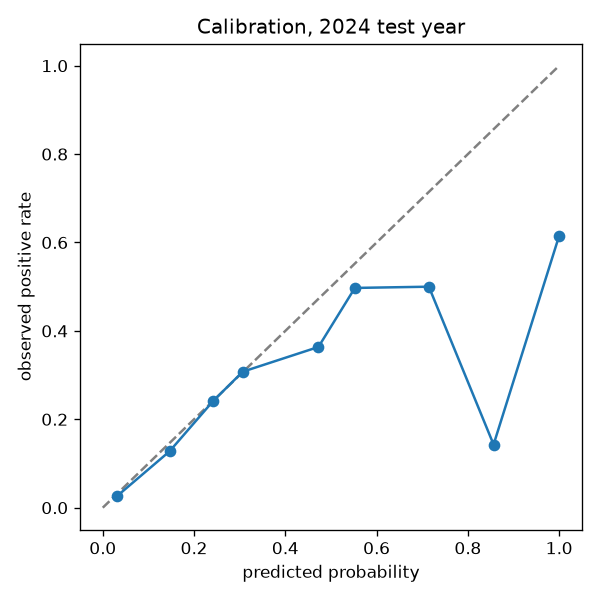
Calibration. The class weights distort the raw scores, so an isotonic regression fit on 2023 maps them back to real probabilities. It finds the non-decreasing function $g$ that minimizes
$$\sum_i \left(y_i - g(s_i)\right)^2,$$
stored as points and applied with linear interpolation, so a 0.20 means about a 20% chance of a hazard day. Predicted probabilities track what actually happened up to about 0.3, which is where nearly every site-day falls; above 0.5 there are only a handful of days per bin and the model is overconfident.
From probability to index. The calibrated probability $\hat{p}$ is placed among the validation year's deciles $q_1 < \dots < q_9$:
$$I(x) = \sum_{k=1}^{9} \mathbf{1}\left[\hat{p}(x) > q_k\right]$$
So a 7 means tomorrow looks riskier than 70% of the site-days the model was validated on.
The three reasons. SHAP (TreeExplainer) splits each prediction into feature contributions, the Shapley values
$$\phi_j = \sum_{S \subseteq F \setminus {j}} \frac{|S|!\,(|F|-|S|-1)!}{|F|!}\left[f(S \cup {j}) - f(S)\right], \qquad \sum_j \phi_j = f(x) - \mathbb{E}[f(X)].$$
Same-signal features are summed (heat index, apparent max and max temperature; rain and precipitation; gusts and wind), and the three largest weather contributions are shown as plain values like "3 day rain 111 mm" or "Gusts 49 km/h". Location features stay in the model but are never shown as a reason.
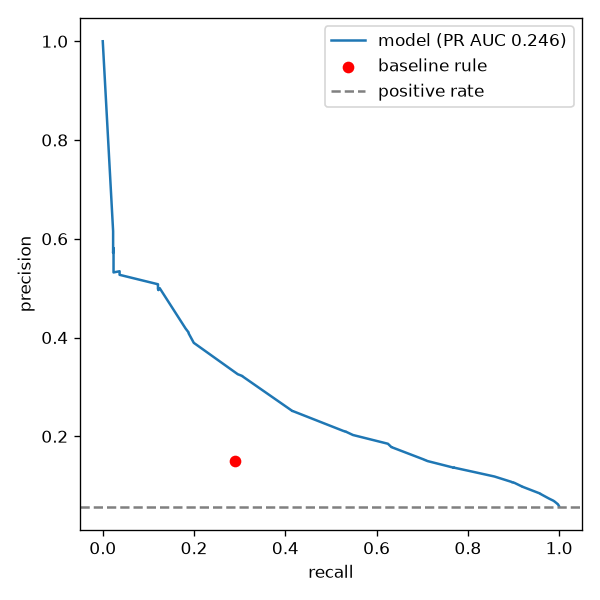
Results on 2024, a year the model never saw (18,300 site-days, 5.8% positive). The baseline is the rule a supervisor would write by hand: heat index of 103 °F or more, 3 day rain of 75 mm or more, or gusts of 60 km/h or more.
| Metric | Model | Hand rule |
|---|---|---|
| PR AUC (average precision) | 0.246 | 0.084 |
| ROC AUC | 0.817 | 0.594 |
| Brier score (lower is better) | 0.049 | 0.136 |
| Recall (hazard days caught) | 52.7% | 28.9% |
| Precision at 50% recall | 21.1% | 14.9% |
Average precision is $AP = \sum_n (R_n - R_{n-1})\,P_n$ over the precision recall curve, and the Brier score is $\frac{1}{N}\sum_i (\hat{p}_i - y_i)^2$. A random guess would score an average precision of about 0.058, the positive rate, so the model is about 4 times better than chance and 3 times better than the rule. The rule catches 29% of hazard days and is right 15% of the time it fires. Set to catch half of them, the model is right 21% of the time: more hazards caught and fewer false alarms, against a 5.8% base rate.
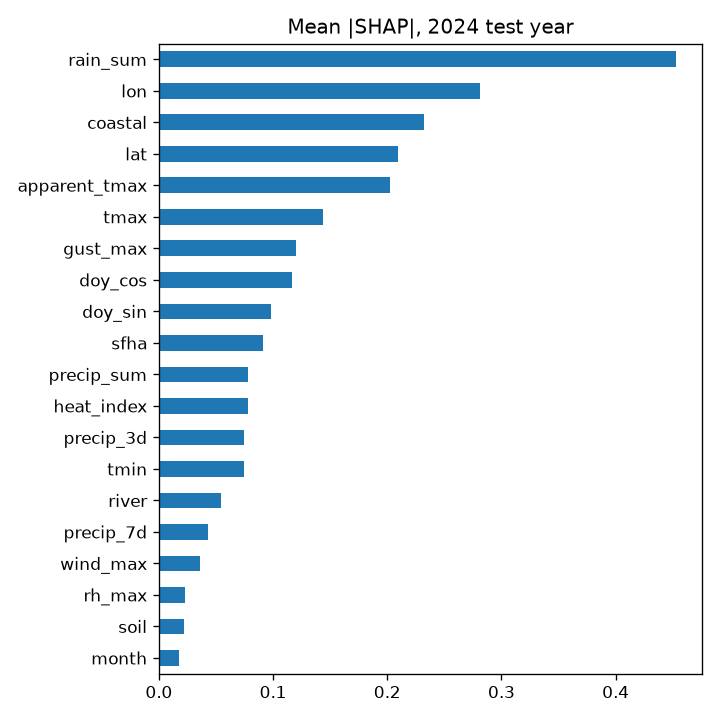
What it is not. The label is at county and day resolution, so the model cannot know whether a particular crew was exposed; it is a ranking tool for deciding where to look first, not a forecast of injury. Zone-based heat events are matched to counties by name and are undercounted. OSHA reports are placed by zip code, which can be several kilometers off, and the outdoor flag is a keyword match. Location ranks high in the SHAP chart, so part of what the model learned is which sites have historically been riskier, not only which weather is. The heat feature is the day's maximum apparent temperature, not the NWS heat index formula, because the daily data cannot pair the afternoon high with afternoon humidity. Training weather is reanalysis and scoring weather is a forecast, so tomorrow's index inherits the forecast's error. The baseline rule is in every table so you can see how much the model adds.
Gemini
Gemini writes the bilingual briefings, the one sentence explanation of each index, and the hazard photo tags, all through JSON response schemas. Every number in generated text is checked against the data it was given. With $N(\cdot)$ the set of numbers in a text, a briefing is accepted only if
$$N(\text{output}) \subseteq N(\text{input}),$$
otherwise it retries once, then falls back to a template built from the input alone, so a briefing can never state a number that is not in the data. Calls go through a small queue that retries rate limits and server errors.
The physical beacon
Sensor pod (RP2040-Zero, MicroPython). Core 1 samples the photoresistor at 5 kHz. At boot it measures the resting light, mean $\mu$ and standard deviation $\sigma$, and sets the flash threshold
$$\theta = \mu + \max(6\sigma,\ 1500)$$
in 16 bit ADC counts. A flash needs two samples in a row above $\theta$, with a 300 ms refractory period, and the mean tracks slow light changes so a passing shadow is not lightning. Core 0 reads the LD2410B mmWave radar (presence and distance), the DHT11, the water probe and the tilt switch, decodes the IR remote (NEC protocol on a pin interrupt), and streams one line every 100 ms.
Flash to bang. When thunder is heard (a microphone page on the twin laptop, or a USB mic on the Pi), the distance is
$$d = c\,\Delta t, \qquad c \approx 343\ \text{m/s},$$
so 10 miles is a gap of about 46.9 s, roughly 4.69 s per mile. Pairs must fall between 0.3 and 60 s. Offline with no microphone, a flash alone fails safe to a stop work with the distance unknown.
Beacon head (Arduino UNO). It drives the LCD1602 text screen, the 4 digit countdown (a 74HC595 shift register, one digit lit every 2 ms) and a 29 LED WS2812B strip. The strip is the gauge: a white bar climbs from LED10 toward LED1 with the hazard index, and LED25 to LED29 show the status color (green, yellow, red, strobing red in a stop work). The countdown on the display, the LCD and the dashboard all come from the UNO's own once a second echo, so they never disagree. The serial link runs at 9600 baud on purpose: one byte takes longer than the strip update's 1 ms interrupt pause, so no command is ever lost.
Gateway (Raspberry Pi 5, Python asyncio). It runs the local rules, holds the equipment interlock on GPIO 18 through an L293D driver (low stops the motor, and the pin is held low if the program stops or crashes), speaks with Piper text to speech offline in English and Spanish, and handles the remote: crew numbers check in, OK plus the 4 digit PIN plus OK releases a stop work. Offline it keeps enforcing everything, queues its events and replays them in order with their original timestamps when it reconnects. A stop work survives a reboot, and a release made on the dashboard while the beacon was offline is applied when it comes back.
stateDiagram-v2
  [*] --> AllClear
  AllClear --> StopWork: strike within 10 mi
  StopWork --> StopWork: new strike within 10 mi, countdown restarts
  StopWork --> LockedOut: 30 min with no strike
  StopWork --> AllClear: supervisor PIN or dashboard release
  LockedOut --> AllClear: supervisor PIN or dashboard release
  AllClear --> StopWork: offline flash with no mic, fail safe
The Roblox digital twin
The twin's lightning is simulated physics, not a script. A storm cell starts about 20 miles out and moves toward the site,
$$\mathbf{p}(t) = \mathbf{p}_0 + \mathbf{v}\,t,$$
and its cloud to ground flash rate rises and falls over its life $T$:
$$\lambda(t) = \lambda_{\text{peak}}\sin\left(\frac{\pi t}{T}\right)$$
Strike times are a non-homogeneous Poisson process, drawn by thinning: candidates arrive every $\Delta t = -\ln U / \lambda_{\max}$ and are kept with probability $\lambda(t)/\lambda_{\max}$. 95% of strikes land at a Rayleigh distributed offset from the cell's core,
$$f(r) = \frac{r}{\sigma^2}\, e^{-r^2/2\sigma^2}, \qquad \sigma = 1.5\ \text{mi},$$
and 5% are "bolts from the blue", 5 to 10 miles ahead of the storm. Each strike's distance and bearing to the site are computed from its position, never typed in. Thunder arrives after $d/c(T)$ with the speed of sound set by the scenario's air temperature,
$$c(T) = 331.3 + 0.606\,T\ \text{m/s},$$
its loudness falls as $1/d$ and fades to silence between 10 and 15 miles, and the screen flash falls as $1/d^2$. The random number generator is seeded, so a scenario plays out the same way every time and a test harness (Lune) can verify the exact strikes Studio fires.
sequenceDiagram
  participant R as Roblox twin
  participant B as Backend
  participant G as Pi gateway
  participant U as UNO and fan
  participant D as Dashboard
  R->>B: POST /sim/strike (bearing, miles)
  B->>B: within 16,093 m, open or extend stop work
  B-->>D: websocket alert
  B->>G: STOPWORK 1800 s
  G->>U: GPIO 18 low, fan stops, countdown starts
  G->>G: speaks "Lightning detected, 8 miles"
  U-->>G: COUNT once a second
  Note over R,D: every strike within 10 mi restarts the 30 minutes
  G->>G: remote OK, PIN, OK
  G->>U: GPIO 18 high, fan restarts
  G->>B: PIN accepted
  B-->>D: stop work cleared by "Supervisor PIN at beacon"
The twin also drives weather, floods (the water depth reaches the beacon as if its own probe were wet), wind, heat and an alligator sighting, and players inside the work zone appear on the muster list.
Web
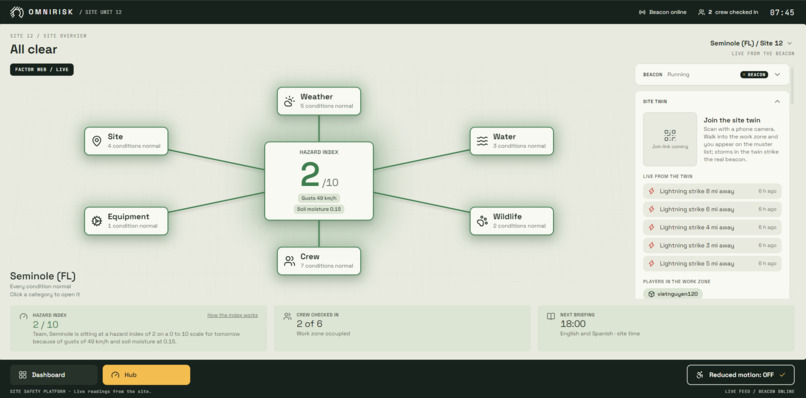
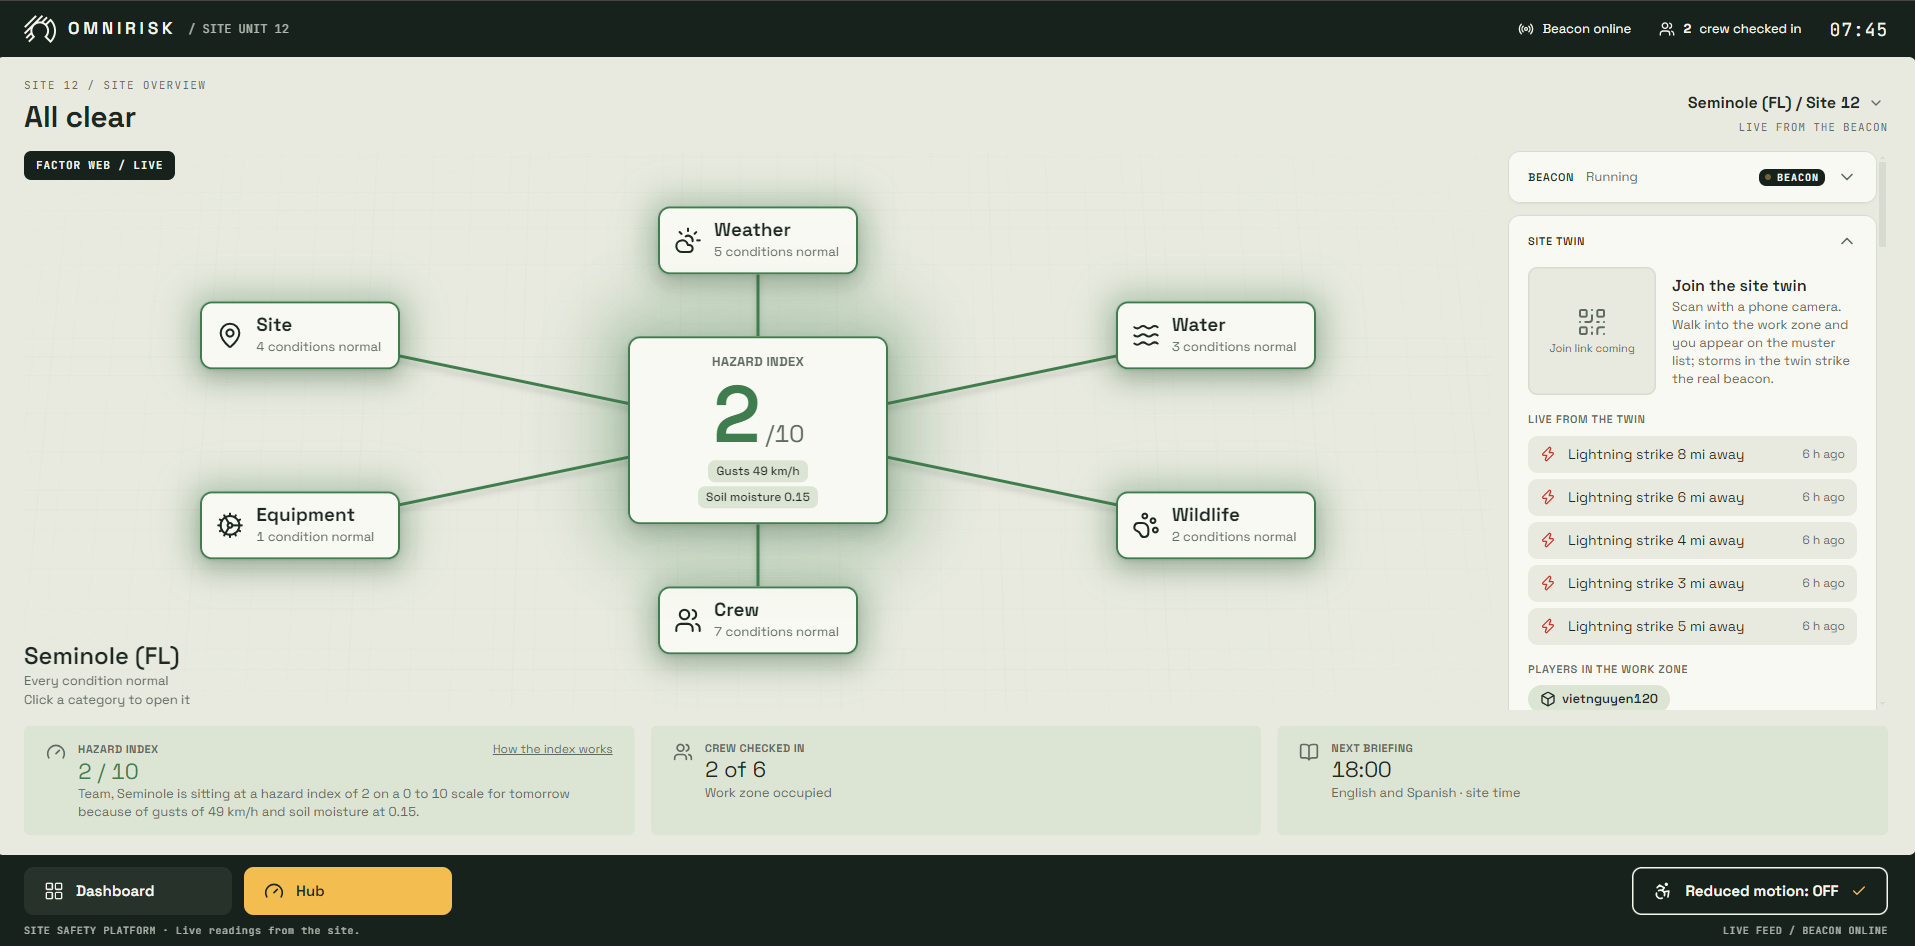
A React and TypeScript app (Vite, Tailwind): the Dashboard (map, ranked site list, status of every data feed and the beacon), the Hub for each site (the factor web from categories down to live readings with trends and forecasts, the hazard index and its reasons, muster, the 48 hour conditions chart, hazard reports, briefings, the compliance log of every stop work), a phone first crew page (sign in, check in, condition cards with what to do, hazard photos), and Auth0 sign in with a supervisor role for releases.
Challenges we ran into
- Building a hazard label from county and zip code level records without leaking the same storm into both training and test data.
- Keeping the beacon fully functional offline, then syncing its events once it reconnects, including a release made on the dashboard while the beacon was offline.
- Getting Roblox, the backend and physical sensors to agree in real time, and making the twin's lightning physically correct instead of scripted.
- Real hardware: a DC motor's electrical kick could garble the LCD mid write (the UNO now resyncs and redraws it every 5 seconds), a power bank sagged the Pi's 5 V under load and browned out the speaker (it runs on wall power), and our only spare servo was a continuous rotation type that cannot hold a position, so the LED strip became the gauge.
Accomplishments that we're proud of
- The model clearly beats the rule a supervisor would write by hand, and we are honest about its limits.
- Stop work is physically enforced: the beacon actually cuts power, it fails safe if its own program stops, and only a supervisor PIN restores it.
- A physically simulated storm in Roblox stops a real fan on the table.
What we learned
Calibration and an honest baseline matter more than a single headline metric. Hardware that has to work offline shapes the whole system design. Clear contracts between components let four people build in parallel in about 30 hours.
What's next for OmniRisk
More sites and regions, real lightning network feeds, document ingestion (site PDFs and inspection records feeding each site's hazard history), wind and wildlife warnings on the beacon itself, a published twin that anyone can join from a phone, a microphone on the beacon so flash to bang works fully offline, pilots with utility crews, and a hardened beacon enclosure.
Built With
- arduino
- auth0
- docker
- fastapi
- gemini
- lightgbm
- luau
- open-meteo
- python
- raspberry-pi
- roblox
- rp2040
- shap
- tigerdata
- timescaledb
- typescript
- vultr
- websockets


Log in or sign up for Devpost to join the conversation.