-
-
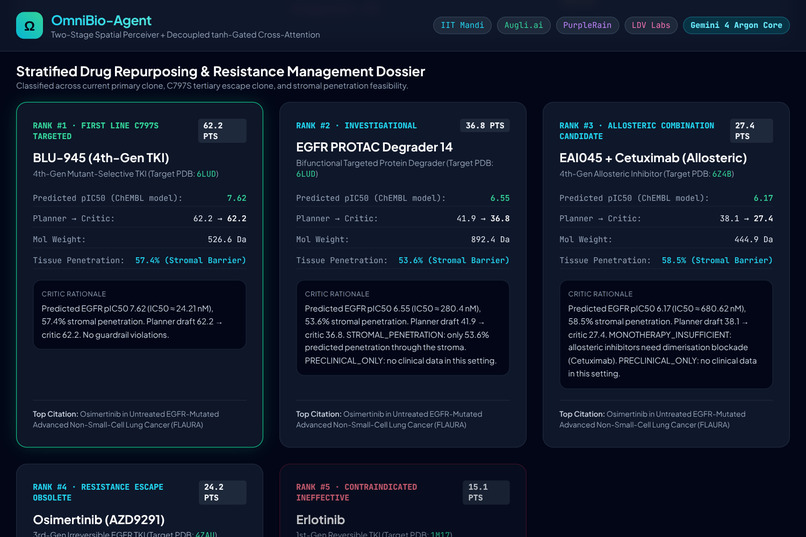
Drug-Ranking
-
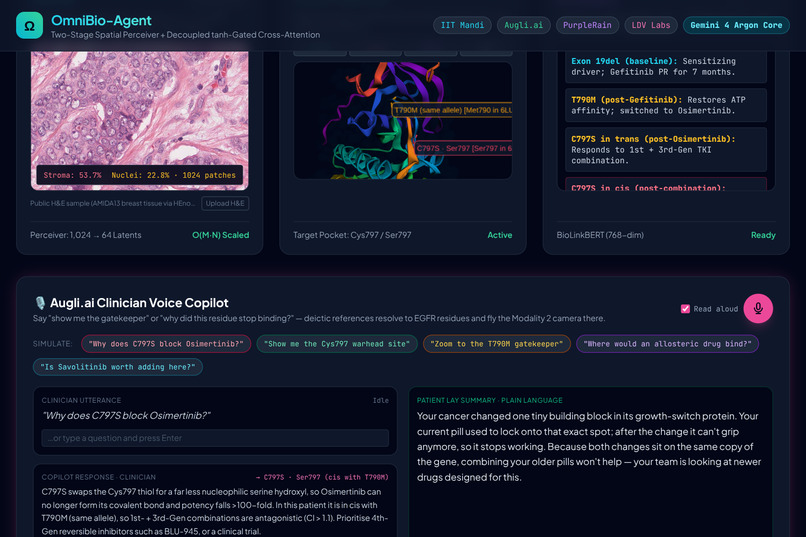
Voice-Copilot
-
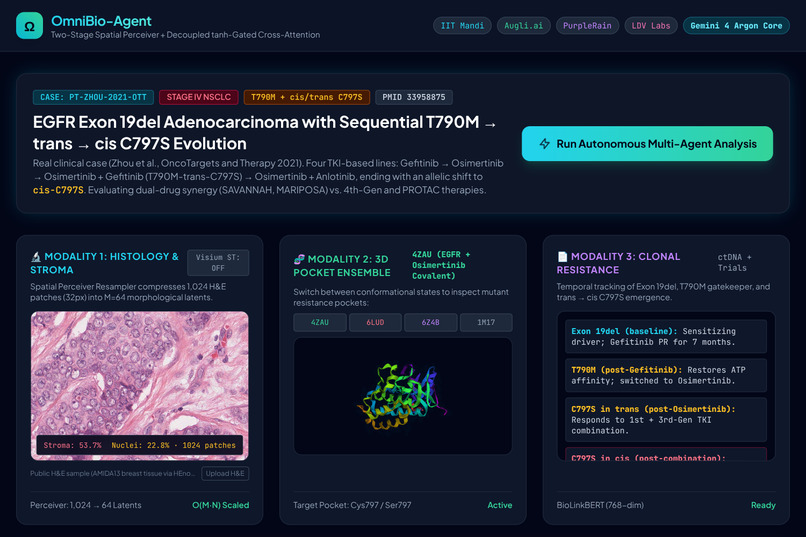
Dashboard
-
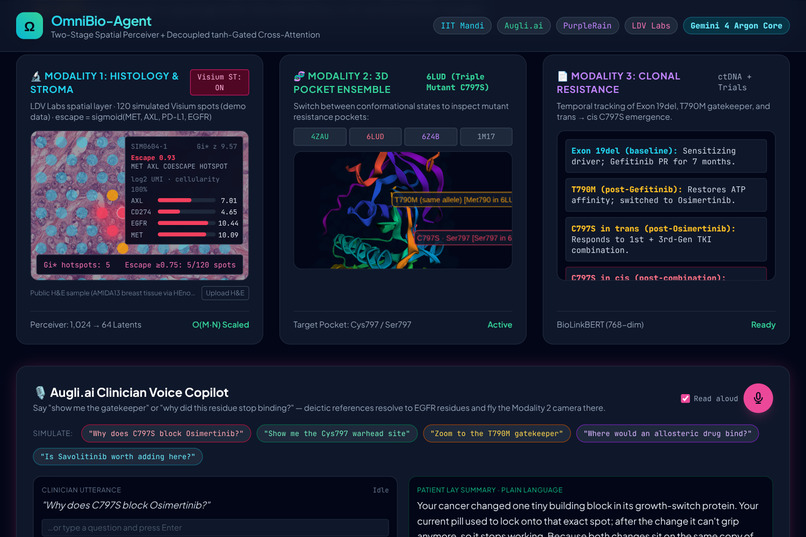
Spatial-Overlay
Inspiration
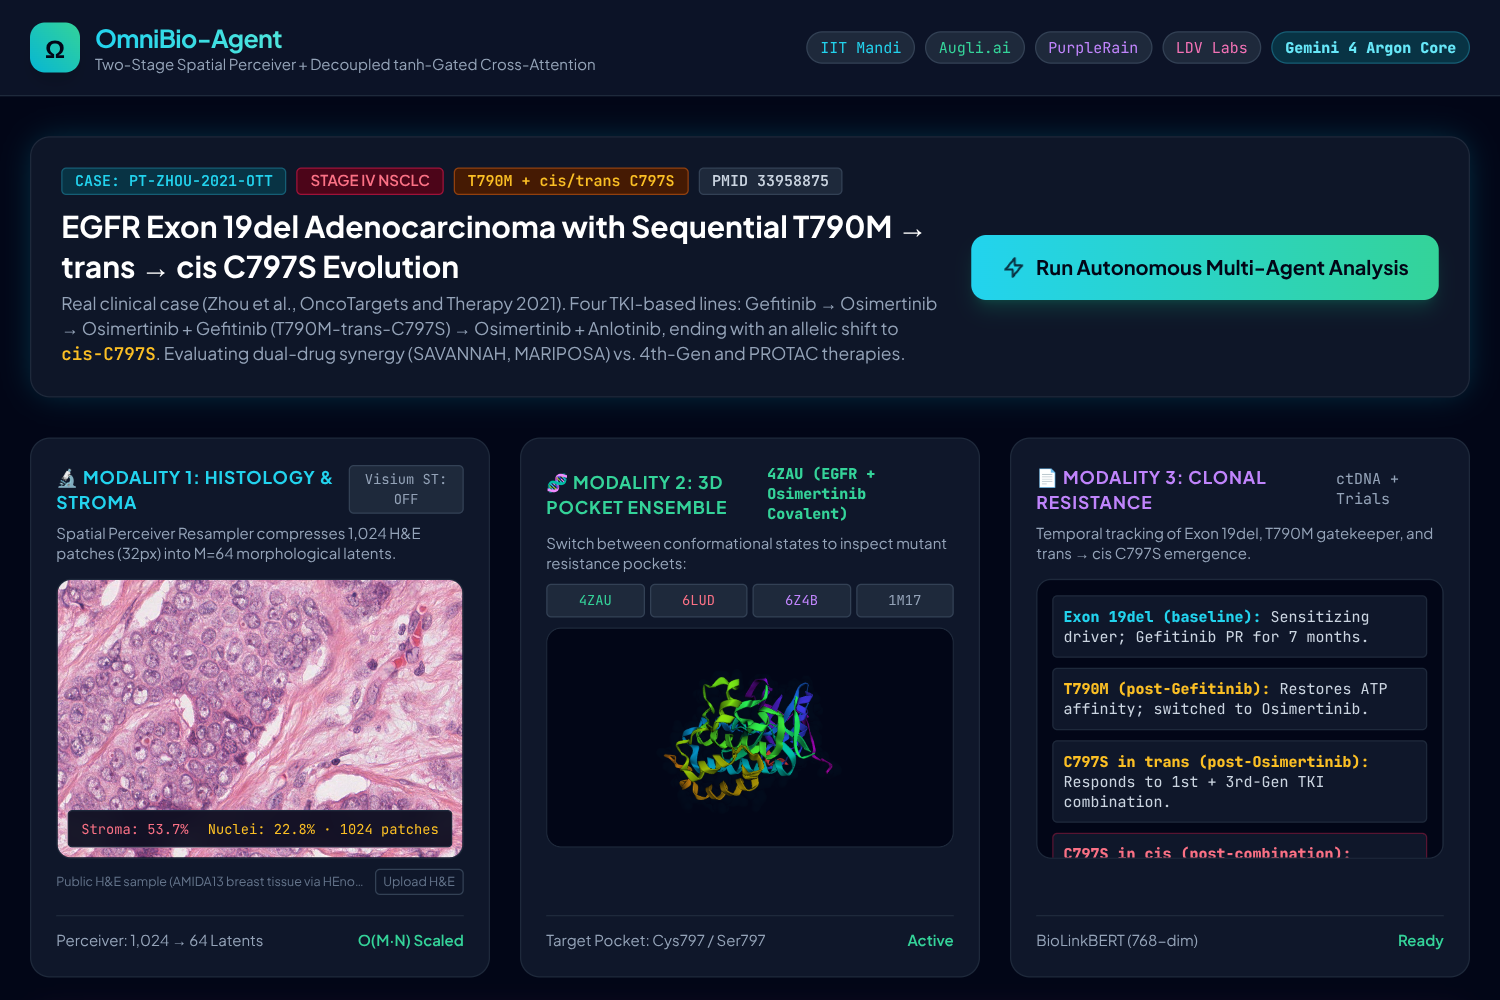
Every targeted therapy for EGFR-mutant lung cancer eventually stops working. We built OmniBio-Agent around one real, published patient (Zhou et al., OncoTargets and Therapy 2021, PMID 33958875): gefitinib worked for 7 months until T790M appeared, osimertinib worked for 10 months until C797S appeared, and once C797S moved onto the same allele as T790M (in cis), the combination therapy failed too.
The information needed to see that coming is spread across different modalities. The pathology slide shows how dense the tumour stroma is, the crystal structures show why a covalent drug loses its anchor at residue 797, and the sequencing shows which clone is winning. Standard tools look at one of these at a time. We wanted one screen where a clinician can see all three and get a drug ranking that explains itself.
What it does
OmniBio-Agent is a research copilot that ranks drug options for an EGFR-mutant lung cancer case after resistance appears.
- Histology: reads an H&E image as 1,024 patches, unmixes the stains, and measures stroma and nuclear fractions. Stroma drives a drug-penetration penalty.
- 3D structure: four real EGFR crystal structures (1M17 wild-type + erlotinib, 4ZAU + osimertinib, 6LUD triple mutant, 6Z4B allosteric EAI045) in an interactive 3D viewer.
- Genomics: the patient's clonal timeline and variant allele frequencies across four lines of therapy.
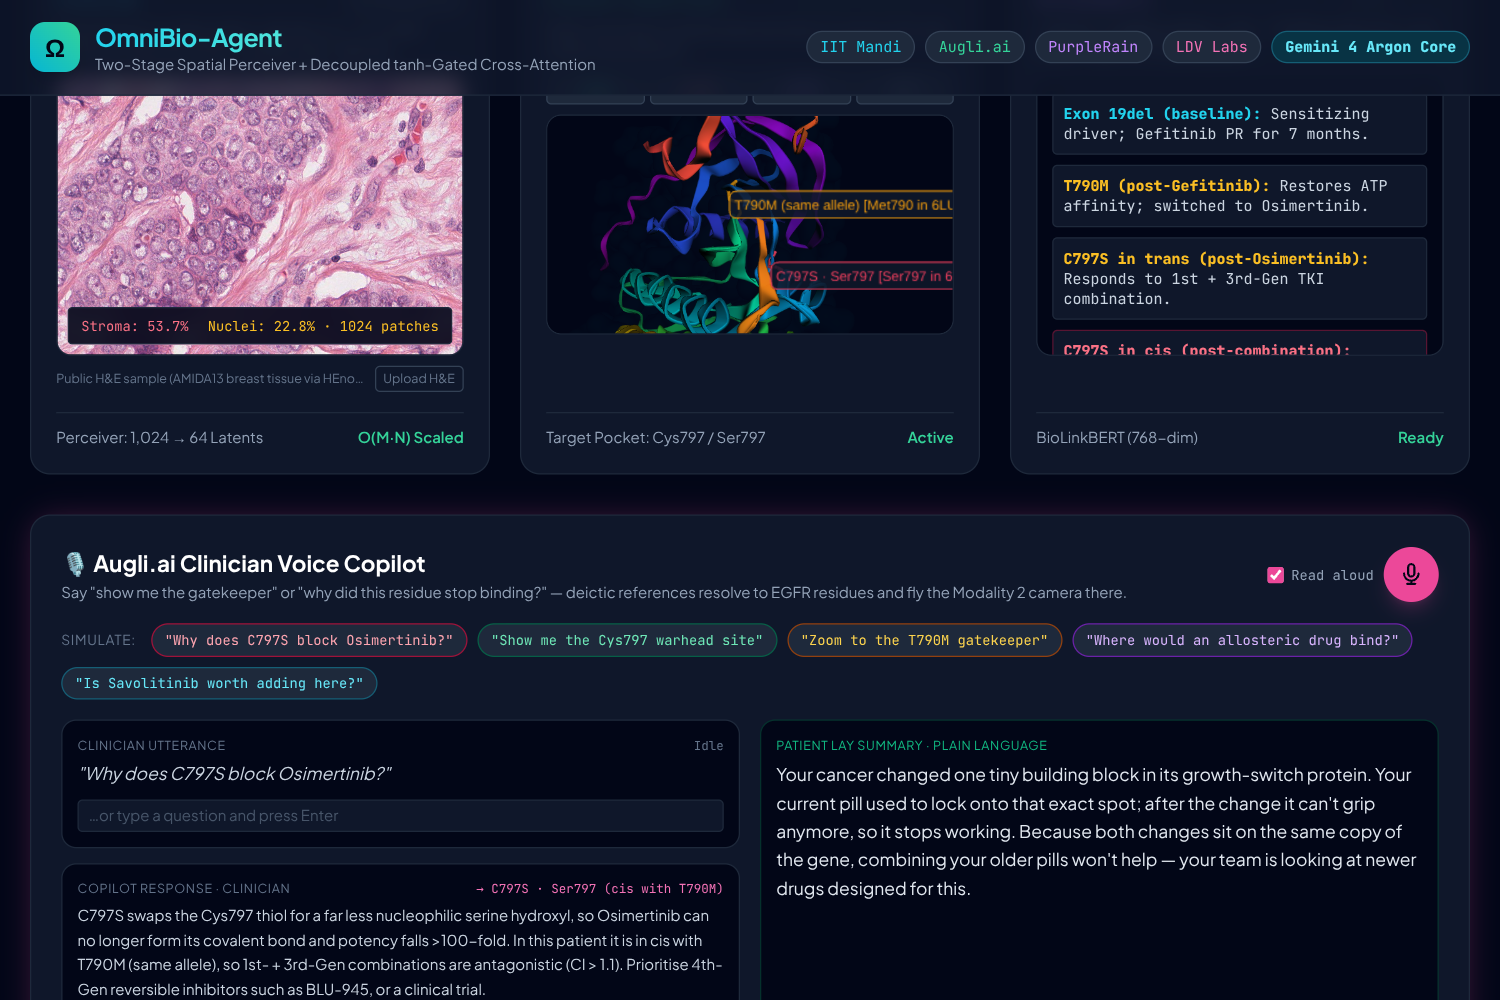
- Voice copilot: ask "Why does C797S block Osimertinib?" by voice or text, and the 3D camera flies to the residue you mean (Ser797 in 6LUD, Cys797 in 4ZAU). Every answer comes with a clinician version and a plain-language patient summary.
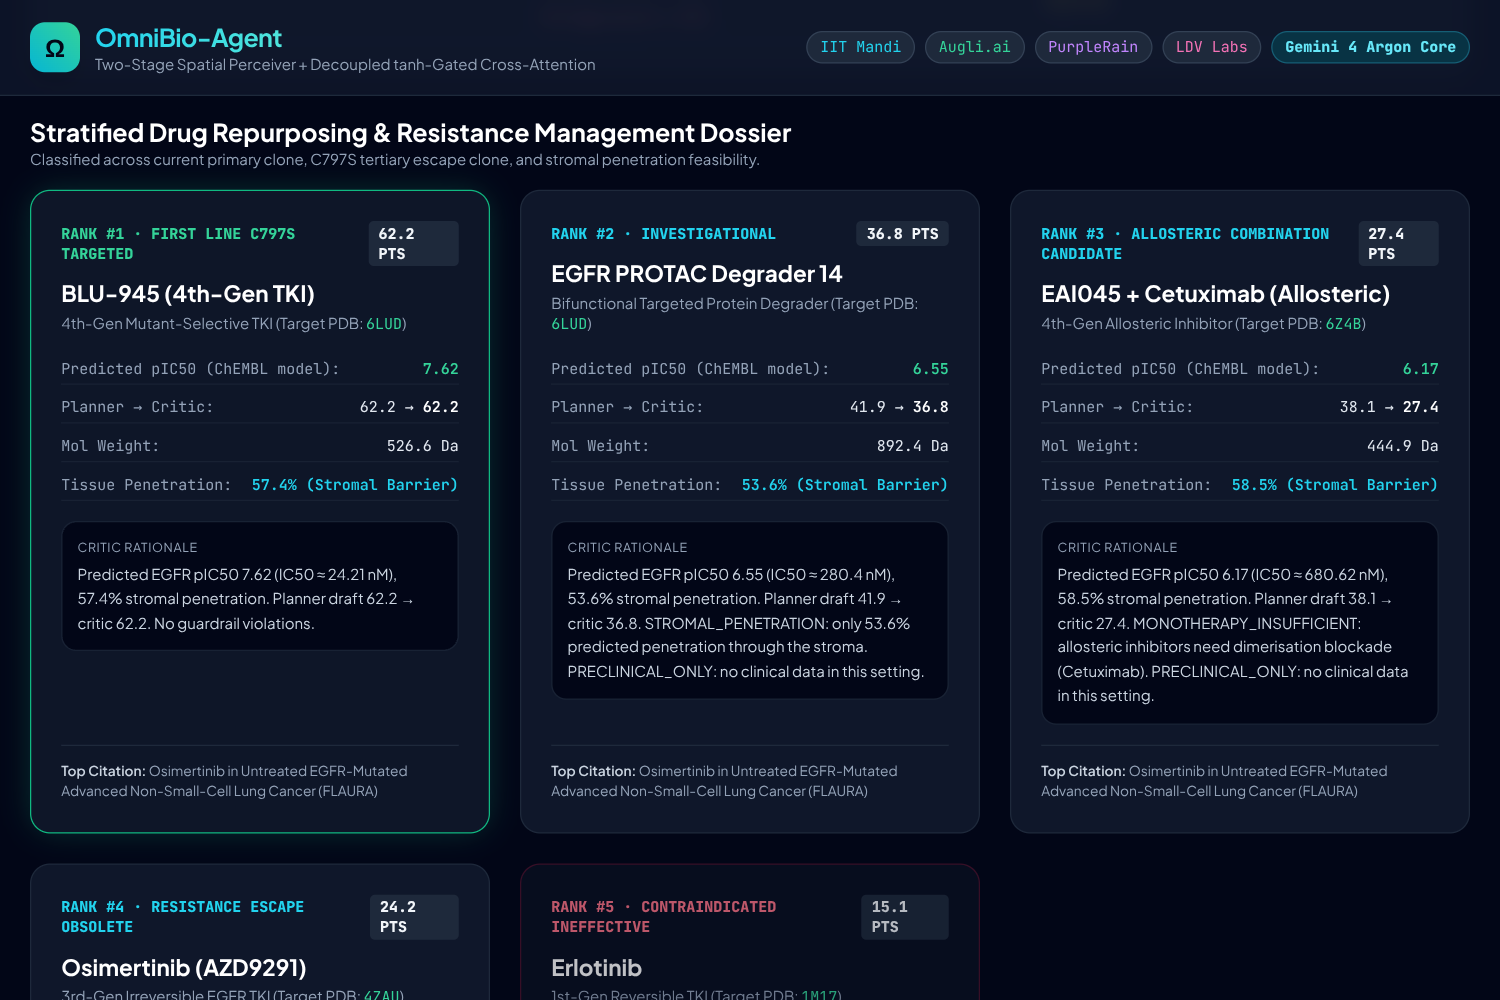
- Self-correcting agent loop: six agents (planner, tool executor, fusion, red-team critic, synergy, synthesis). The critic audits the planner's ranking against resistance rules and re-ranks until nothing changes. For this patient it converges in 3 passes, demotes osimertinib from 60.4 to 24.2, and ranks the 4th-generation inhibitor BLU-945 first.
- Combination synergy: Chou-Talalay combination indices for osimertinib + savolitinib, amivantamab + lazertinib and osimertinib + gefitinib.
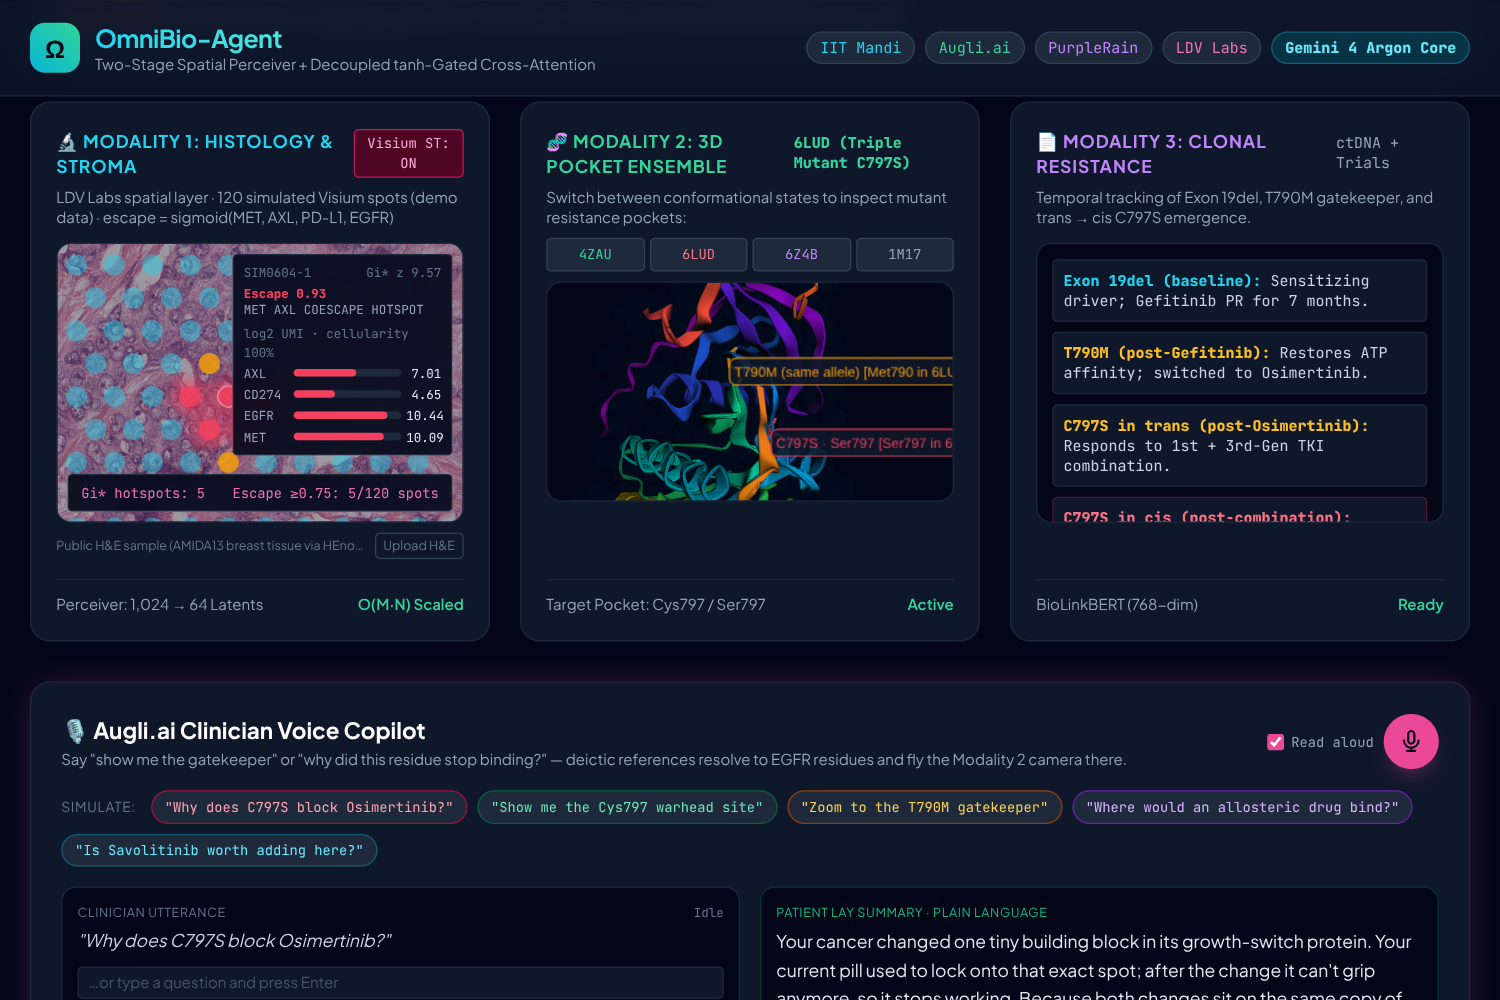
- Spatial layer: Visium-geometry spots over the H&E tile, with an escape score per spot and Getis-Ord hotspots that flag a MET-driven niche.
How we built it
The backend is Python + Flask with NumPy/SciPy; the frontend is a single page using Tailwind CSS, 3Dmol.js for the structures and the browser's Web Speech API for the voice copilot.
Fusion. Concatenating ~1,000 image patches with ~50 chemistry tokens drowns the chemistry signal in the softmax. We use a two-stage design. A Perceiver resampler compresses the \( N = 1024 \) patch tokens into \( M = 64 \) latents, so attention costs \( \mathcal{O}(M \cdot N) \) instead of \( \mathcal{O}(N^2) \). Clinical tokens then attend to the image latents and the chemistry tokens through separate, zero-initialised \( \tanh \) gates:
$$\tilde{H}{\text{clin}} = H{\text{clin}} + \tanh(\alpha_{\text{vis}})\,\mathrm{MHA}(H_{\text{clin}}, Z_{\text{vis}}) + \tanh(\alpha_{\text{chem}})\,\mathrm{MHA}(H_{\text{clin}}, X_{\text{chem}})$$
The fusion stack has 1.53 M parameters and runs in about 13 ms on a CPU.
Potency model. We trained a ridge regression on hashed SMILES n-grams using 5,568 EGFR IC50 measurements from ChEMBL. Five-fold cross-validation gives Pearson r = 0.743 and RMSE 0.94 pIC50, against 1.40 for a predict-the-mean baseline.
Synergy. For each drug we fit the median-effect equation \( f_a / f_u = (D / D_m)^m \), then compute the combination index at a given effect level:
$$CI = \frac{D_1}{(D_x)1} + \frac{D_2}{(D_x)_2}, \qquad (D_x)_i = D{m,i}\left(\frac{f_a}{1 - f_a}\right)^{1/m_i}$$
CI below 0.9 is synergy and above 1.1 is antagonism. We get 0.367 for osimertinib + savolitinib, 0.448 for amivantamab + lazertinib, and 1.192 (antagonistic) for osimertinib + gefitinib once C797S is in cis.
Spatial escape. Each spot gets \( s = \sigma(-8 + 0.9\,\mathrm{MET} + 0.6\,\mathrm{AXL} + 0.3\,\mathrm{CD274} - 0.4\,\mathrm{EGFR}) \) on log-scaled counts. Spots with Getis-Ord \( G_i^* \) z > 1.96 and \( s \geq 0.75 \) form hotspots. A MET-high hotspot changes the recommendation to "confirm MET amplification on tissue before adding savolitinib".
Agents. Calls to PubChem and PubMed go through a retry-then-fallback wrapper, and the trace reports which calls were live, retried or replaced by offline data. The red-team critic applies explicit guardrails (covalent anchor lost to C797S, T790M gatekeeper, stromal penetration, preclinical-only evidence) and loops until an audit finds no new violations.
Challenges we ran into
- Making it real instead of a mock-up. Our first version used random numbers for the fusion and hand-written verdicts. We replaced each of those with computed outputs, and removed every benchmark claim from our README that no code in the repo produces.
- Residue numbering. The older 1M17 structure numbers EGFR residues differently from 4ZAU and 6LUD, so "show me Cys797" pointed at the wrong place until we added an automatic offset.
- A 3D viewer bug. Calling 3Dmol's
animate()replays trajectory frames and wiped our single-frame structures, which broke every voice-driven camera flight. We replaced it with a throttled idle rotation. - Unreliable external APIs. PubChem and PubMed time out often enough during a live demo that we built the self-healing wrapper, so the pipeline never stalls.
- Data that doesn't exist. Trials don't publish combination indices, and paired slide + genotype + drug-response data isn't public, so parts of the demo use illustrative inputs (listed below).
Accomplishments that we're proud of
- An end-to-end pipeline that runs offline in about 0.4 s, with 10 unit tests covering the maths and the agent loop.
- A critic loop whose every correction is visible, so a clinician can see why a drug moved.
- Answers written twice, once for the clinician and once for the patient.
What we learned
- Tissue context matters for drug choice. Binding affinity is biochemical, but delivery is governed by the stroma, which is why the ~890 Da PROTAC gets penalised.
- Random-split cross-validation flatters a potency model. A scaffold split would be harsher, so we treat r = 0.74 as an upper bound for new chemical series.
- Being explicit about what is real and what is simulated made the project easier to explain, not harder.
What's next
- Train the fusion model with masked-modality pretraining, using EGFR genotype as the bridge between slides and drug response.
- Run on whole-slide images instead of a single tile.
- Plug in real Visium exports and measured combination screens; the same code then produces real escape maps and real CIs.
What is real and what is illustrative
The patient timeline, mutations and trial results are from published sources. The potency model is trained on real ChEMBL data, and the four structures are real PDB entries. The H&E tile is a public breast-tissue sample (AMIDA13), not this patient's biopsy. The fusion weights are untrained, the Visium spots are simulated, and the dose-response inputs for the CIs are illustrative. The demo video uses a synthetic voice. OmniBio-Agent is a research prototype and is not for clinical use.
Data credits: ChEMBL via TeachOpenCADD T001 (CC BY 4.0), AMIDA13 sample from HEnorm_python (MIT), RCSB PDB entries 1M17, 4ZAU, 6LUD and 6Z4B.

Log in or sign up for Devpost to join the conversation.