Inspiration
I recently had a project idea about machine learning to predict Olympic outcomes, so I decided to start from somewhere.
What it does
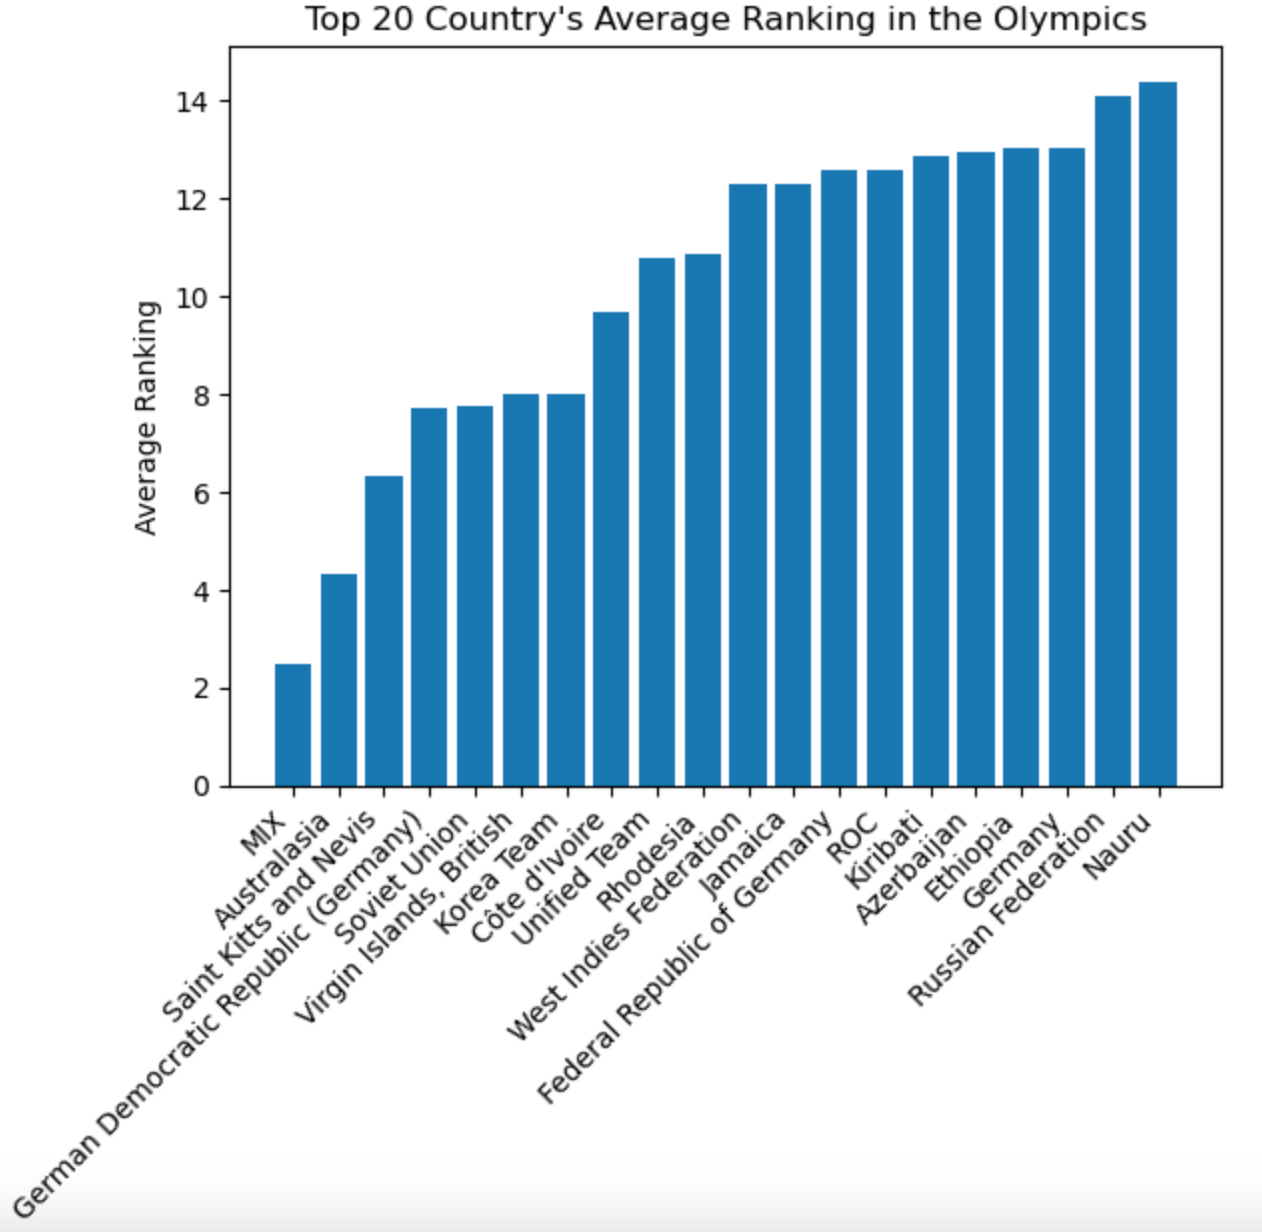
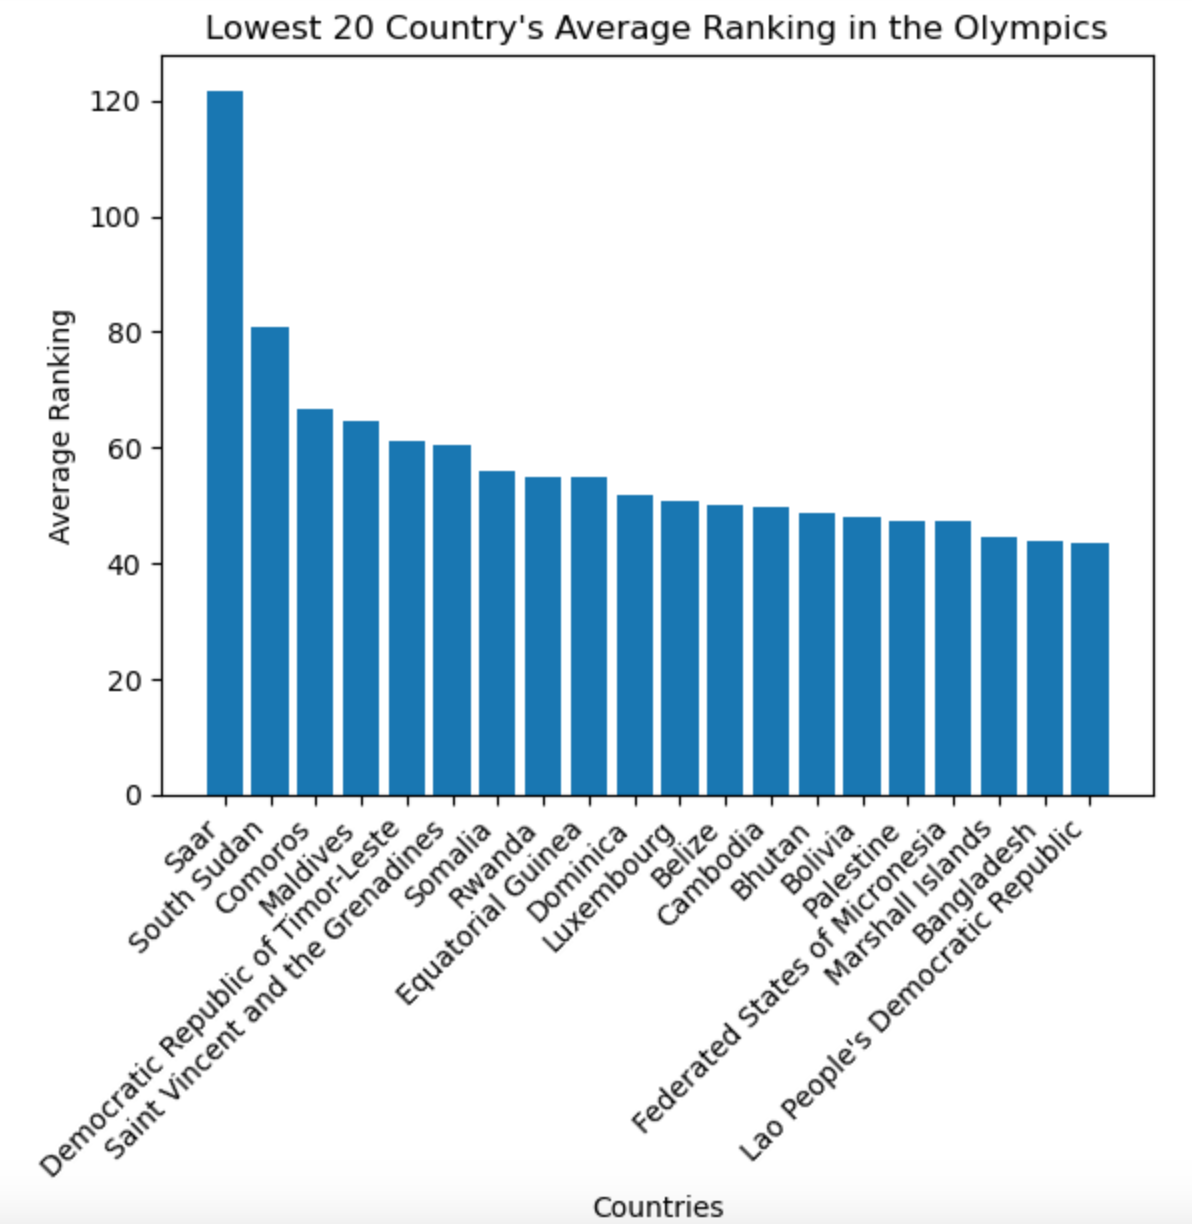
Reads a csv file, understands the shape of the dataset, retrieves unique countries and how many there are, how many different games there are, the average ranking of Turkey in the Olympics. Lastly I plotted the top 20 and lowest 20 countries via their average rankings. A bar graph is probably not the best way to visualize such a concept, but this is a starting point.
How we built it
I used Jupyter Notebook.
Challenges we ran into
I wasn't sure how to express some syntax-related issues, so I looked at the "pandas" documentation.
Accomplishments that we're proud of
I believe I'm starting to understand the basics of data exploration.
What we learned
Plotting and reading data.
What's next for Olympics Data Exploration
I want to implement machine learning to determine Turkey's win rate in the 2028 Olympics.
Built With
- jupyter-notebook
- kaggle
- python
