Inspiration
OilWatch was inspired by our interest in environmental protection, public communication, and practical technology. A big part of that came from what we learned through speech and debate. Researching environmental policy and biodiversity collapse made it clear to us that ecological damage is rarely isolated. Once ecosystems are disrupted, the effects spread through food chains, coastlines, local economies, and communities. Oil spills stood out as a clear example of that chain reaction, so we wanted to build something that made the risks easier to understand and respond to.
What it does
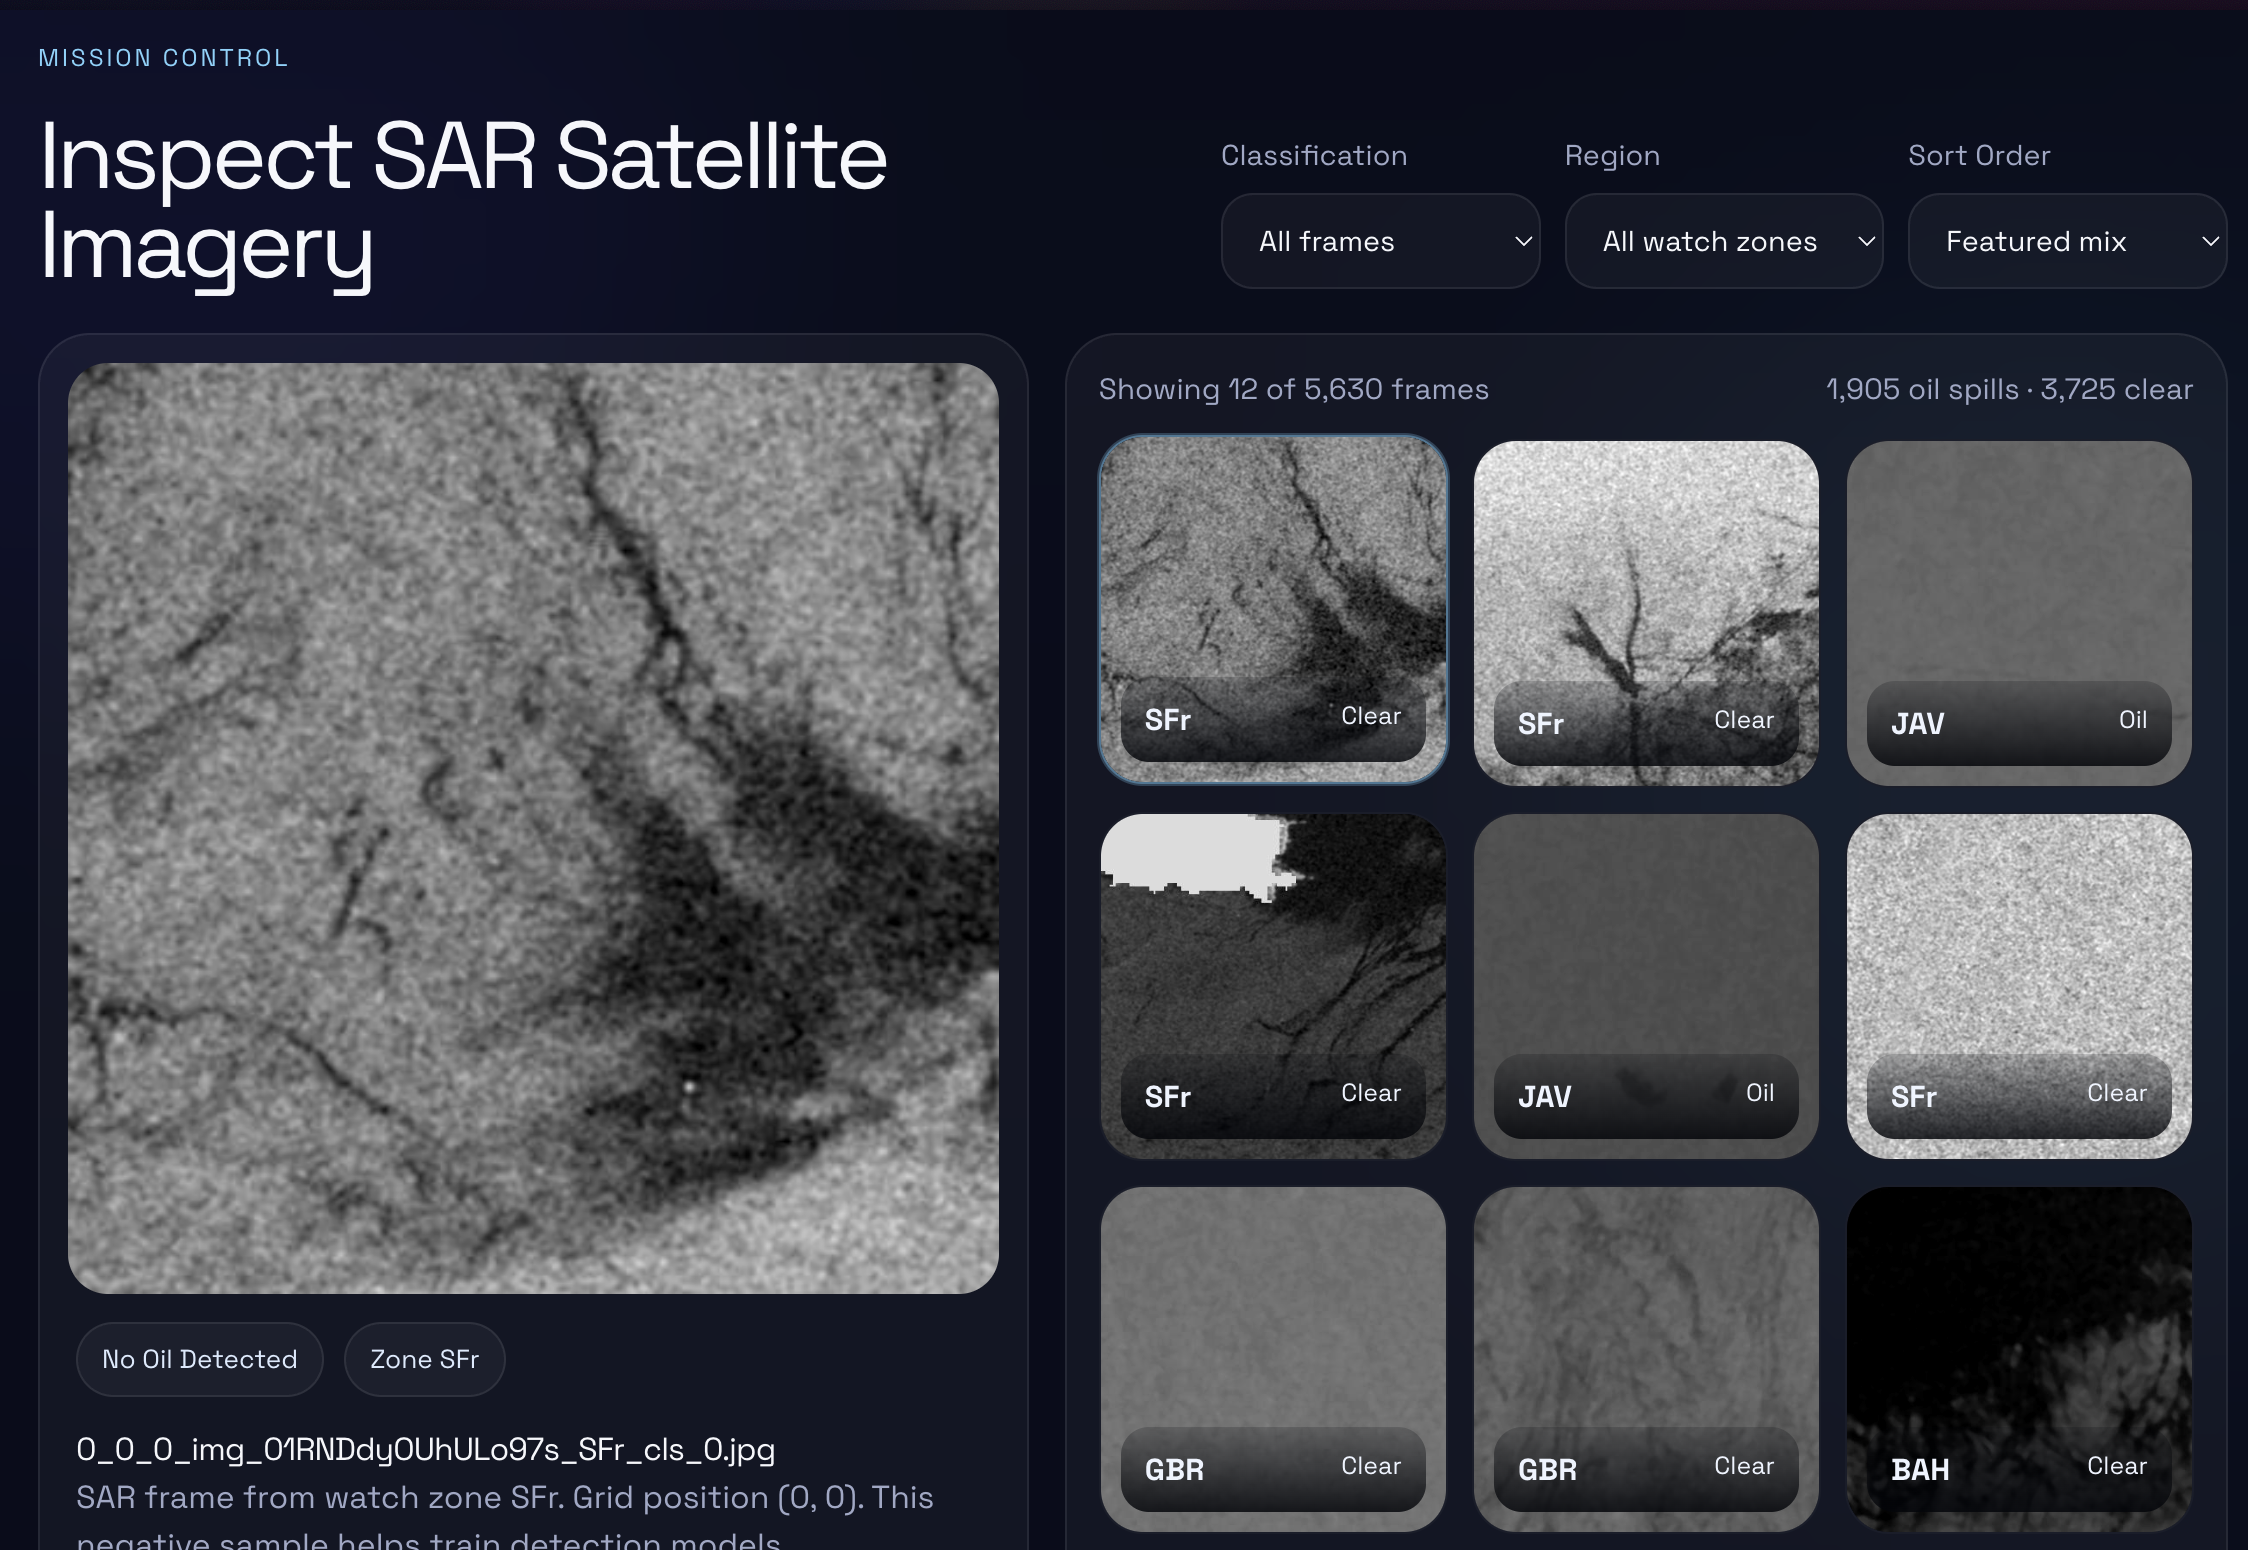
OilWatch is a web platform focused on oil spill awareness, detection, and navigation safety. It brings together several tools in one place:
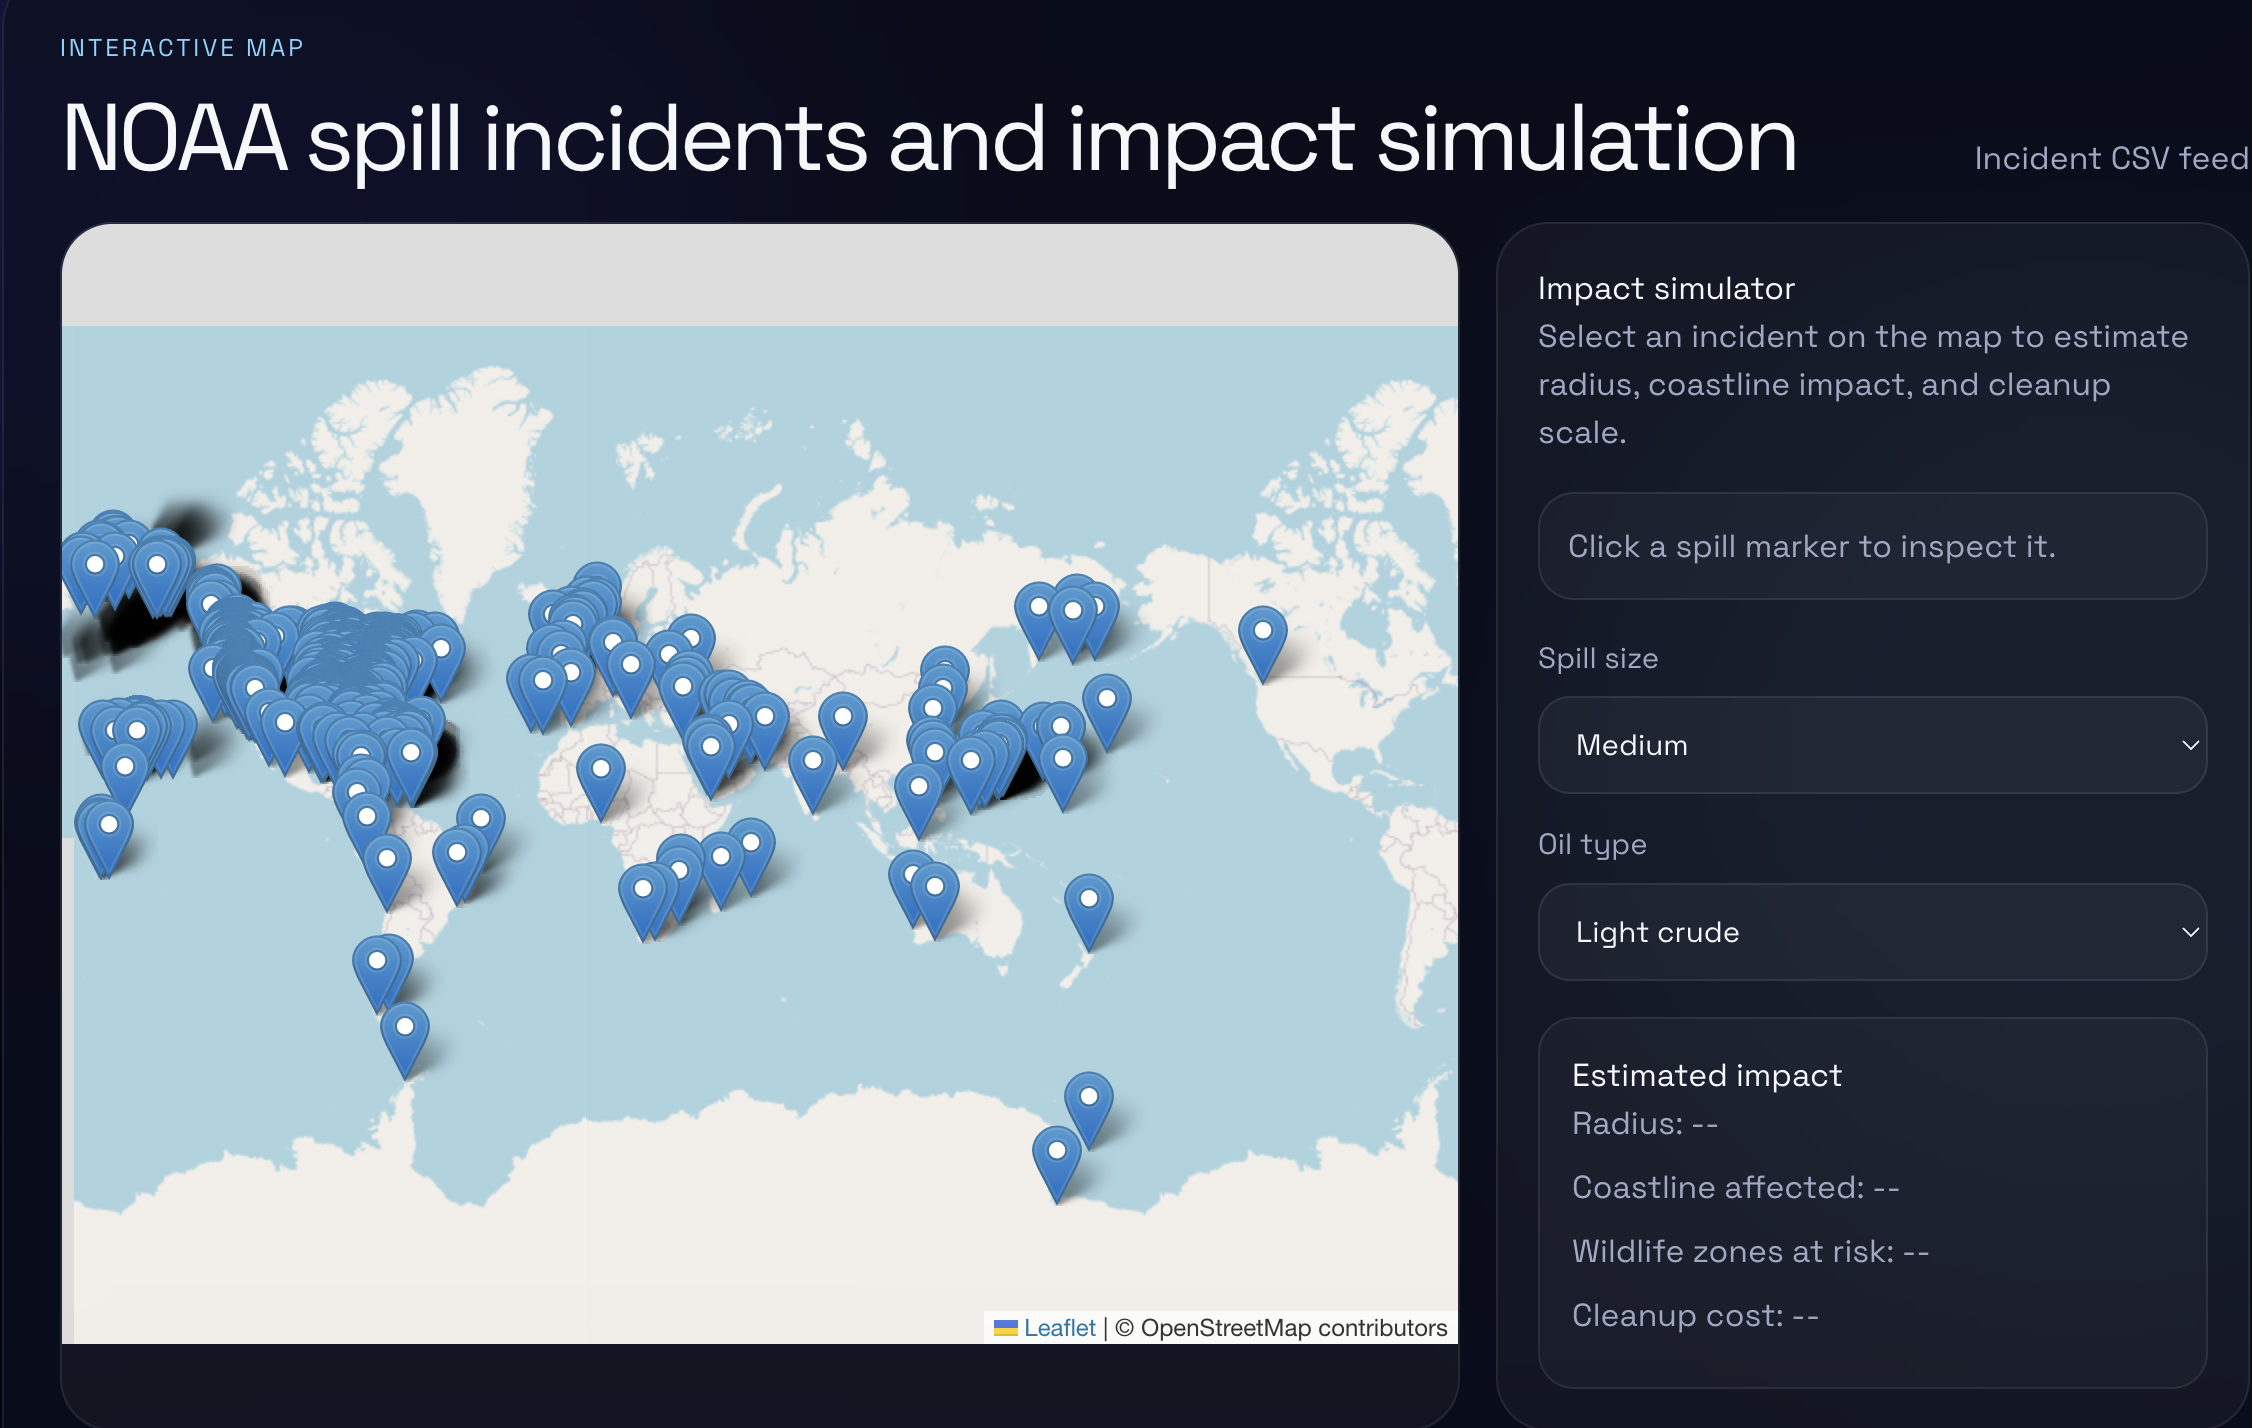
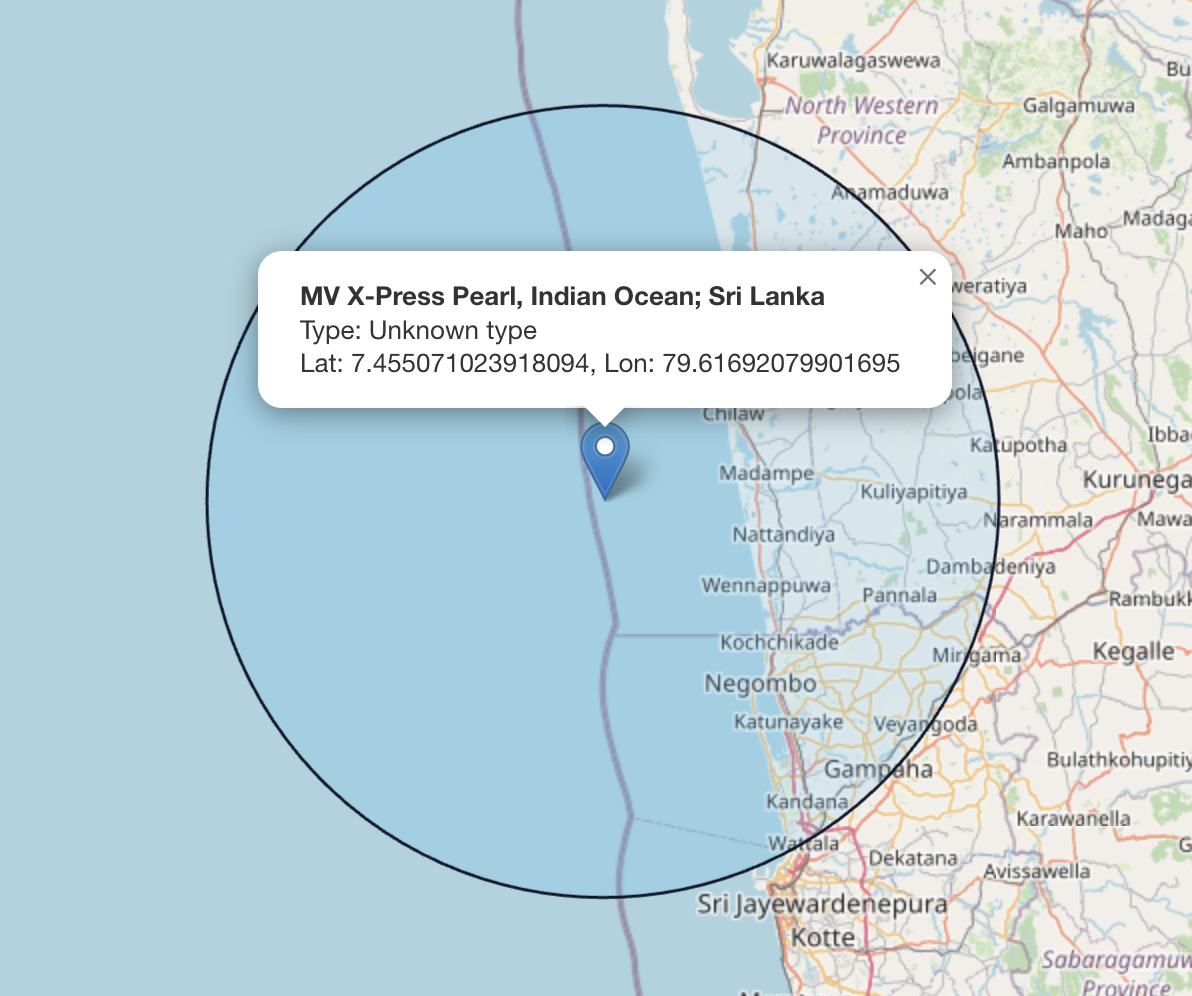
SAR satellite imagery exploration for oil spill detection Spill analytics from structured CSV data An interactive incident map with impact simulation Cerulean Navigator, a route-planning tool that helps vessels avoid spill hazards by suggesting safer waypoint detours The goal is to make oil spill data more understandable and more useful, whether the user is thinking about environmental impact, detection, or maritime safety.
How we built it
We built OilWatch as a React and TypeScript website. We combined multiple types of data and experiences into one platform:
Sentinel-1 SAR image data for satellite-based spill detection Structured CSV spill records for signal-based analytics Incident-based mapping for real-world spill events Route-planning logic for safer vessel navigation around hazards We also focused heavily on the user experience so that the site would feel like a real product rather than just a collection of datasets.
Challenges we ran into
One of our biggest challenges was making very different datasets work together in a coherent way. Satellite imagery, incident mapping, and tabular analytics all tell different parts of the story, but they do not naturally fit together. We had to think carefully about navigation, page design, and how much information to show without overwhelming the user.
Another challenge was shifting the project from being “just a dataset viewer” into something more meaningful and product-focused. We wanted OilWatch to feel useful, interactive, and practical.
Accomplishments that we're proud of
We’re proud that OilWatch became a multi-part platform instead of a single demo page. It includes:
A satellite imagery explorer A structured analytics page An interactive spill map A maritime routing tool We’re especially proud of Cerulean Navigator because it turns spill information into something actionable by helping users think about safer routing and operational risk.
What we learned
We learned that building a good environmental technology product is not just about data or model inputs. It is also about communication, clarity, and usability. A tool can have strong data behind it, but if users cannot understand it or act on it, it loses value.
We also learned how important it is to connect technical work back to real-world environmental stakes. The more we worked on OilWatch, the more we saw how closely detection, policy, ecology, and public awareness are tied together.
What's next for OilWatch
Next, we want to make OilWatch more advanced and more realistic by adding:
Live spill feeds Stronger geospatial mapping Better route overlays Real spill polygons instead of approximate hazard zones Improved forecasting and trajectory modeling Smarter navigator briefings for maritime users Our long-term goal is to make OilWatch more useful for awareness, education, and practical environmental decision-making.
Competitors
Some of the platforms and services operating in similar spaces include:
SkyTruth Cerulean EMSA CleanSeaNet KSAT Oil Spill Detection Service Miros Oil Spill Detection

Log in or sign up for Devpost to join the conversation.