-
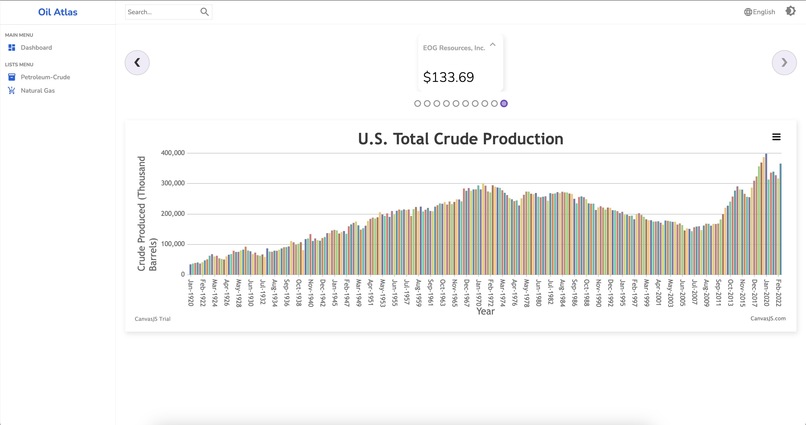
dashboard with generic Petroleum production from 1920 to present

Inspiration
Data visualization experience
What it does
Collects data from an API and visualizes it to a dashboard
How we built it
Using the admin portal as a template, then we plugged in our API and modified the existing tables
Challenges we ran into
Merging the API and creating some sort of redundancy so as to not rely on a singular point of data collection
Accomplishments that we're proud of
Running python script in java to parse and create JSON files from .xls/.xlsx and using that to create a chart to represent the data. And attempting to connect our API to the same
What we learned
Dynamic API calls are a nightmare to generate
What's next for OilAtlas
Better connecting the stocks API to follow trends and correlate to the oil production. Collect more data from the API and later report on it. Modify the way we collect user input to make it easier to access and understand.

Log in or sign up for Devpost to join the conversation.