Inspiration
We were inspired by the ConocoPhillips challenge.
What it does
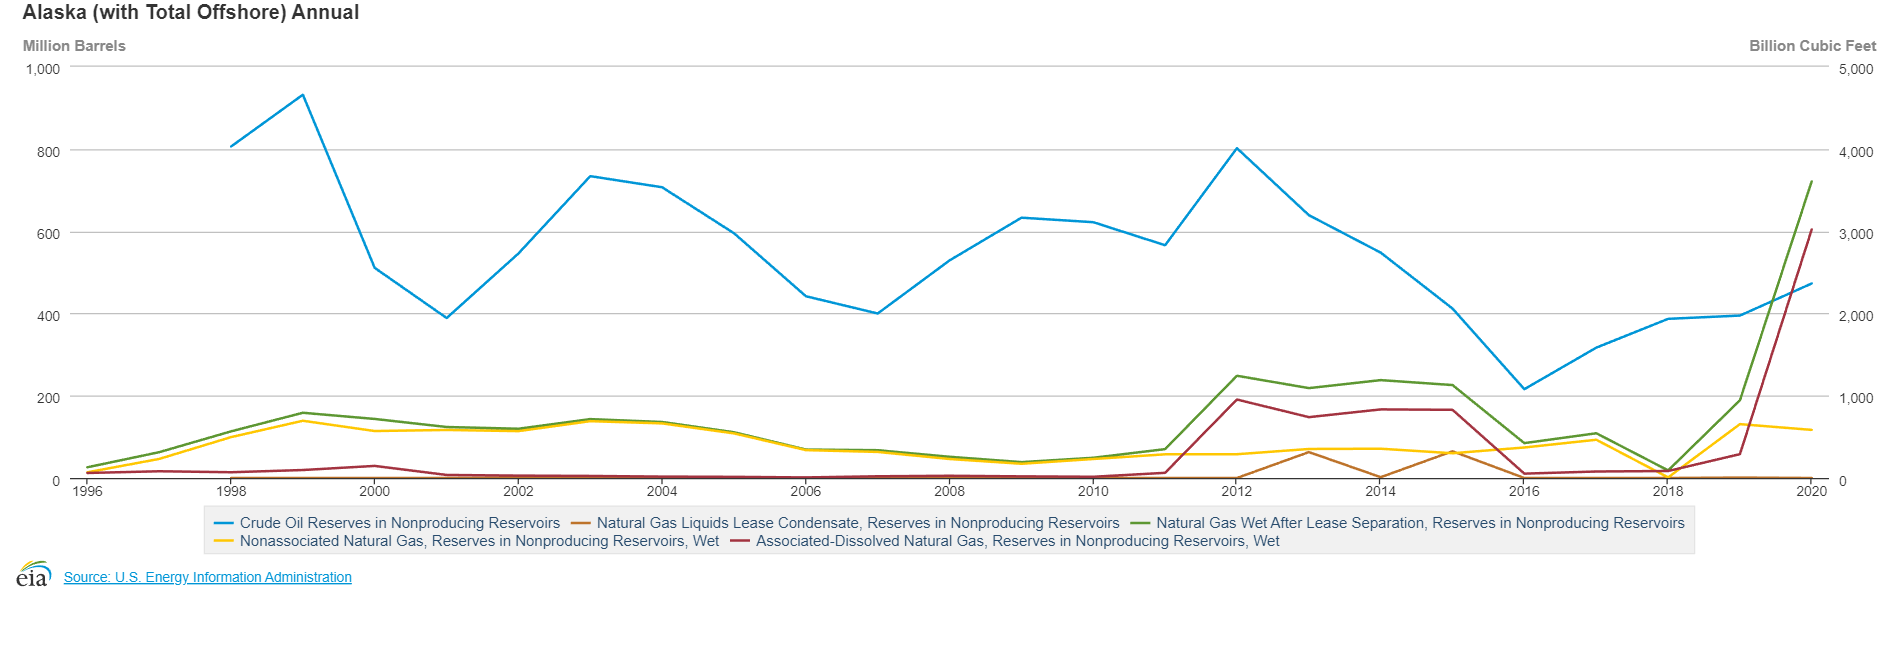
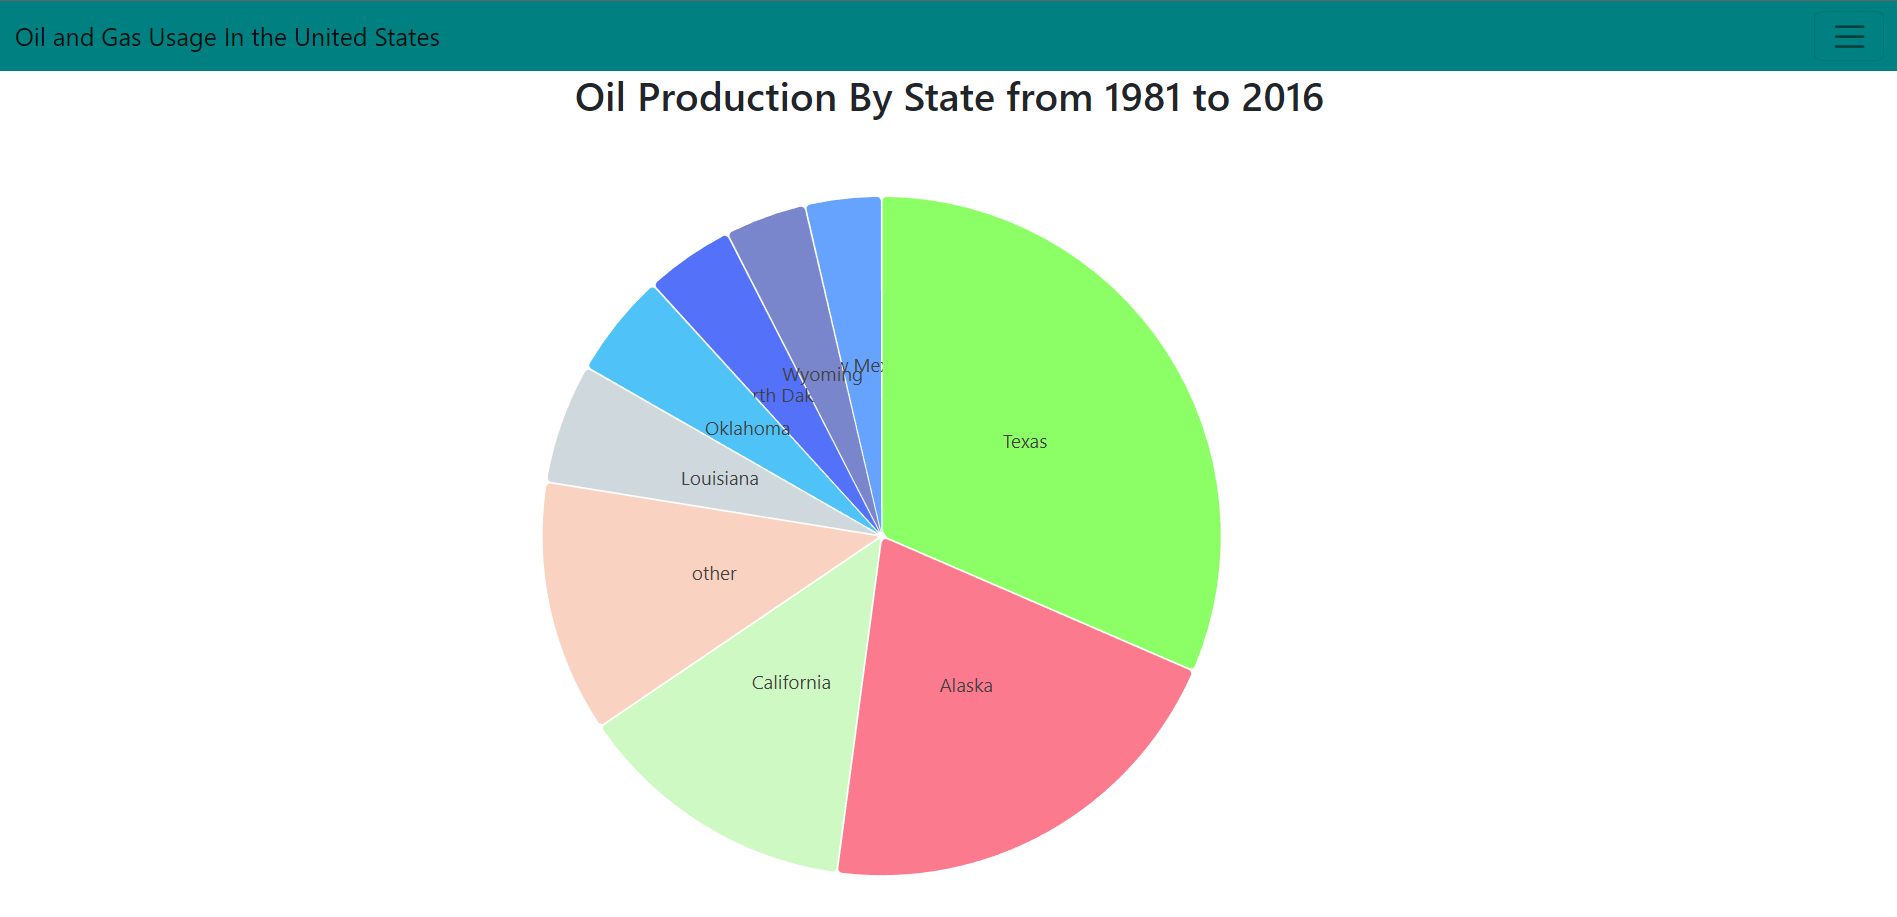
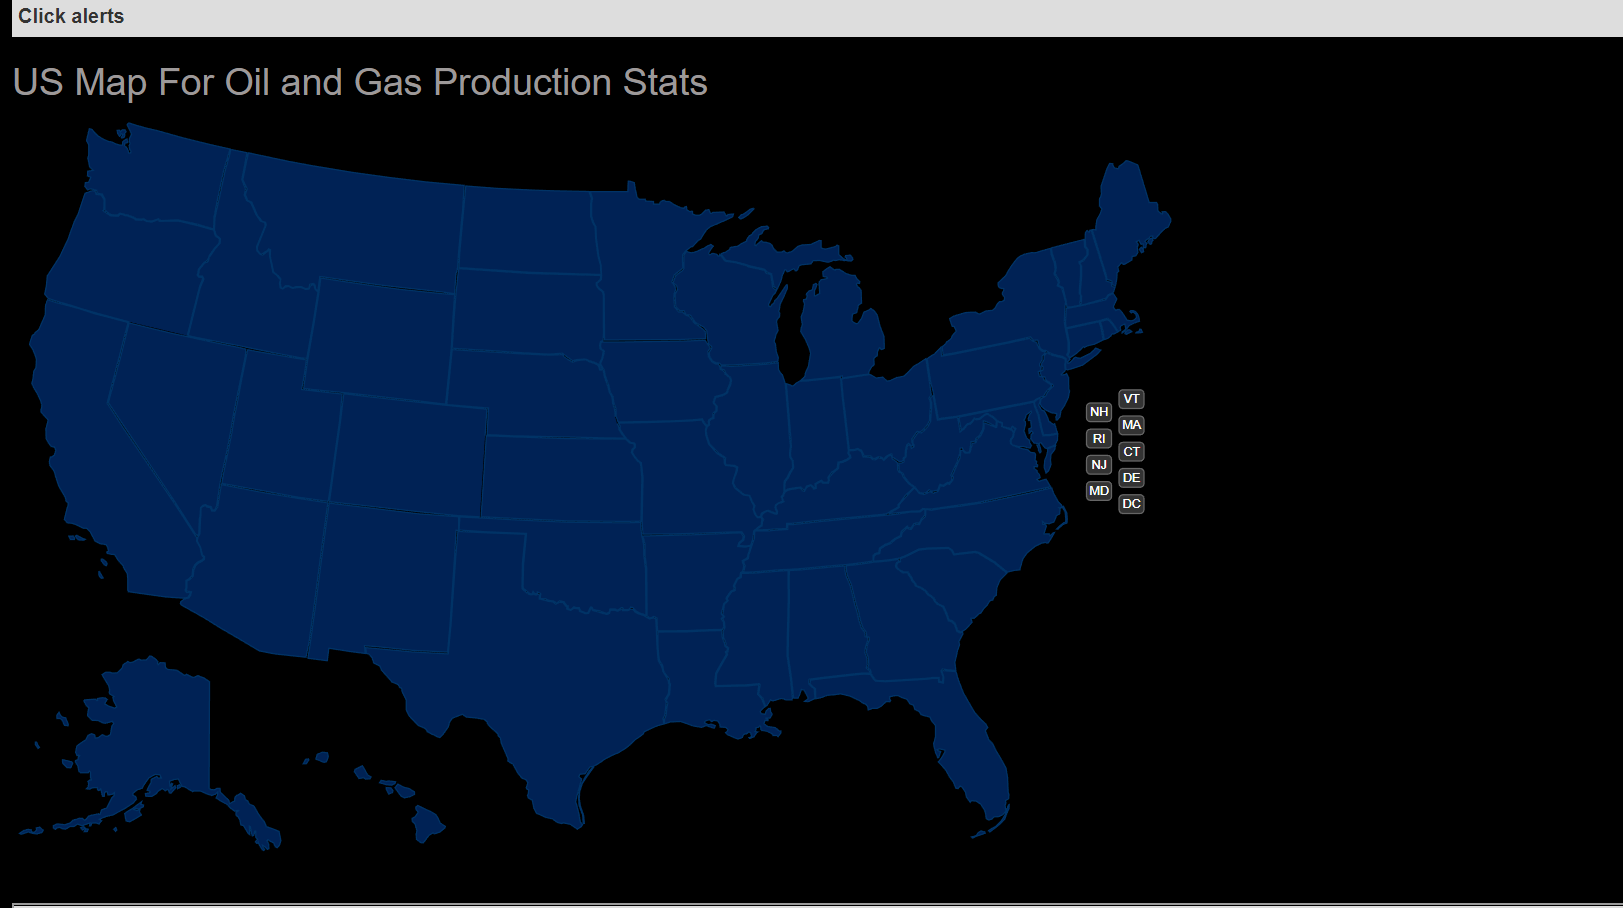
Using data, our project categorizes it and plots it into different data visualizations.
How we built it
We built our project using HTML, CSS, Javascript and React.
Challenges we ran into
When using react, most of our HTML files would not work with it, so we had to alter many things in order to make this work.
Accomplishments that we're proud of
We are proud to have visualized the data in a consumable manner.
What we learned
We learned more about React, Git, CSS, and HTML.
What's next for Oil and Gas Usage in the United States
At the current rate, the use of natural gas and oil is unsustainable. New technologies must be developed in order to either find more oil reserves, or transition to more long-term solutions for resources.

Log in or sign up for Devpost to join the conversation.