Inspiration
Wellbeing goes beyond GDP — it’s about health, satisfaction, and opportunity. With OECD’s rich dataset, we wanted to make global wellbeing trends easy to explore and compare interactively.
What it does
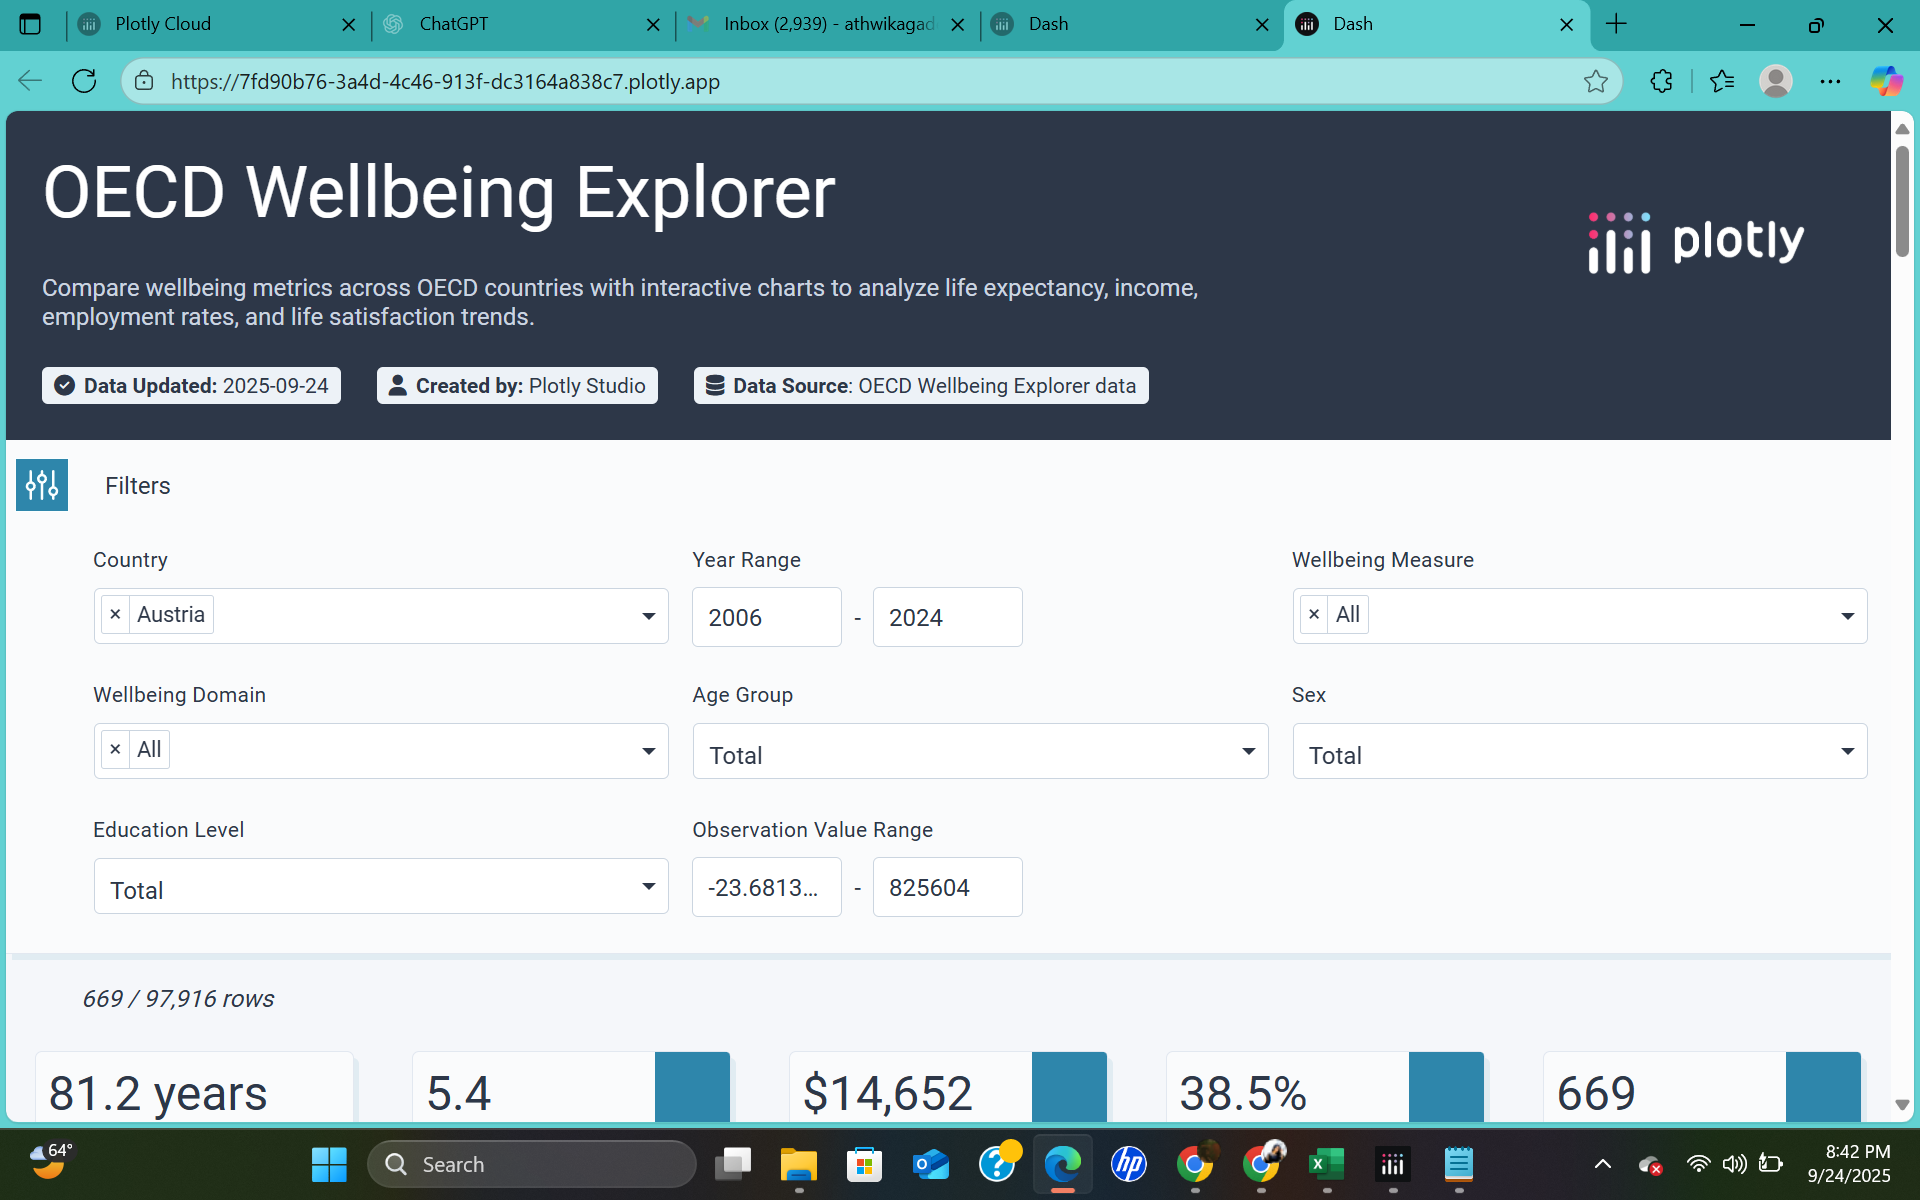
The OECD Wellbeing Explorer is an interactive dashboard that allows users to:
Filter by country, year, domain, and demographics
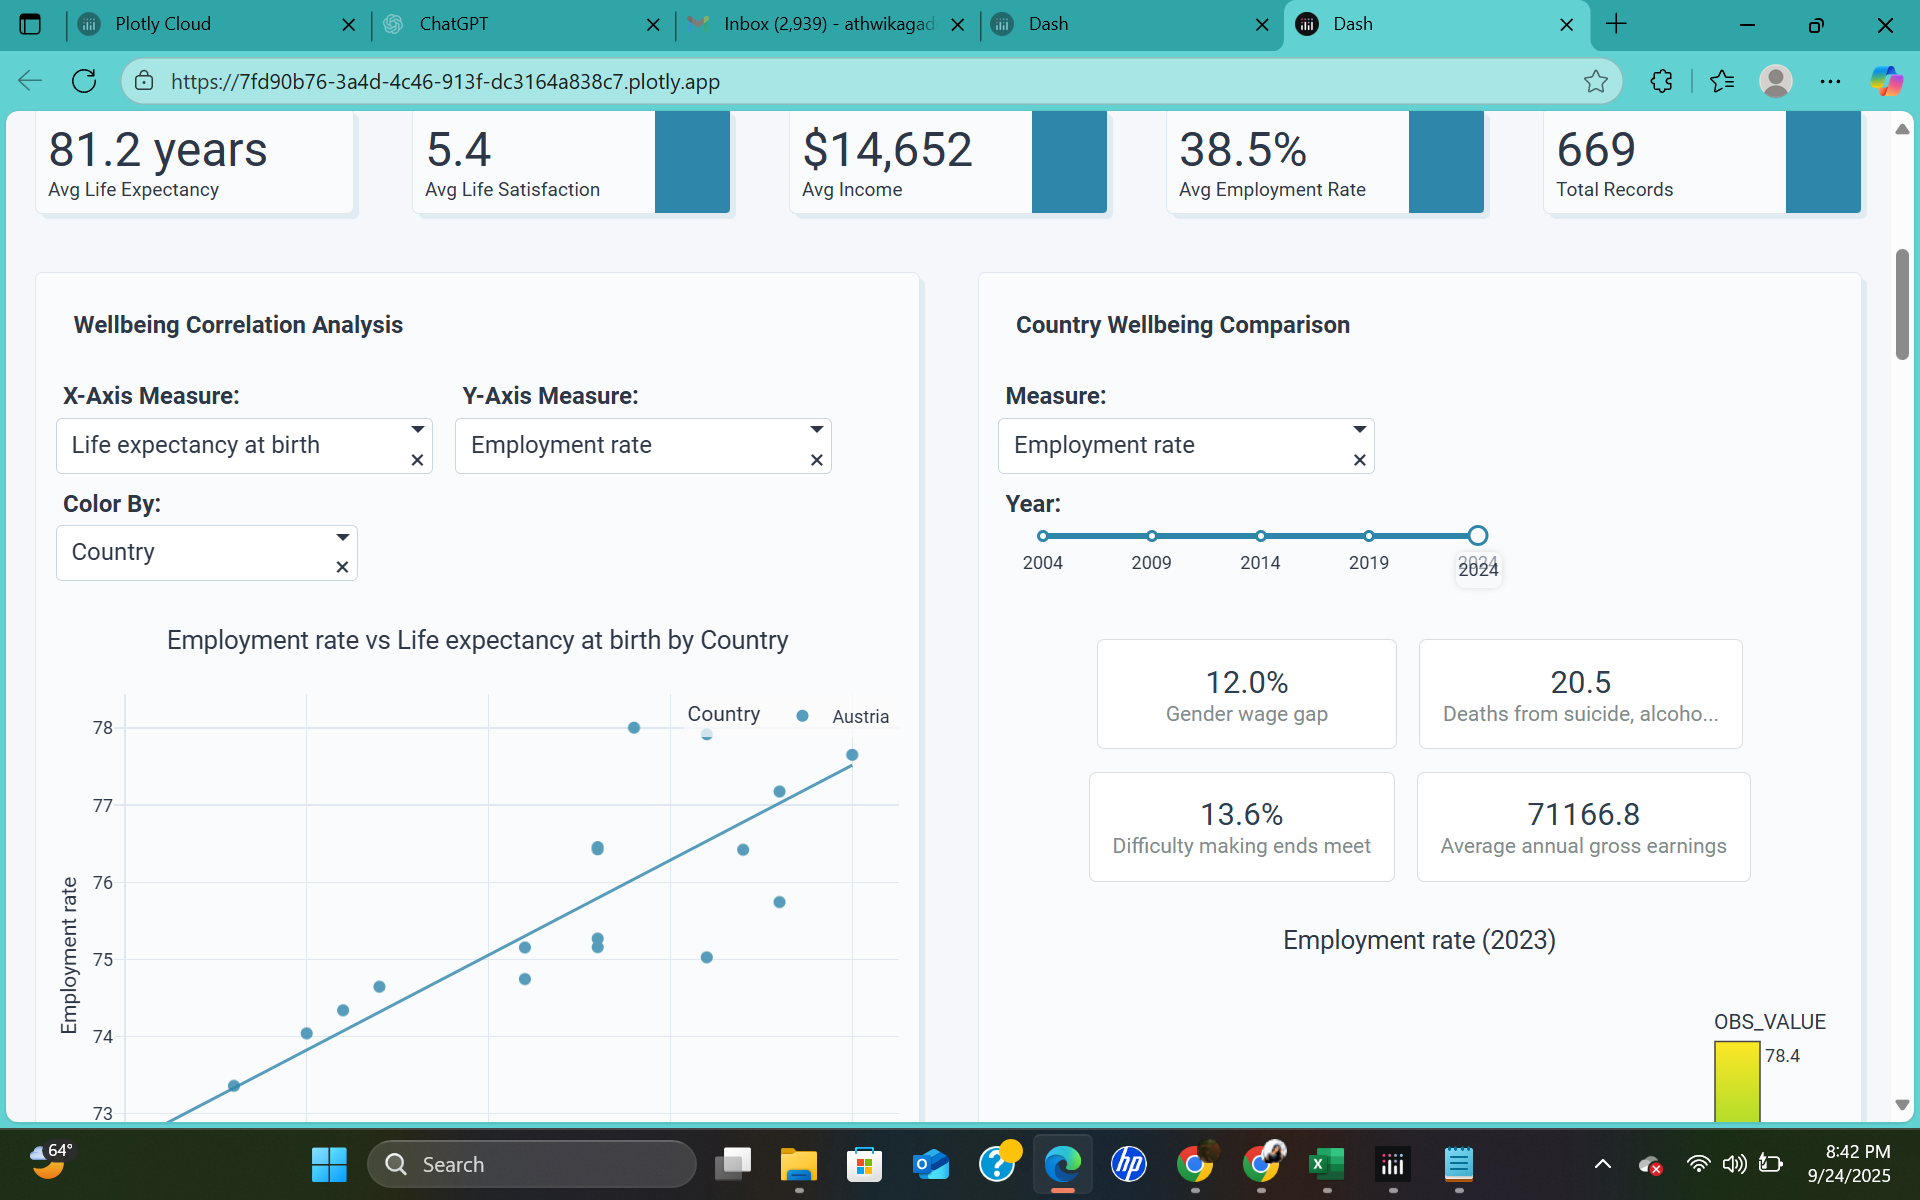
Compare life expectancy, income, employment, and life satisfaction
View global KPIs, scatter plots, choropleth maps, and time-series trends
Read dynamic insights highlighting top, bottom, and surprising patterns
How we built it
Built in Plotly Studio using the official OECD Wellbeing dataset
Designed filters and KPI cards to highlight core wellbeing measures
Added visualizations (scatter, choropleth, line charts) for multiple perspectives
Used AI-assisted editing in Plotly Studio to refine layouts and insights
Challenges we ran into
The default templates used unrelated “factory defect” fields, so we had to carefully remap every filter and chart to the OECD dataset.
Creating a dynamic “Indicator” filter that switches between Life Expectancy, Income, Employment, and Satisfaction required multiple adjustments.
Balancing interactivity with clarity — too many charts can overwhelm users.
Accomplishments that we're proud of
Successfully transformed a complex dataset into a clean, interactive app.
Added meaningful auto-generated insights that tell stories beyond raw data.
Published and shared a working app on Plotly Cloud that anyone can explore.
What we learned
How to leverage Plotly Studio’s AI effectively (generate once, refine with edits).
The importance of data storytelling — judges and users connect with insights, not just numbers.
Designing dashboards is as much about clarity and aesthetics as technical setup.
What's next for OECD Wellbeing Explorer
Expand with more wellbeing domains (safety, education, environment).
Add gender/education breakdowns to explore inequality.
Enable multi-country comparisons in one view.
Enhance insights with natural language generation for automated storytelling.

Log in or sign up for Devpost to join the conversation.