Inspiration
What it does
How we built it
Inspiration
As an AI freelancer who has spent years writing Python code for data visualization, I've always believed that powerful analytics required deep technical expertise. When I discovered the Plotly Analytics Vibe-a-Thon, I saw an opportunity to challenge that assumption.
Urban green spaces have always fascinated me - they represent the intersection of environmental policy, public health, and quality of life. With climate change and rapid urbanization threatening our cities, understanding which nations prioritize green spaces isn't just interesting data - it's essential for our future.
This was my first time using a no-code platform. As someone who typically reaches for Pandas, Matplotlib, and hours of debugging, the idea of building a comprehensive dashboard through conversation felt almost too good to be true.
What It Does
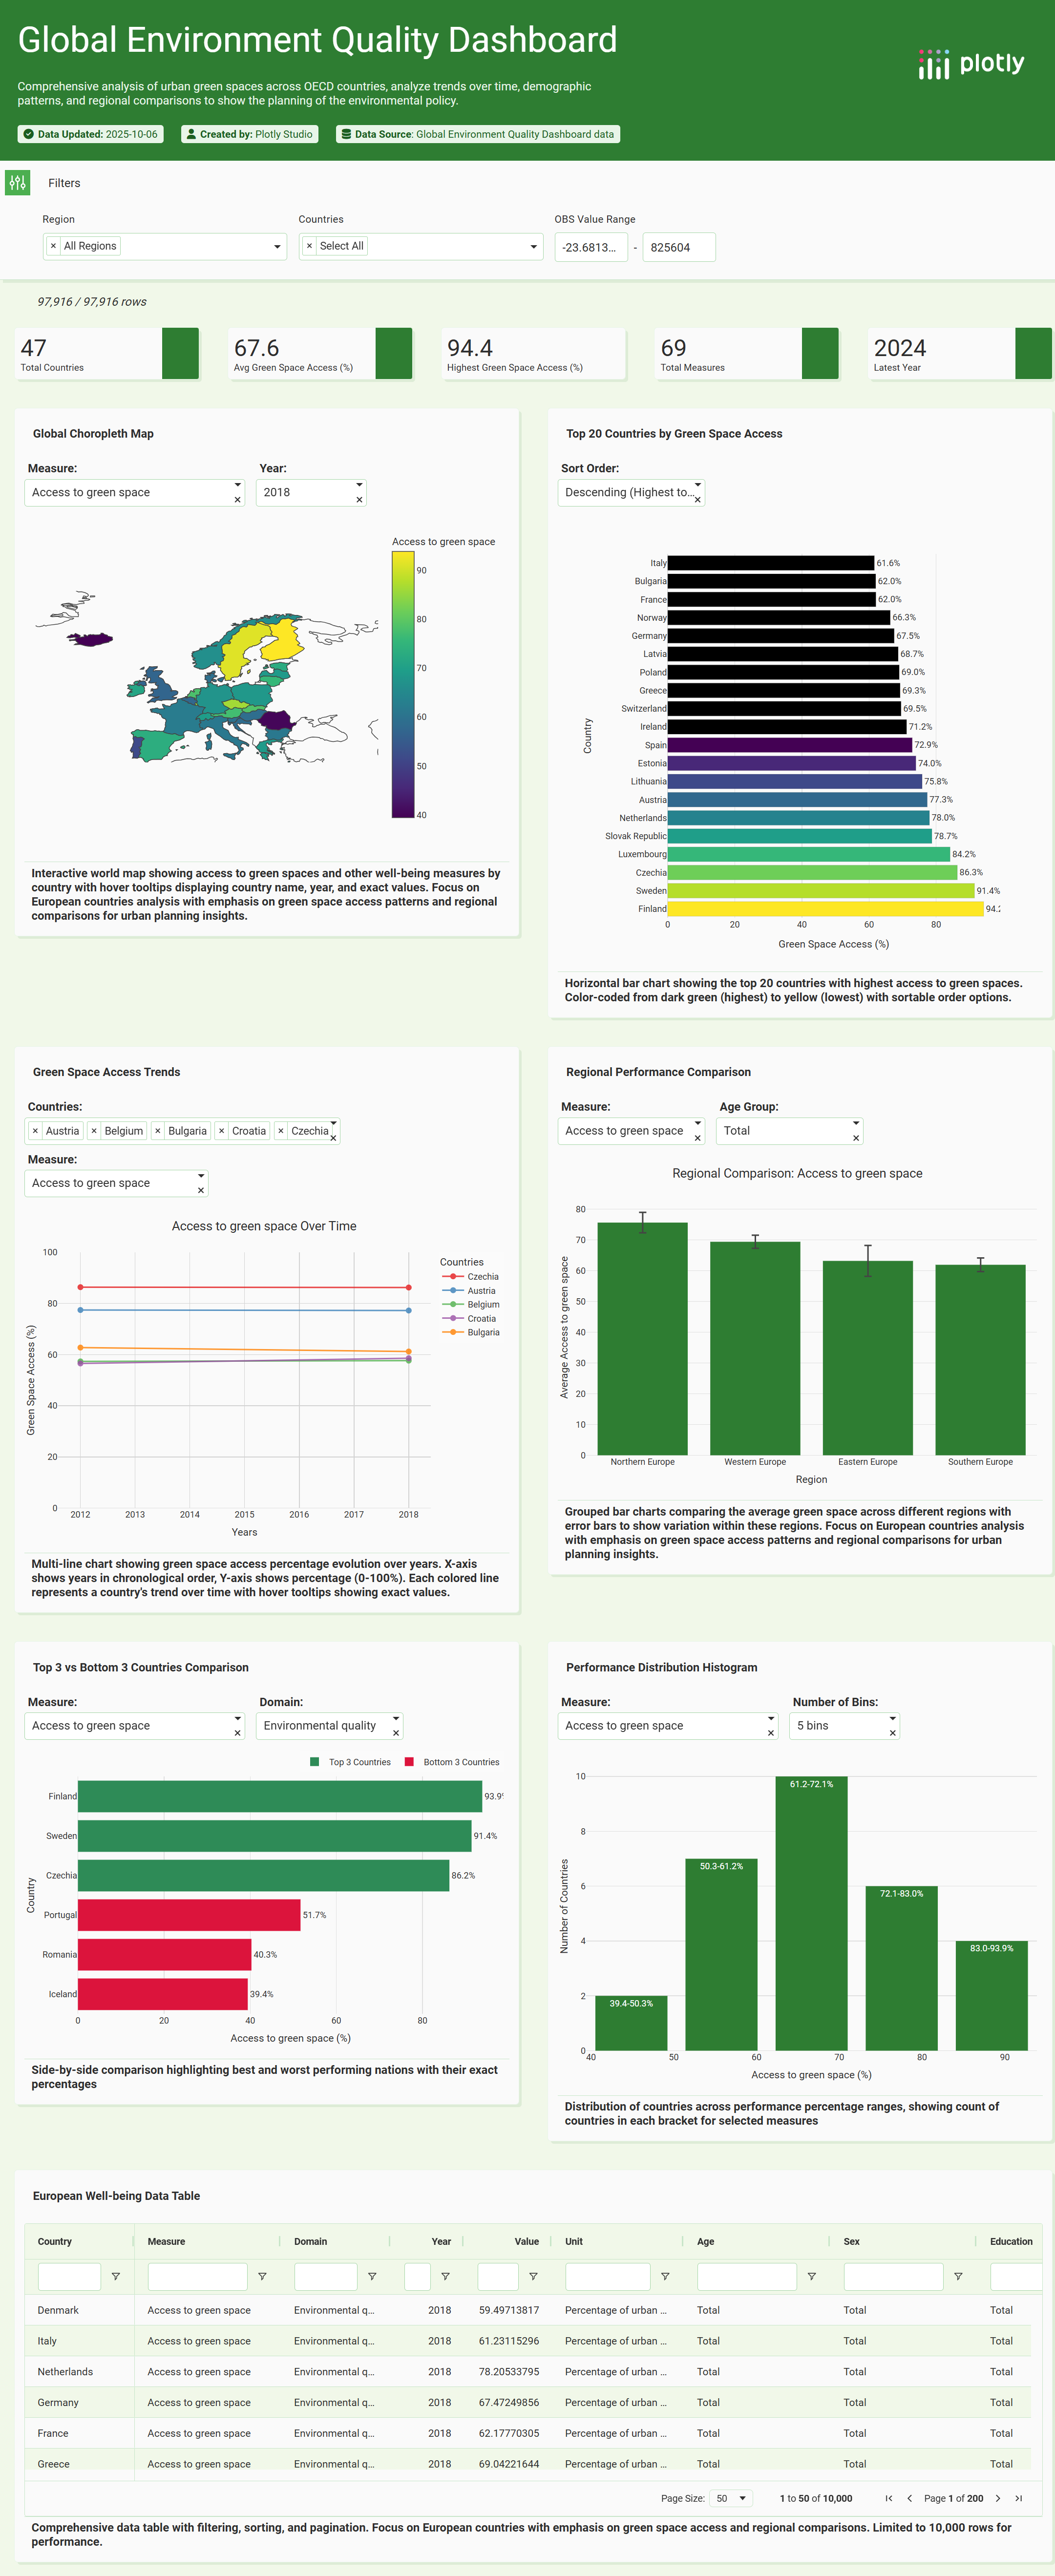
The OECD Green Space Access Dashboard transforms complex environmental data into an intuitive, interactive experience:
- Global Visualization: An interactive choropleth map revealing which countries prioritize urban green spaces
- Time Trend Analysis: Multi-year tracking showing how nations have improved (or declined) from 2004-2024
- Regional Comparisons: Statistical analysis of performance across continents
- Performance Rankings: Top 20 countries with dynamic sorting and color-coded insights
- Distribution Analytics: Understanding global patterns and identifying outliers
The dashboard reveals that Austria leads at 94.4% access, while the global OECD average sits at 67.6% - a significant gap that highlights opportunities for policy improvement.
How I Built It
This was a profound learning experience. Instead of opening VS Code and writing:
import plotly.express as px
import pandas as pd
df = pd.read_csv('oecd_data.csv')
fig = px.choropleth(df, ...)
## Challenges we ran into

## Accomplishments that we're proud of

## What we learned

## What's next for OECD Green Space Access Dashboard
Built With
- choropleth-maps
- data-visualization
- datavisualization
- environmental-data
- geospatial-visualization
- natural-language-processing
- no-code
- oecd
- plotly
- plotly-cloud
- plotly-studio

Log in or sign up for Devpost to join the conversation.