-
preview

Inspiration
Understanding the relationship between job quality and overall life satisfaction is essential for shaping social and economic policy. The OECD provides rich datasets on both, but they are difficult to visualize interactively. This project was inspired by the need to make those insights accessible, intuitive, and actionable for students.
What it does
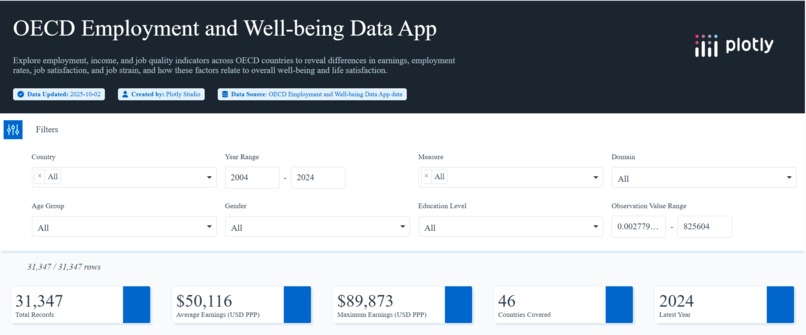
The OECD Employment and Well-being Data App visualizes country-level relationships between employment indicators (e.g., employment rate, labor market insecurity, long working hours) and subjective well-being. Users can explore interactive scatter plots, filter data by time and demographic factors, and view dynamic tooltips showing country-specific metrics and trends.
How we built it
We built the app using Plotly Studio as the starting point to design and explore data visualizations. From there, we made adjustments and improvements within the platform to refine colors, layouts, and interactivity.
Challenges we ran into
·Handling missing or inconsistent data across countries and years. ·Synchronizing multiple datasets with different naming conventions. ·Designing a clean visualization that remains readable across screen sizes. ·Debugging callback dependencies in Dash without affecting performance.
Accomplishments that we're proud of
·Created a fully functional, interactive dashboard with real OECD data. ·Designed a clear user interface that separates filters, visuals, and insights logically. ·Implemented dynamic legends and annotation logic to improve usability. ·Achieved strong visual performance even with large datasets.
What we learned
·How to design scalable data visualizations using Plotly Dash. ·Techniques for UI/UX optimization within analytical dashboards. ·The value of effective storytelling through data visualization.
What's next for OECD Employment and Well-being Data App
Next, we plan to improve data cleaning and consistency across different indicators, refine the layout and design of the visualizations, and enhance the visibility of correlations between key factors.


Log in or sign up for Devpost to join the conversation.