-
-
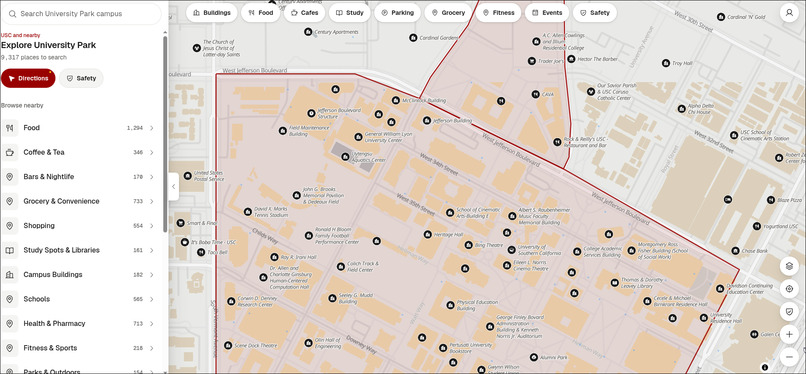
Landing Page
-
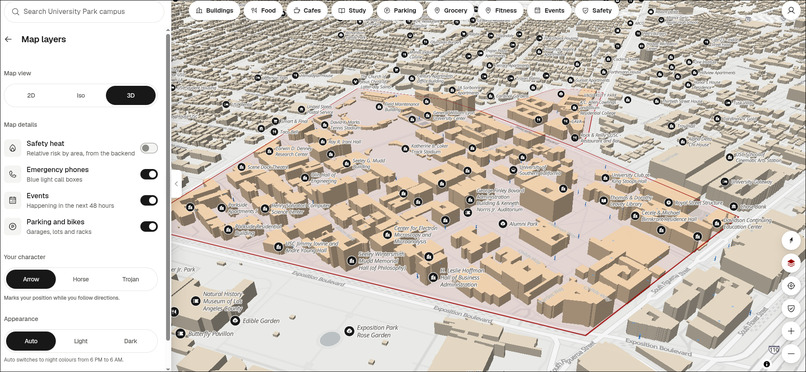
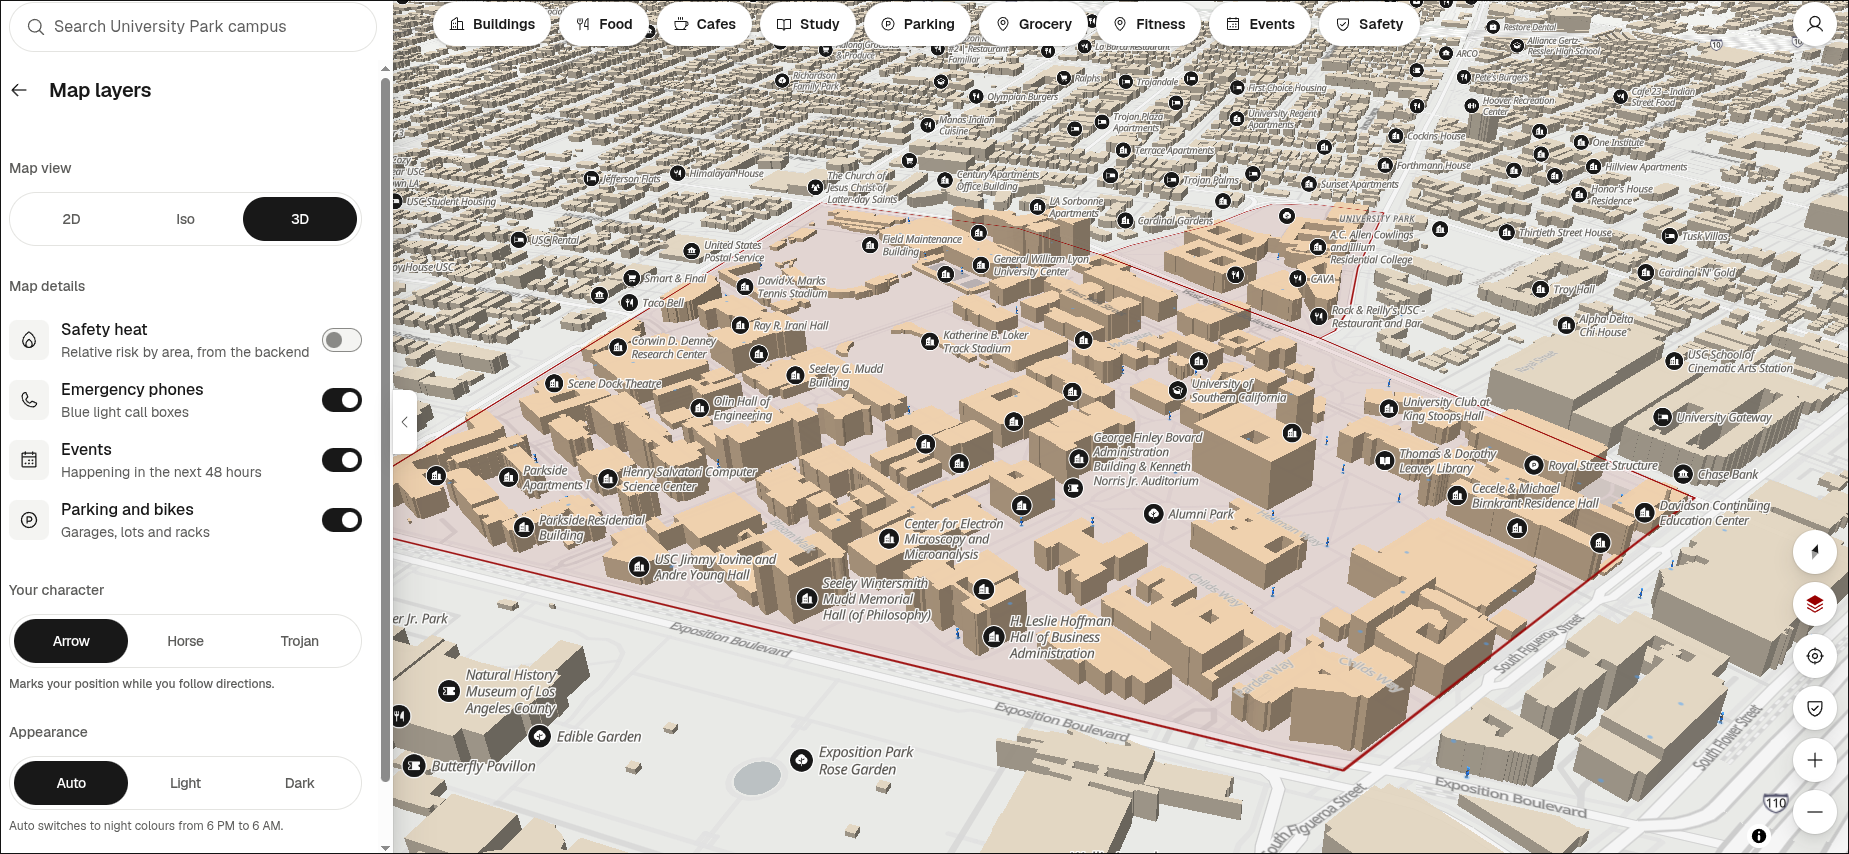
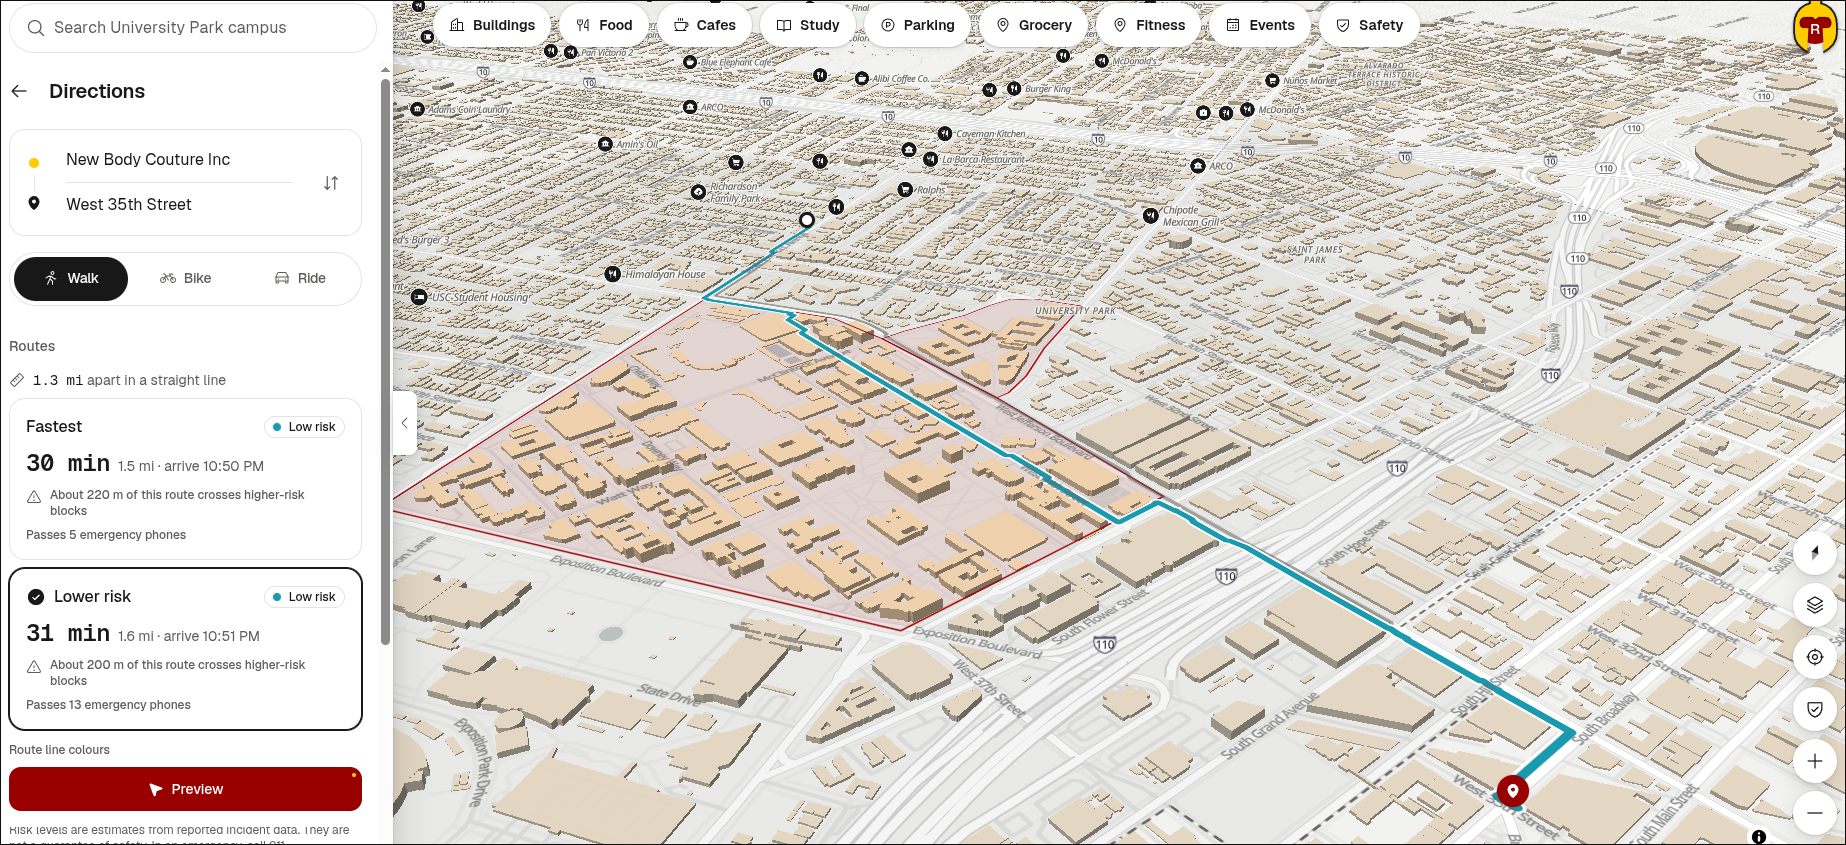
3D View of UPC Campus
-
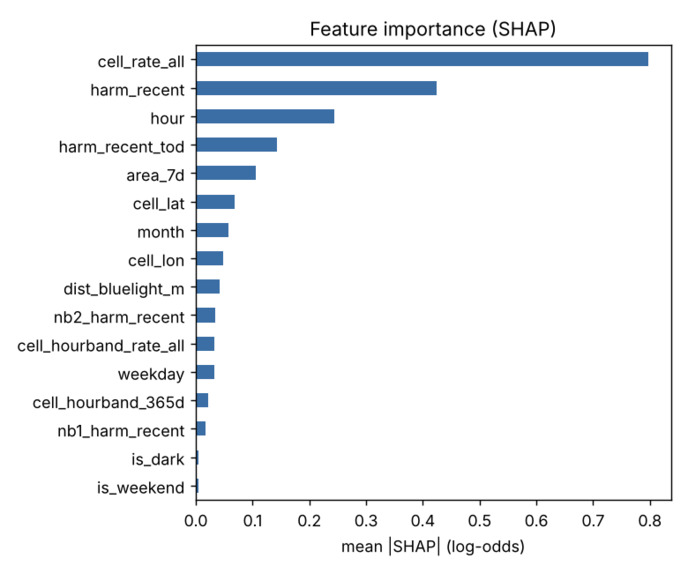
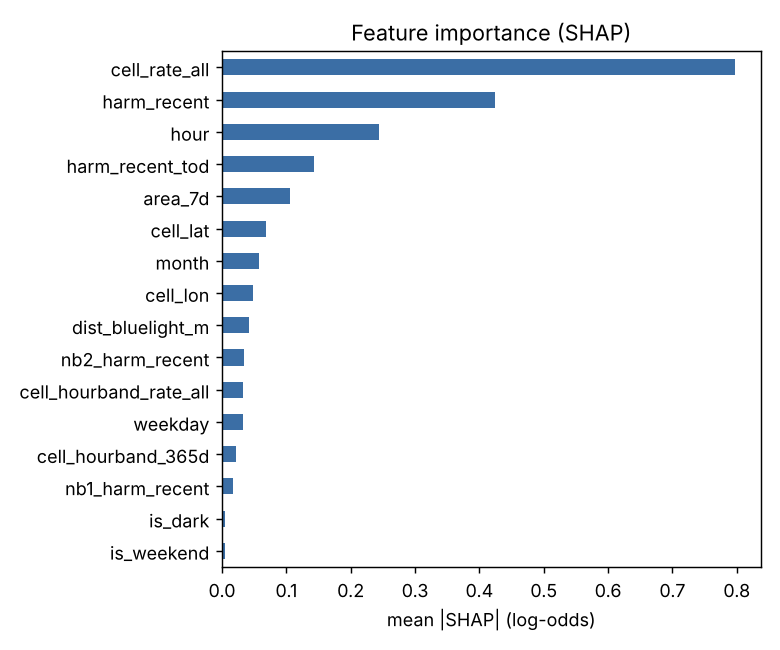
Features of the LAPD Crime Dataset
-
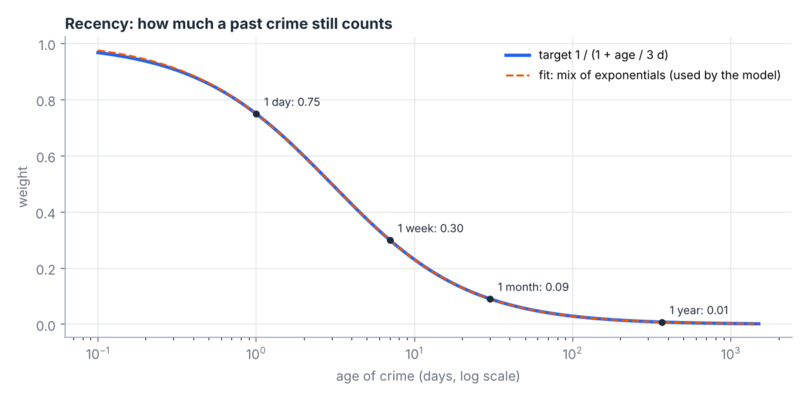
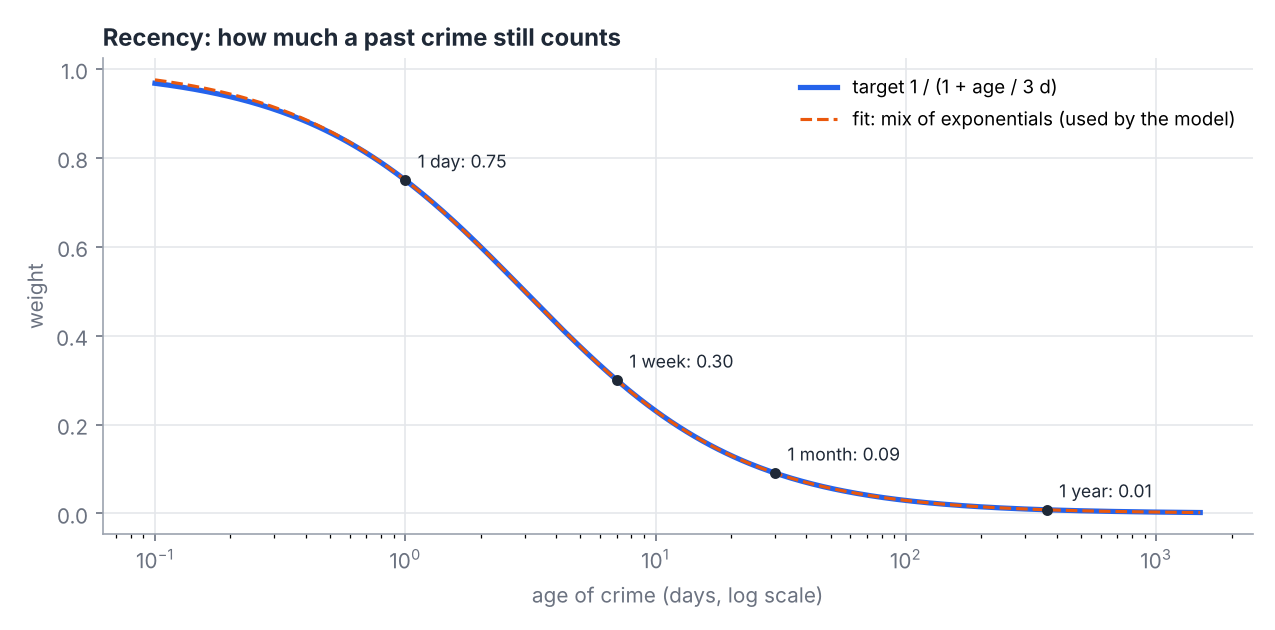
How much a past crime counts toward a tile’s risk score as the crime gets older. Integral to the scoring algorithm.
-
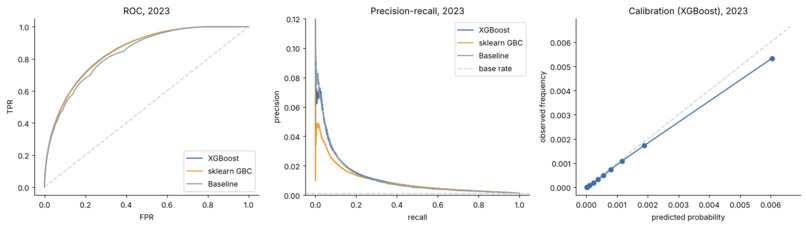
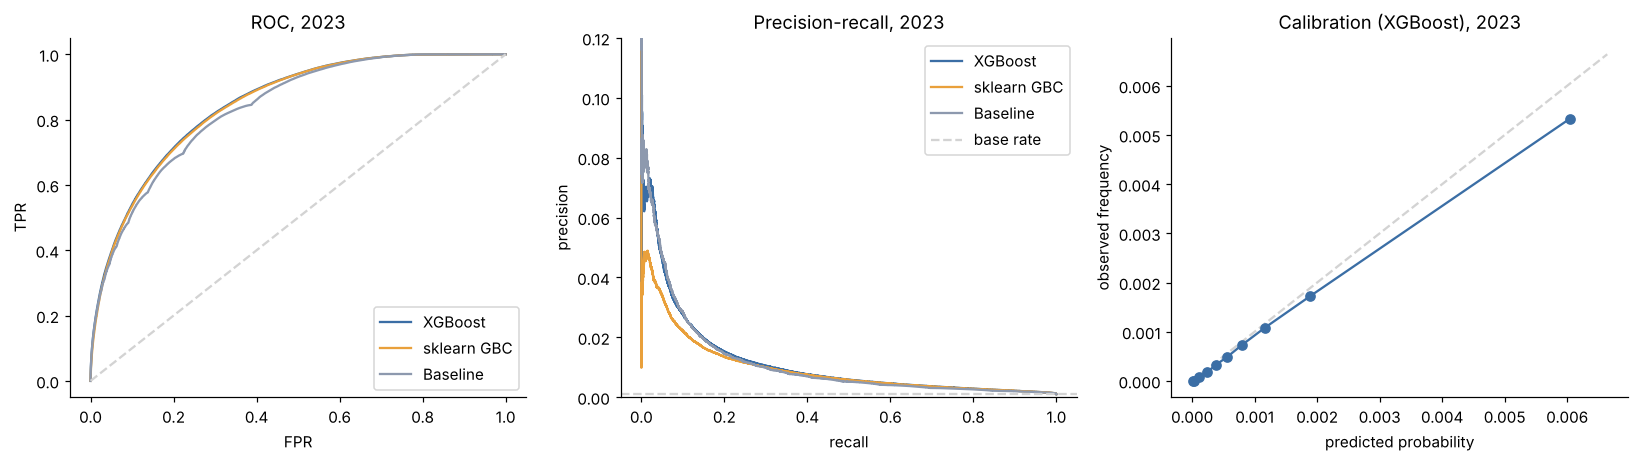
Risk model eval and metrics.
-
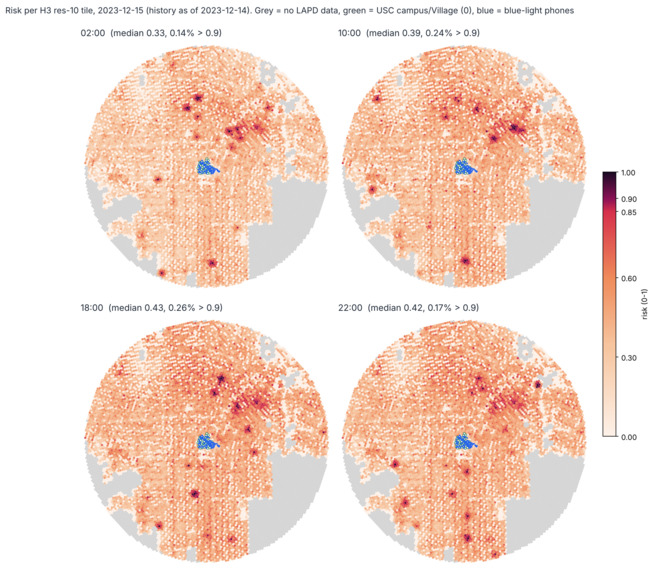
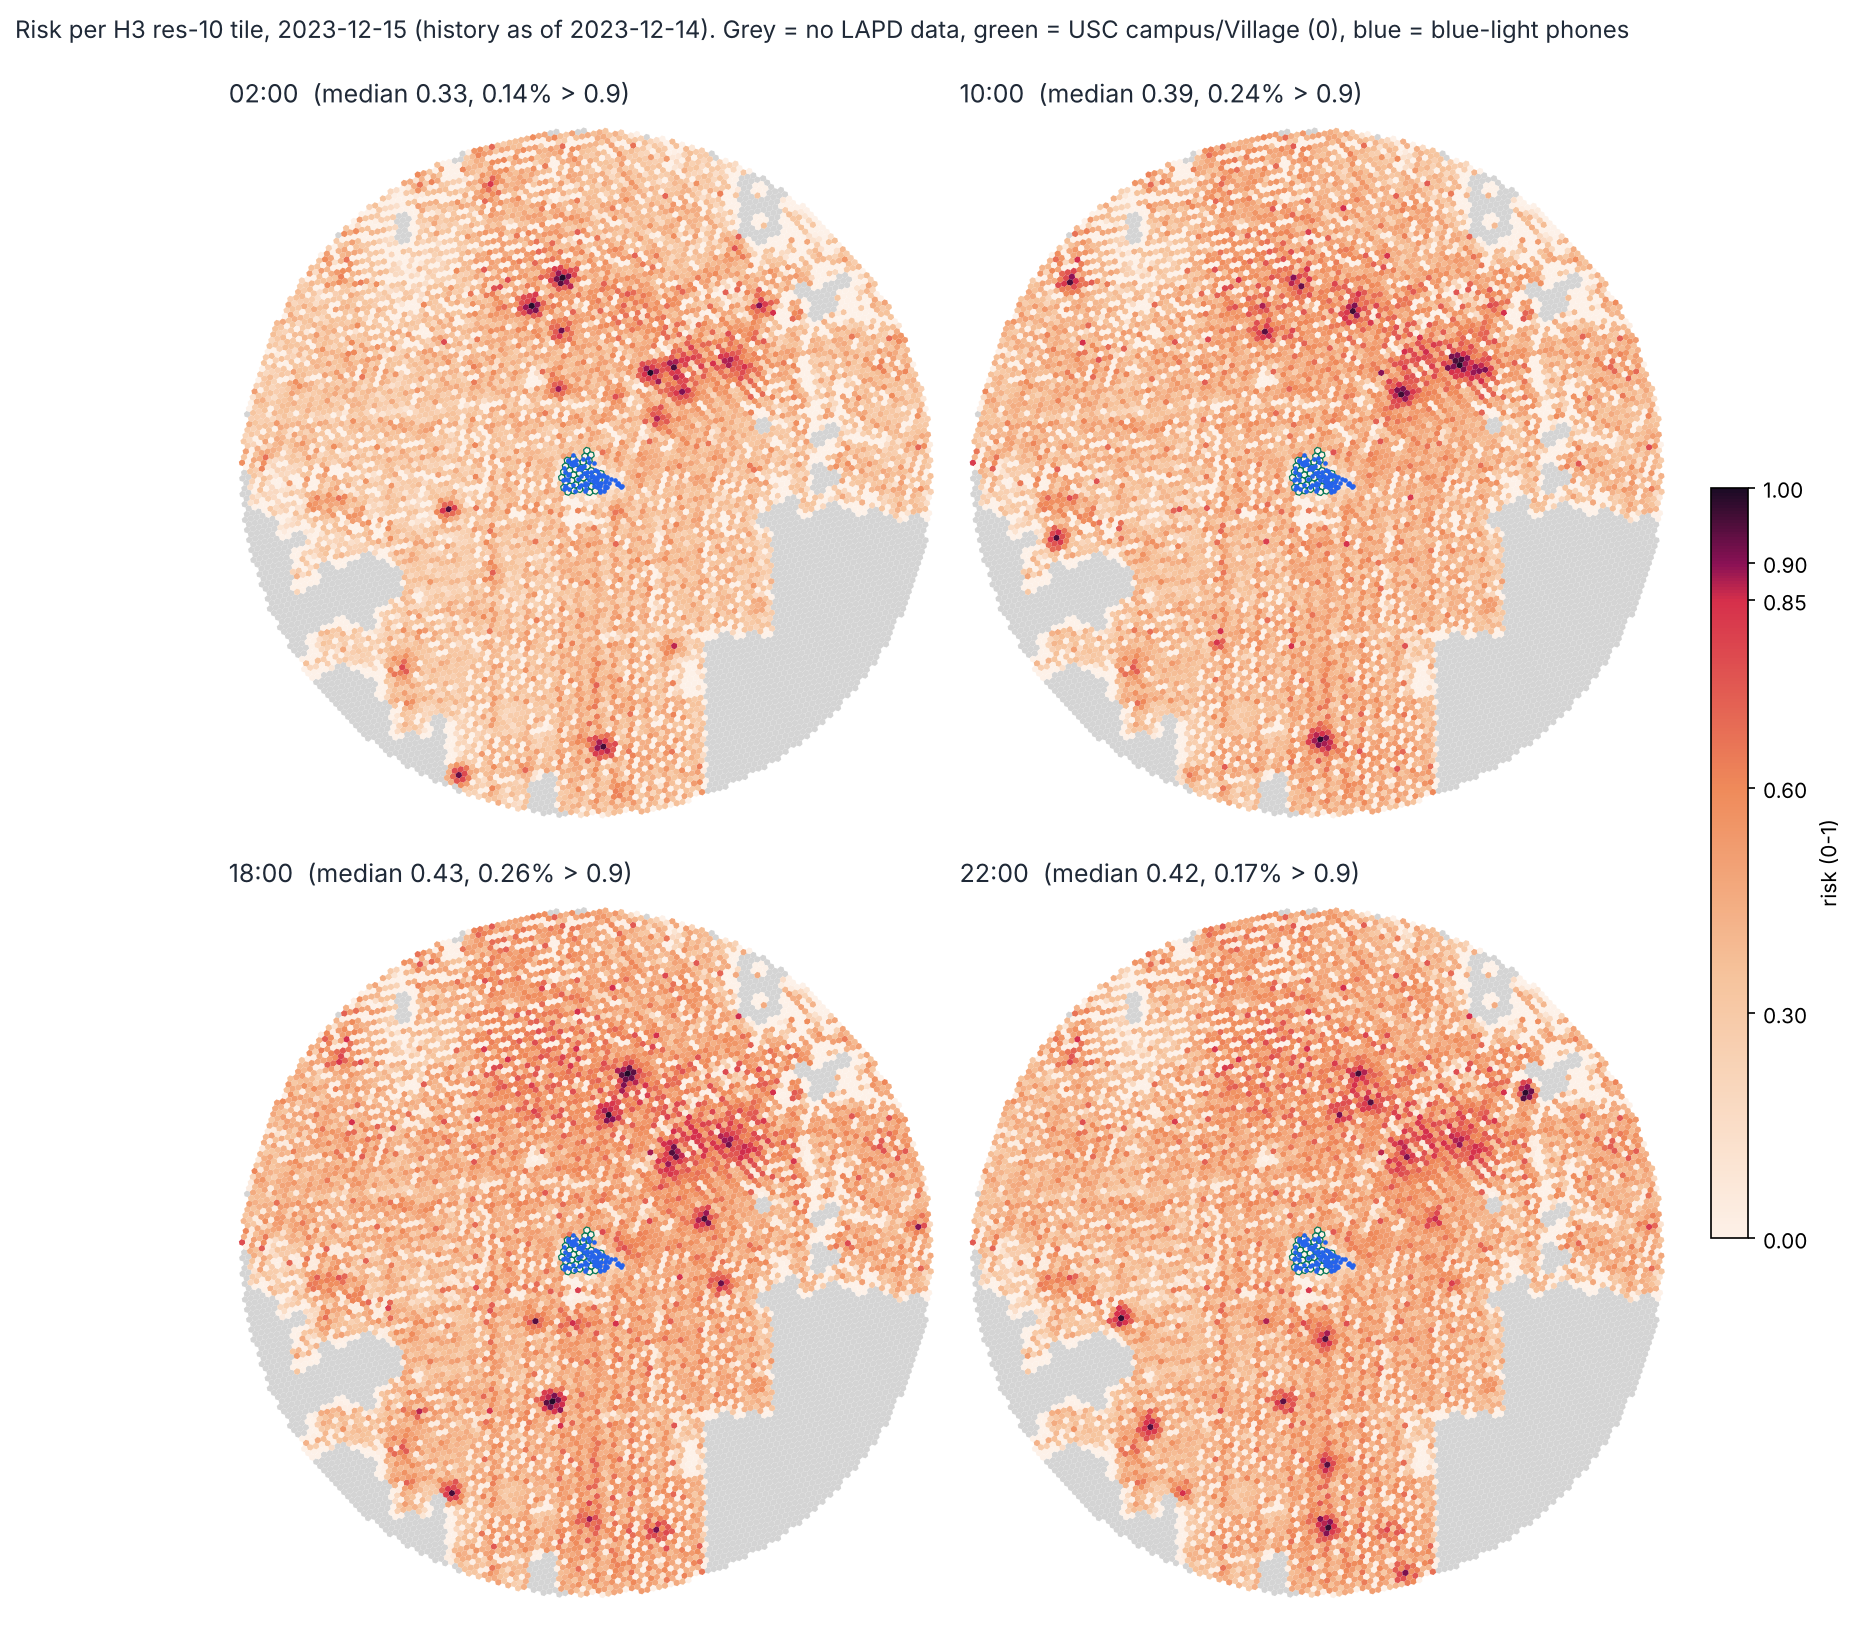
The heatmap of predicted tile risk scores as a factor of time.
-
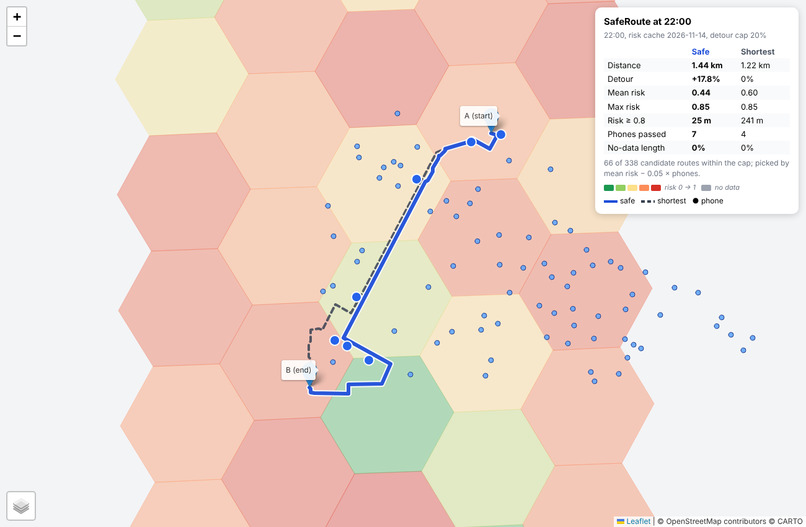
Initial tiling and pathfinding from Tommy Trojan to USC Village.
-
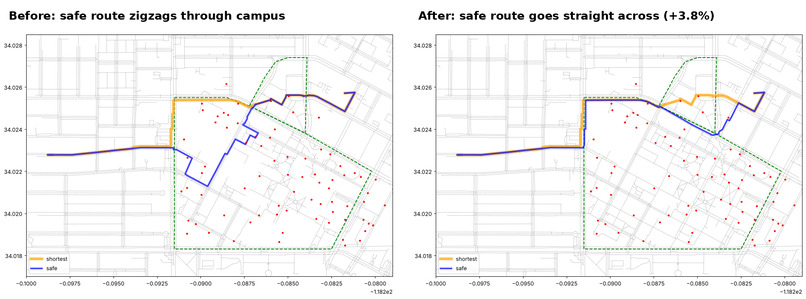
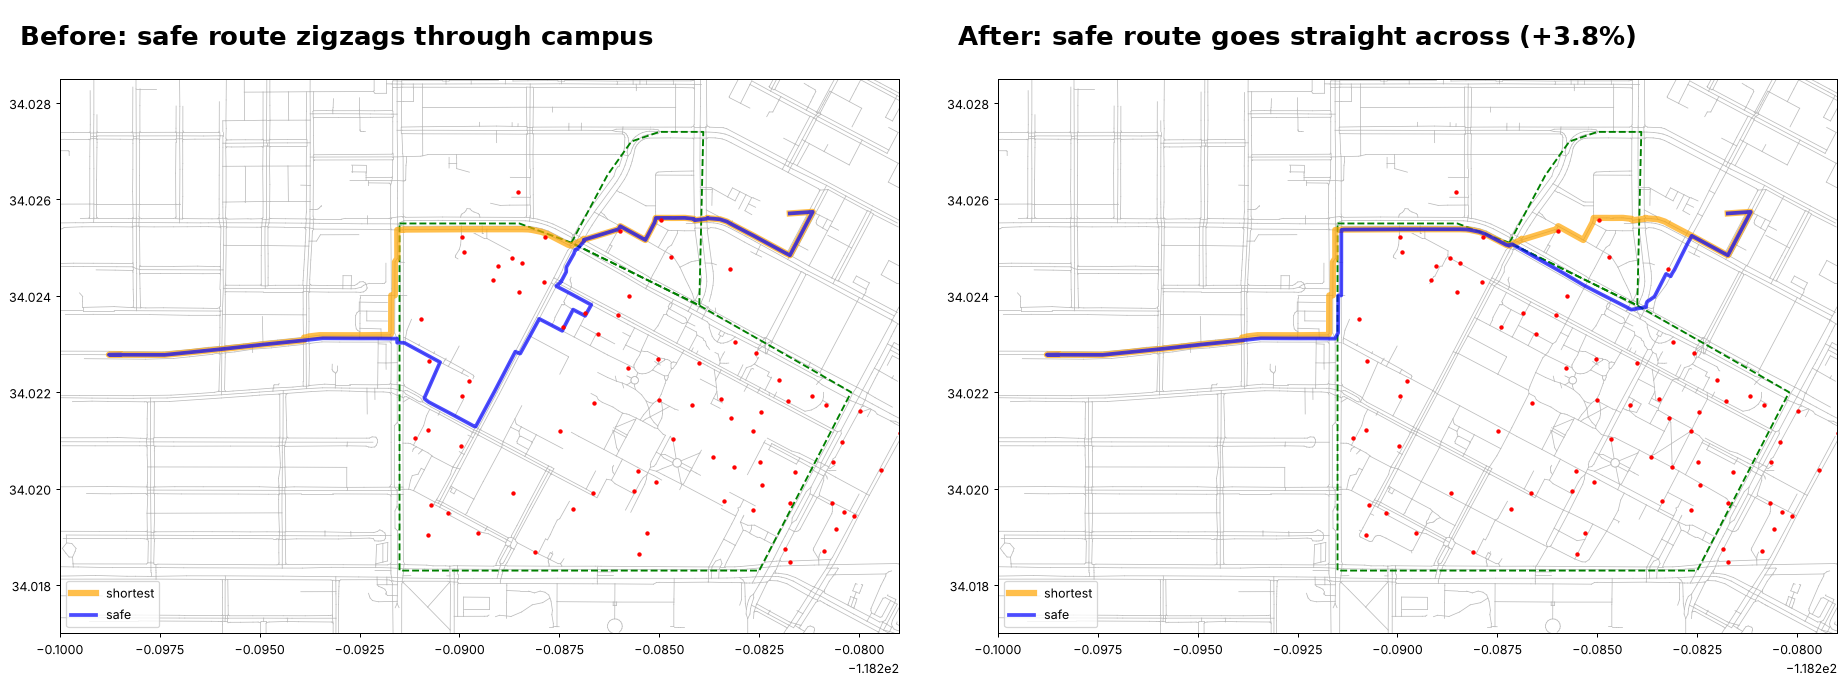
Pathfinding fix after correcting OpenStreetMap
-
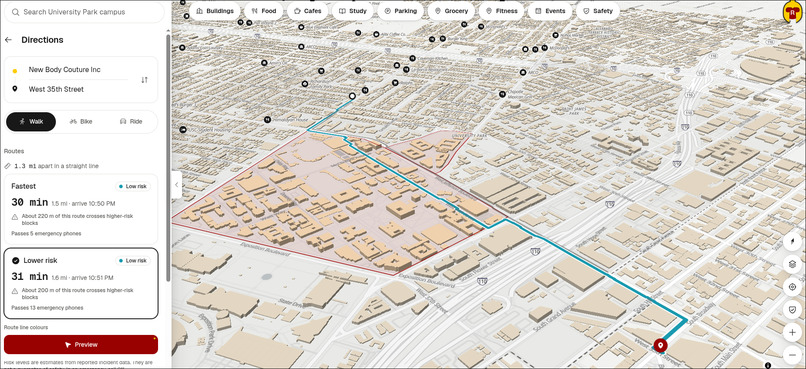
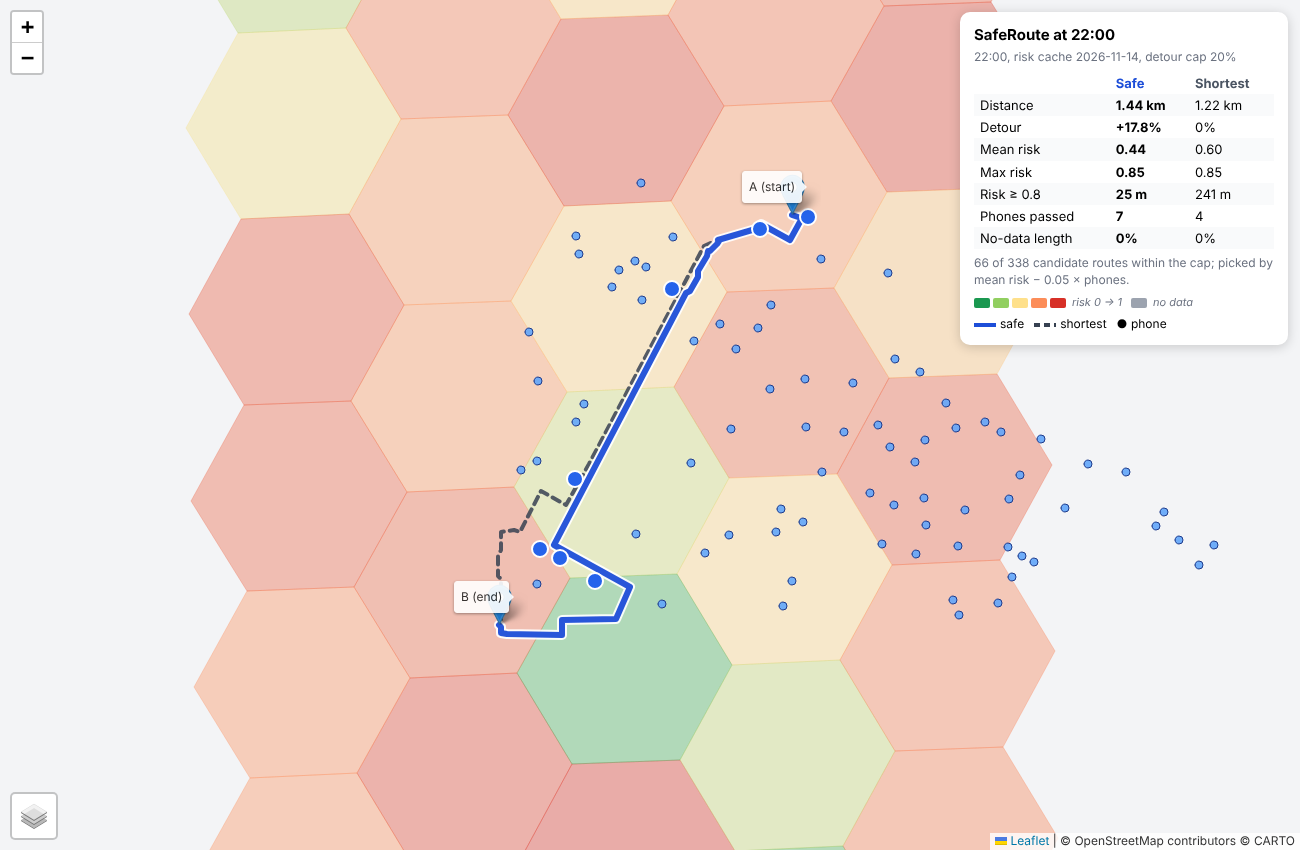
Path finding with risk detection algorithm
-
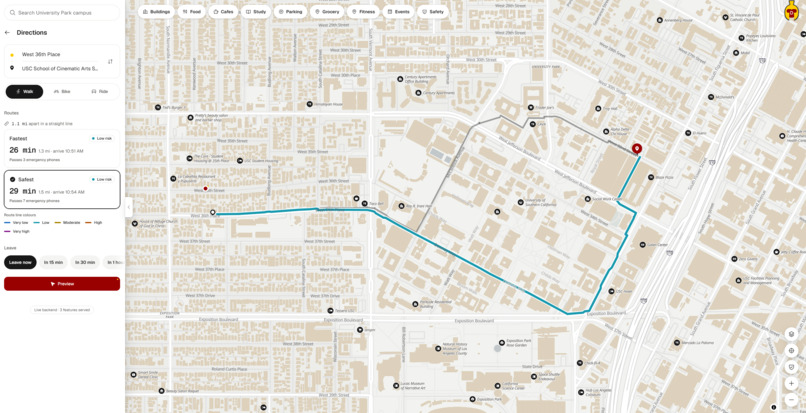
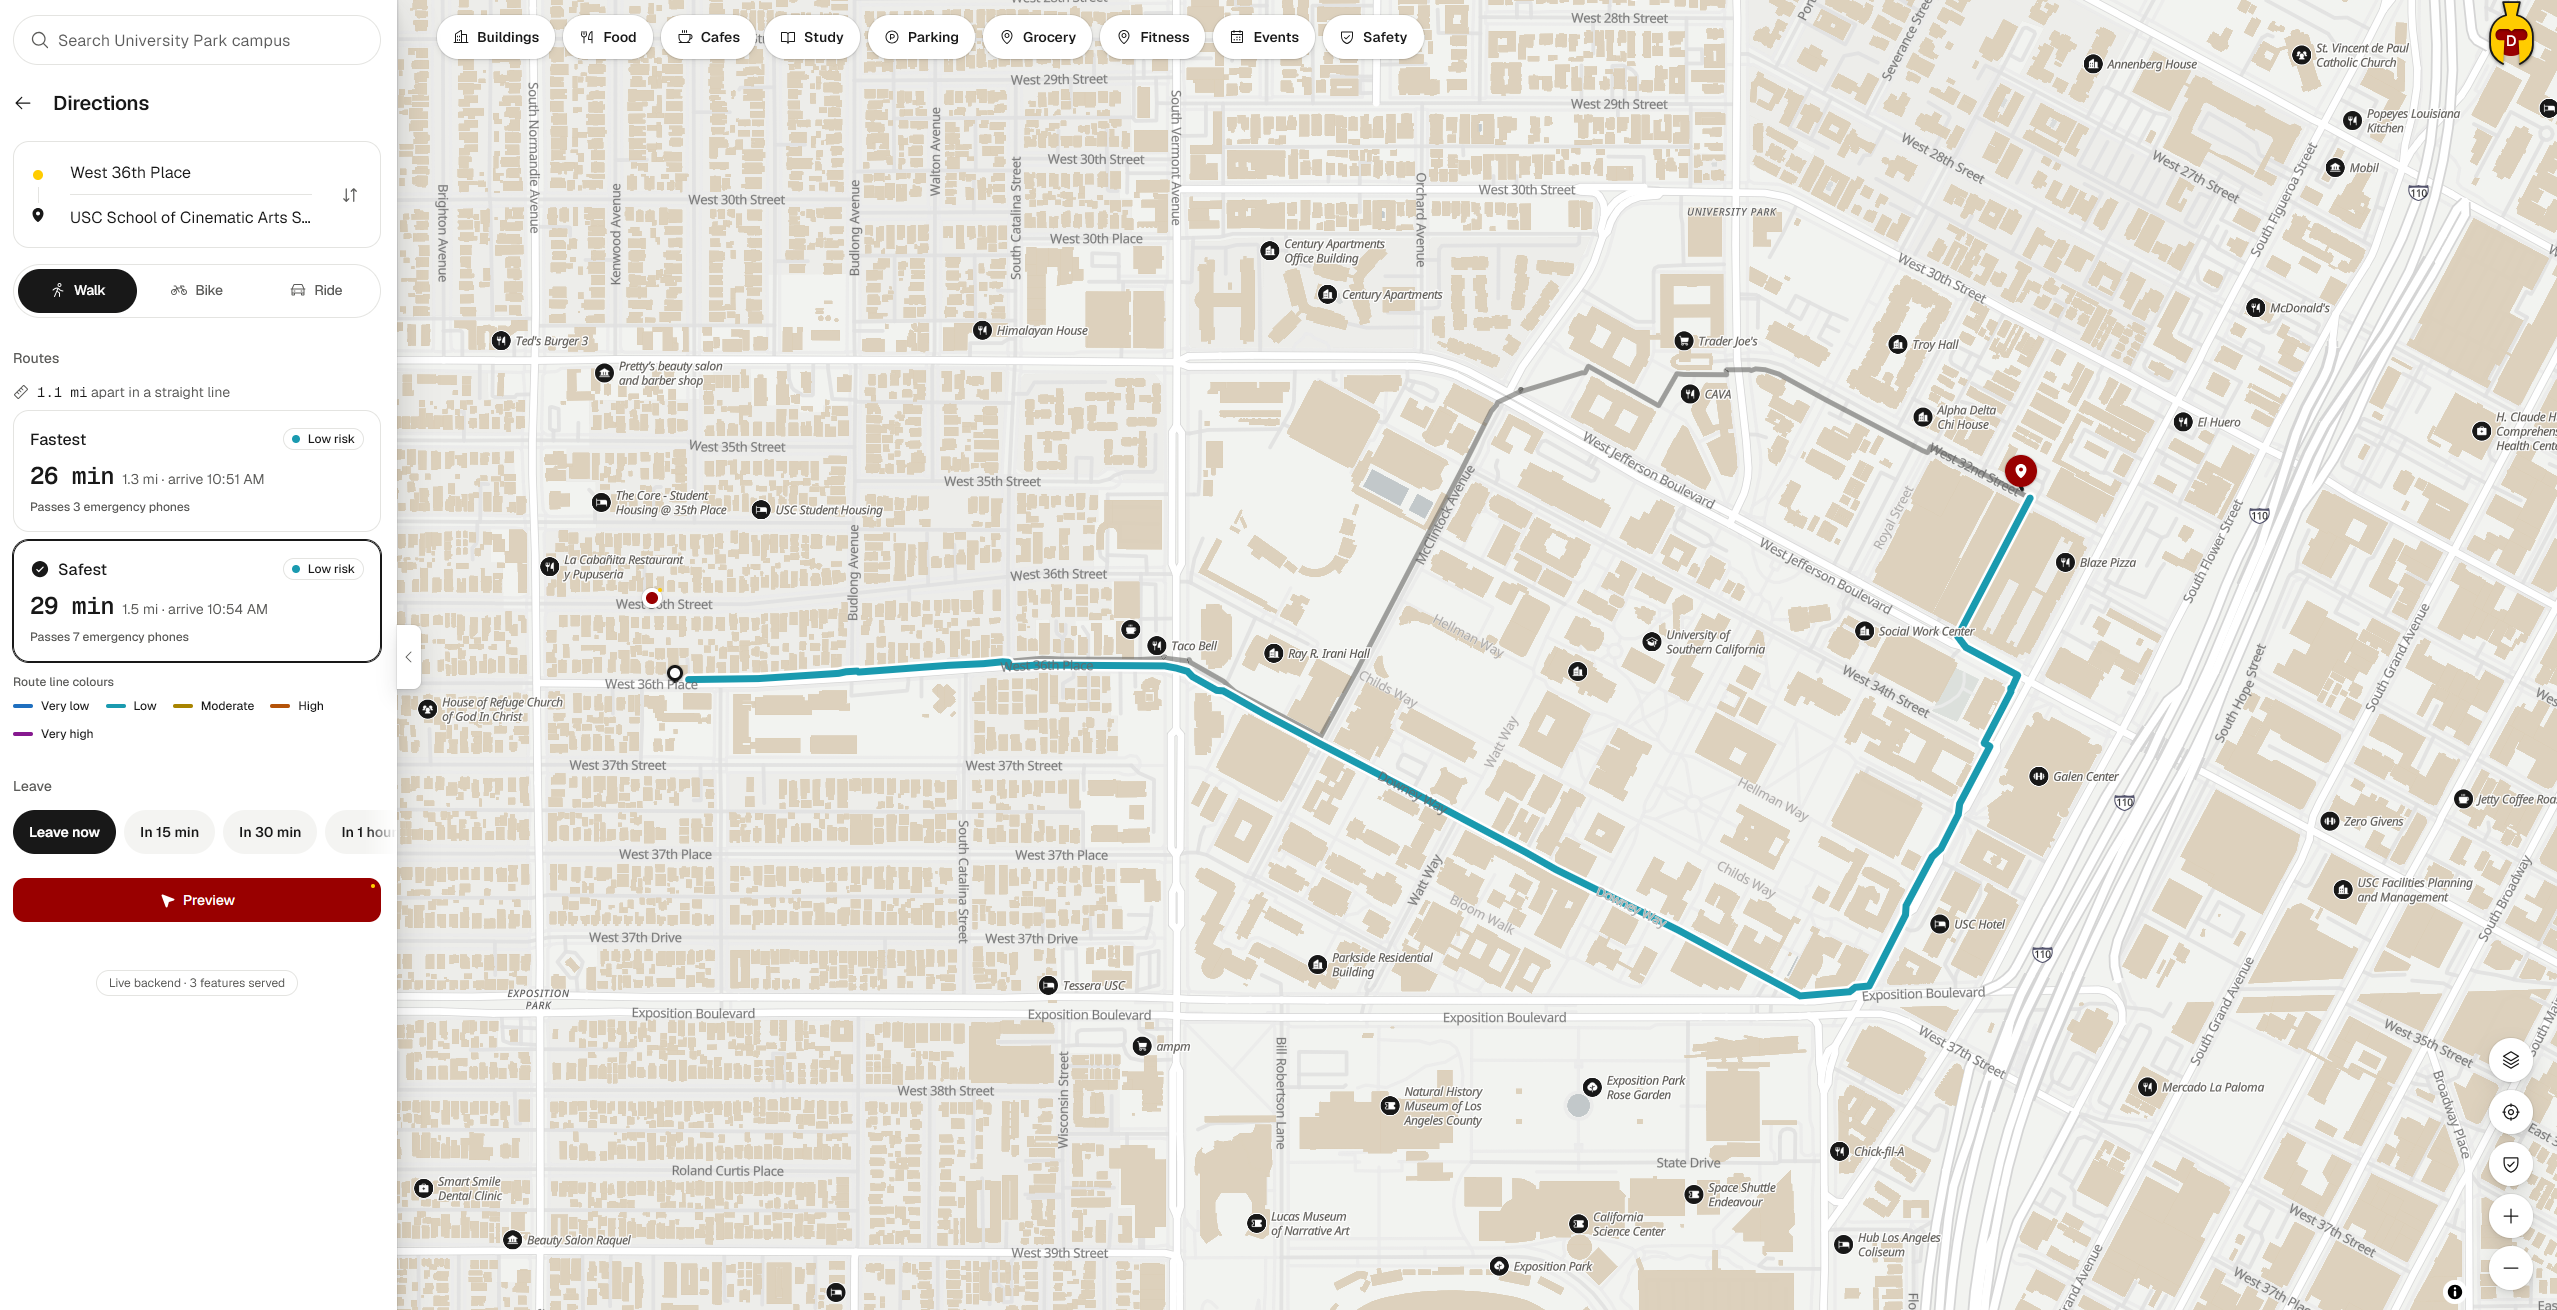
A path cutting through campus with one being safer than the other by passing more blue-lights along the way.
Inspiration
USC does a great job of making its campuses and surrounding neighborhoods as safe as possible, but crime remains a concern. In such a densely populated area of South Los Angeles, walking home late at night can be stressful. That’s how we came up with Odyssey: a feature-rich map application with built-in crime detection and hotspot prediction.
What it does
Odyssey plans walking routes that trade a little distance for greater safety. It scores every roughly 140 m block around USC for crime risk at the hour you’re walking. It routes you through safer streets, campus, and USC Village, and past blue-light emergency phones. If you step off the route, it reroutes you from your current location. Each route shows its risk score alongside the fastest path’s, so you can see the trade-off between risk and distance.
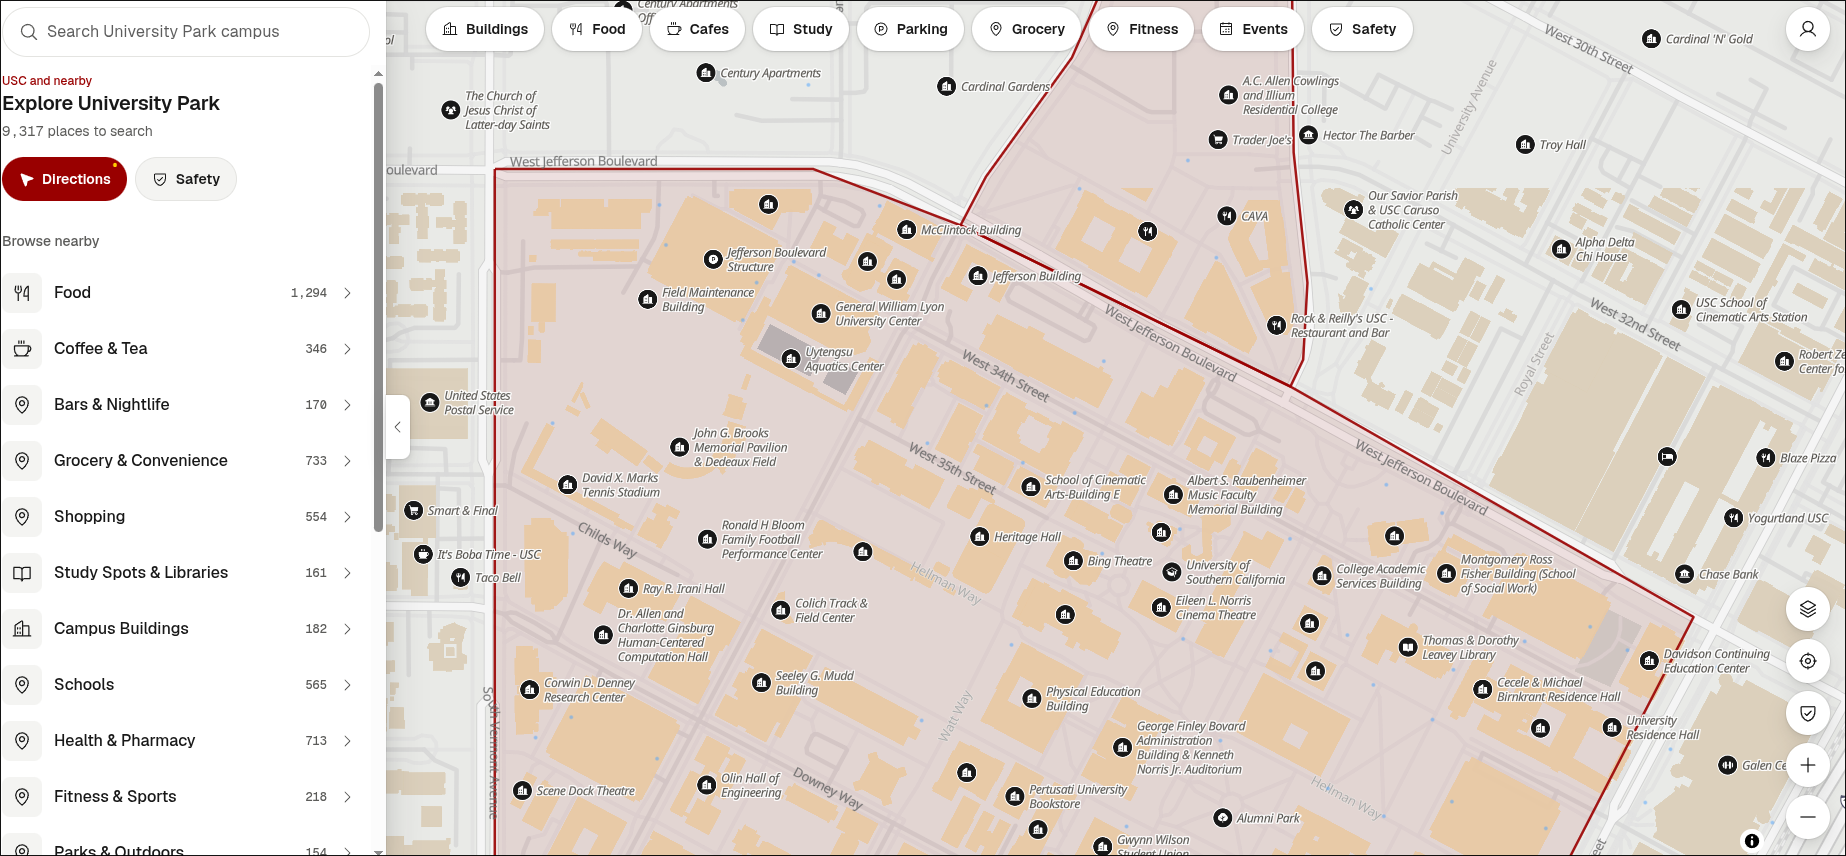
Odyssey also features a highly detailed map of the University Park Campus (UPC), complete with the locations of blue-light emergency phones, study spaces, and building codes. No more last-minute struggles to find an unfamiliar classroom on the morning of a midterm.
How we built it
Risk model. We split the area around USC into about 10,000 H3 hexagonal tiles, each roughly 140 m across. We trained an XGBoost model using four years of LAPD crime data to predict the chance of an incident in each tile at each hour. Each past crime (i) is weighted by its severity, how recent it is, and how close its hour is to the hour being scored:
$$ w_i = s_i \cdot \frac{1}{1 + \Delta d_i / 3} \cdot \exp!\left(-\frac{\Delta h_i^2}{2\sigma^2}\right), \quad \sigma = 2\text{ h} $$
These weights are summed for each tile and its two rings of neighbors, alongside long-term rates, darkness, and distance to the nearest blue-light phone. The model’s probability (p) is mapped to a log scale, and a boost is added for robberies or more severe crimes in the last 24 hours:
$$ \text{risk} = b + (1 - b)\left(1 - e^{-x/k}\right), \qquad b = 0.85 \cdot \operatorname{clip}!\left(\frac{\ln(p/p_{lo})}{\ln(p_{hi}/p_{lo})}, 0, 1\right) $$
Blue-light phones reduce nearby risk scores, and campus and USC Village tiles are assigned a score of 0.
Backend. A Python Flask API runs in Docker Compose alongside a database and a crime ingestor. Scripts load the H3 tiles, OpenStreetMap walking paths, points of interest, and building footprints. The /api/v1/route endpoint takes a start and end point and runs a safety-weighted shortest-path search. Each street segment (e) has a cost:
$$ c(e) = \ell_e \cdot \left(1 + \lambda \cdot \text{risk}_e\right) $$
The search keeps the route within a specified limit on extra distance compared with the shortest path. It returns both the safest and fastest routes, along with their risk scores, distances, and blue-light phone counts.
Frontend. A React and TypeScript app built with Vite displays the risk heatmap and both routes on an interactive map. During a walk, it tracks your GPS location. If you’re more than 30 m off the route for 5 seconds, it asks the backend for a new route from your current location. A built-in simulator let us test walks and rerouting without leaving the room.
Challenges we ran into
Our safer routes initially zigzagged around campus instead of going straight through it. The causes turned out to be mismatched tile sizes between the model and router, along with walkways tagged as bike paths.
Making the score meaningful was also difficult: our initial probability-to-score mapping pushed every busy area toward 100% risk. We moved to a log scale with a separate danger boost, so the highest scores now indicate that something happened nearby recently. We also had to prevent future data from leaking into training.
Accomplishments that we’re proud of
The model achieves an AUC of 0.85 on held-out data from 2023 and 2024, and each score can be explained by the factors that drove it. On a real route from USC Village to Expo/Vermont at 10 PM, the safer path reduced the average risk score from 0.60 to 0.44 and passed 7 blue-light phones instead of 4, with about 18% more walking. We also built a 24-hour heatmap that shows how hotspots shift throughout the day.
What we learned
Safety data is messy and biased. Reported crime doesn’t capture all crime, so design choices matter as much as model accuracy. We built rules into the model so scores move in expected directions: more crime history can only raise the risk score, and proximity to a phone can only lower it. We also learned that people trust a route more when they can see why it was chosen.
What’s next for Odyssey
We want to add broken-streetlight reports from LA’s 311 data and AI-written explanations of why each route was chosen. Live crime feeds would replace the historical replay. Beyond that, we’d like to add route sharing so friends can check in and expand coverage beyond UPC to the Health Sciences Campus (HSC).
We never intended Odyssey to replace your favorite maps application. Instead, we envision it integrating into USC’s existing ecosystem of apps to enhance student services and safety in an AI-enabled age.
Built With
- azure
- docker
- flask
- google-oauth
- h3
- open-meteo
- pmtiles
- postgis
- postgresql
- python
- timescaledb
- xgboost
