🌊 OceanScope — Global Fishing Intelligence Platform
The Problem
The world's oceans generate enormous amounts of vessel activity data through AIS (Automatic Identification System). However, turning this data into useful intelligence is difficult.
Raw fishing-effort datasets can contain millions of spatial and temporal records. Simply displaying those records does not answer the questions that matter:
- Where is fishing activity concentrated?
- Which countries contribute the most fishing effort?
- Which fishing methods dominate?
- How does fishing activity change over time?
- Which vessels and fleets are most active?
- Where are unusual or near-continuous activity patterns occurring?
- Which areas experience the greatest fishing pressure?
We wanted to build a system that could move beyond static charts and transform large-scale fishing data into an interactive intelligence platform.
💡 Our Solution
OceanScope is a global fishing intelligence platform built to explore, analyze, and interpret large-scale AIS-derived fishing activity.
Instead of forcing users to work directly with massive datasets, OceanScope provides a unified analytical interface covering:
🌍 Global spatial activity 🚩 Flag-state intelligence ⚙️ Gear-type analytics 🚢 Vessel intelligence 📅 Temporal trends 🗺️ Spatial density analysis ⚠️ Anomaly detection 🌱 Sustainability indicators 🤖 AI-generated insights 📦 Filtered data exports
The goal is simple:
Turn complex fishing activity data into intelligence that people can actually explore and understand.
📊 The Data
OceanScope uses the Global Fishing Watch v3.0 fishing-effort corpus for 2019.
The dataset contains large-scale fishing activity derived from AIS data and allows us to analyze fishing effort across geographic cells, dates, flag states, and gear classifications.
Our 2019 analysis contains:
- 52.1M fishing vessel-hours
- 162.9M AIS vessel-presence hours
- 32.0% fishing ratio
- 249 active flag states
- 16 gear classes
- 1.9M active 0.1° cells
- 68.5K registered vessels
This scale is what motivated us to design OceanScope around analytical aggregation rather than repeatedly processing raw records in the UI.
🔎 What OceanScope Can Do
1. Executive Overview
The Executive Overview provides an immediate global picture of fishing activity.
Users can see total fishing effort, vessel presence, fishing ratio, active countries, gear classes, active spatial cells, peak months, and busiest days.
The dashboard also automatically generates observations from the current dataset selection.
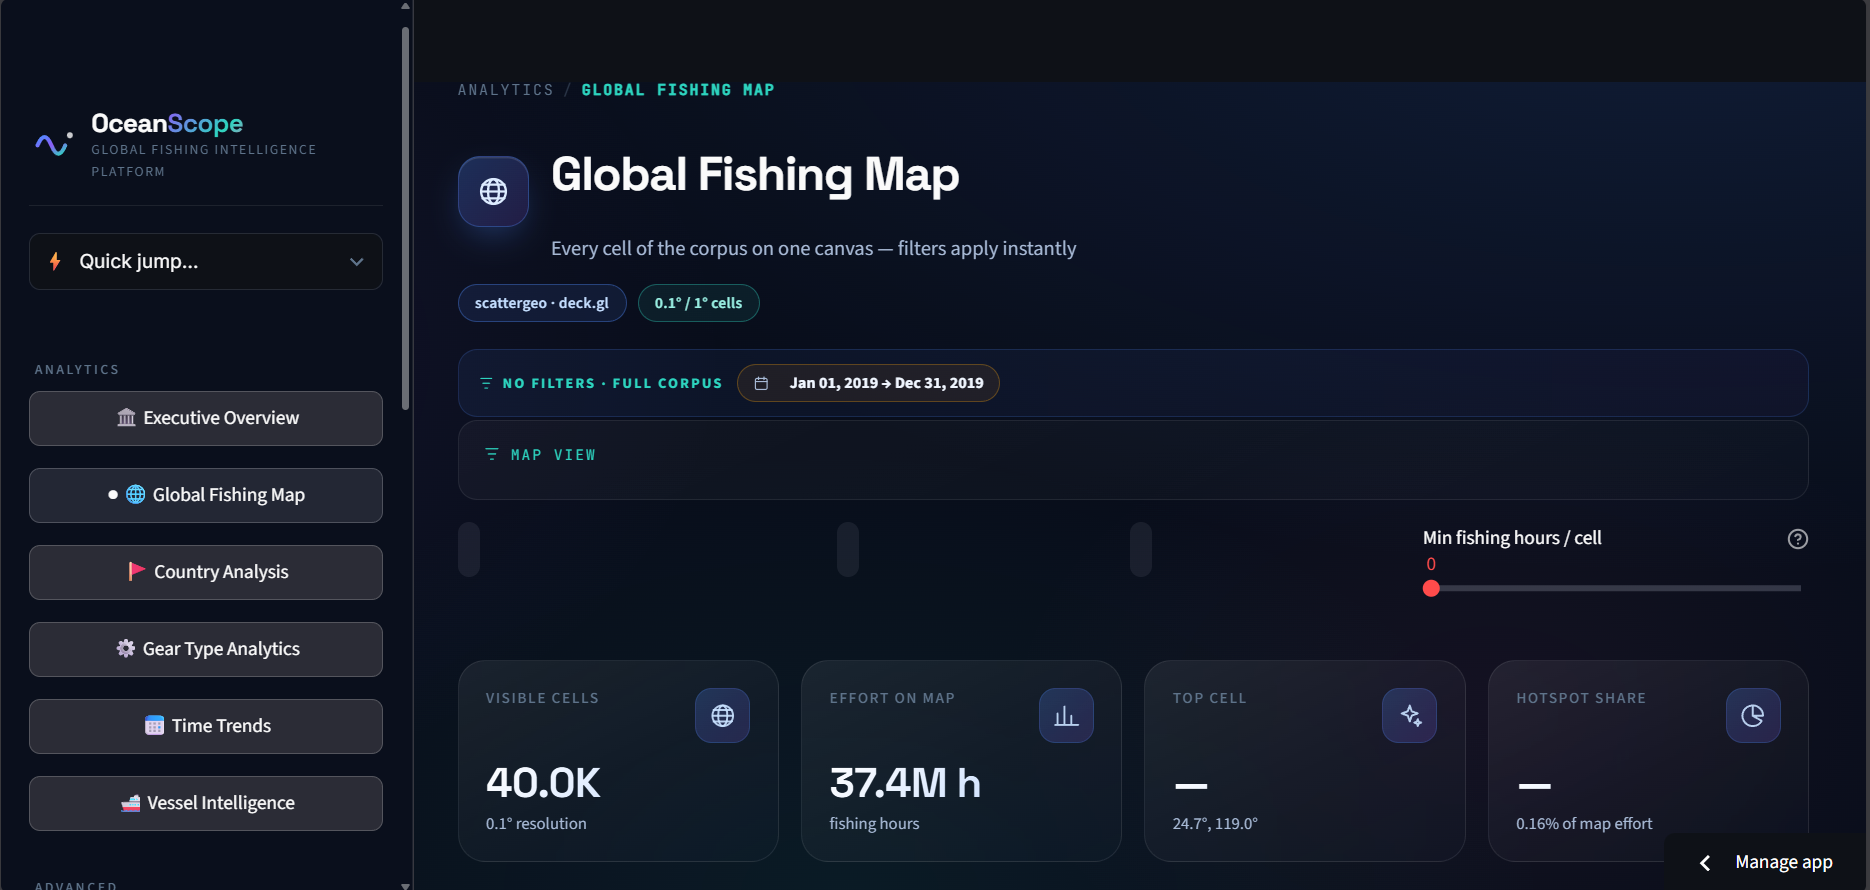
2. Global Fishing Map
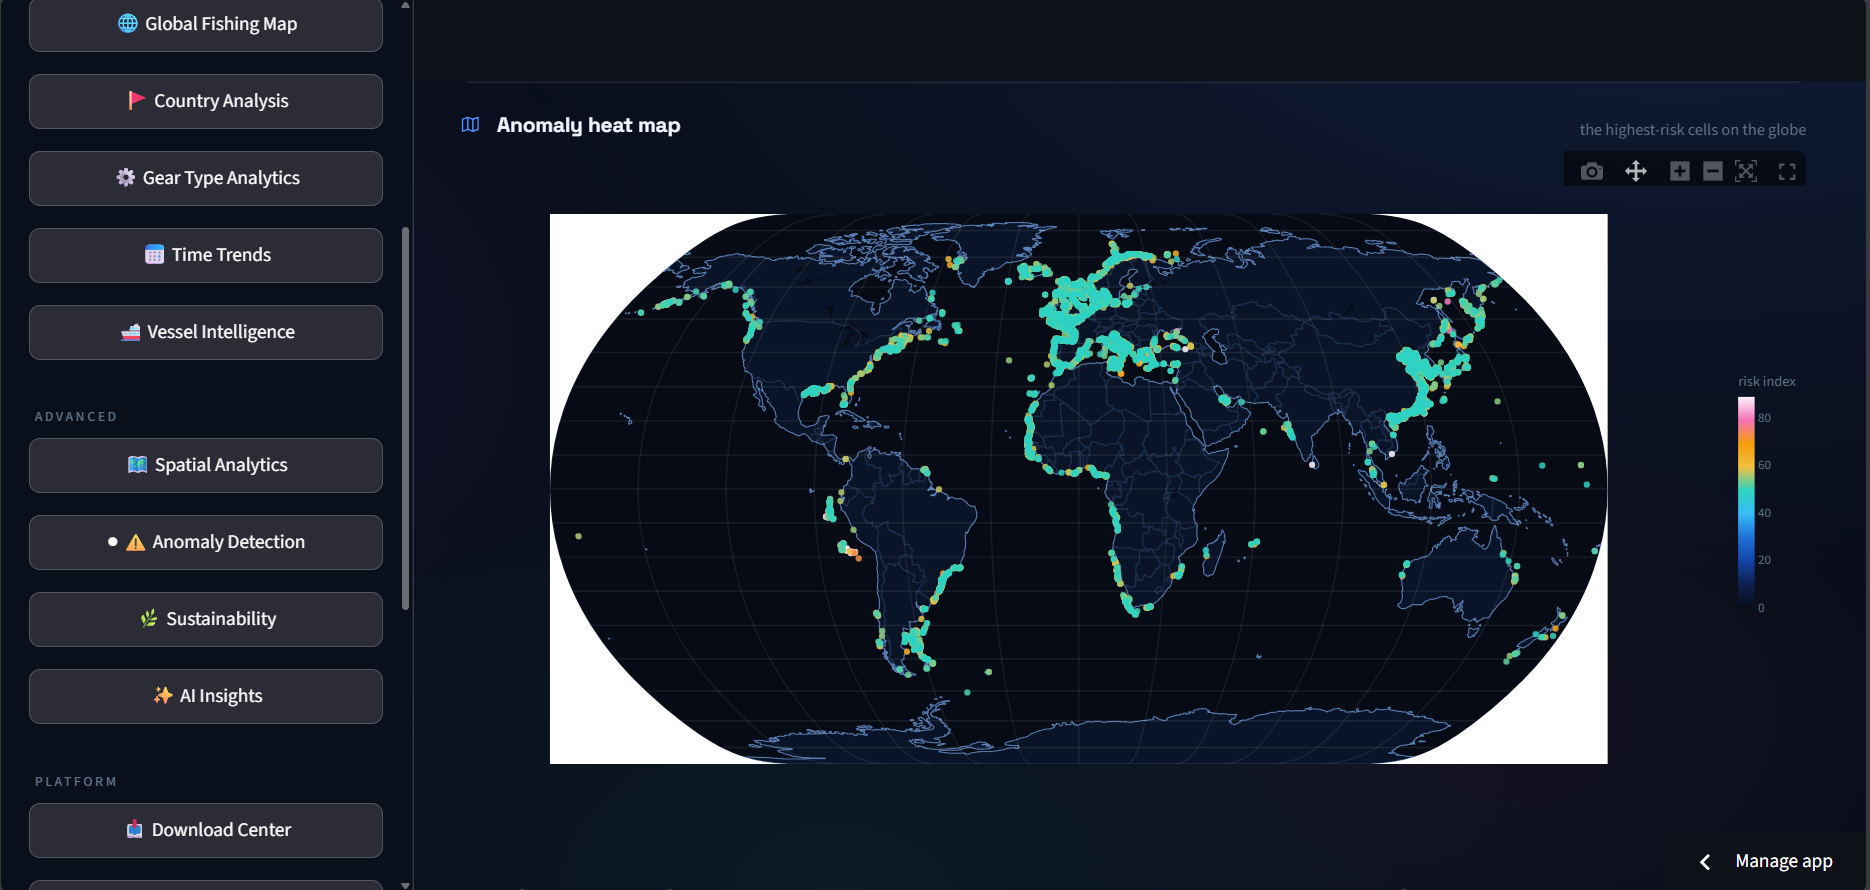
The Global Fishing Map visualizes fishing activity across the world's oceans.
Users can explore fishing effort at 0.1° spatial resolution, zoom into hotspots, and apply filters for:
- Date
- Flag state
- Gear type
- Ocean region
- Minimum fishing hours
- Vessel presence
This allows users to move from a global overview to specific fishing areas.
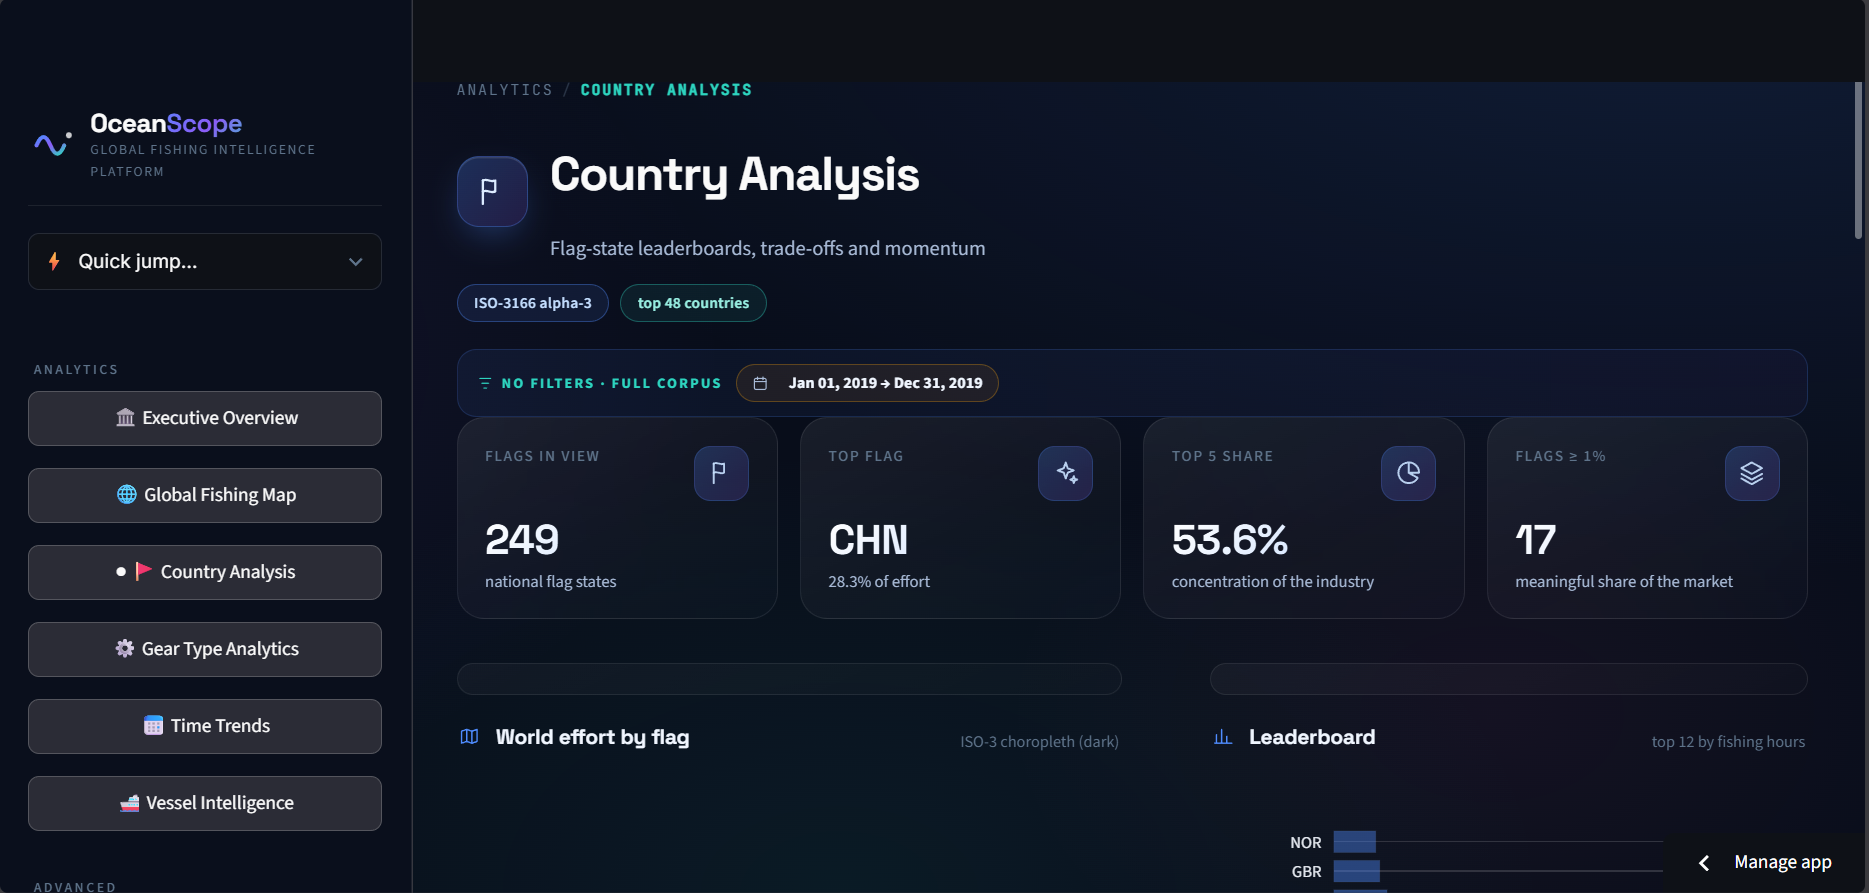
3. Country Analysis
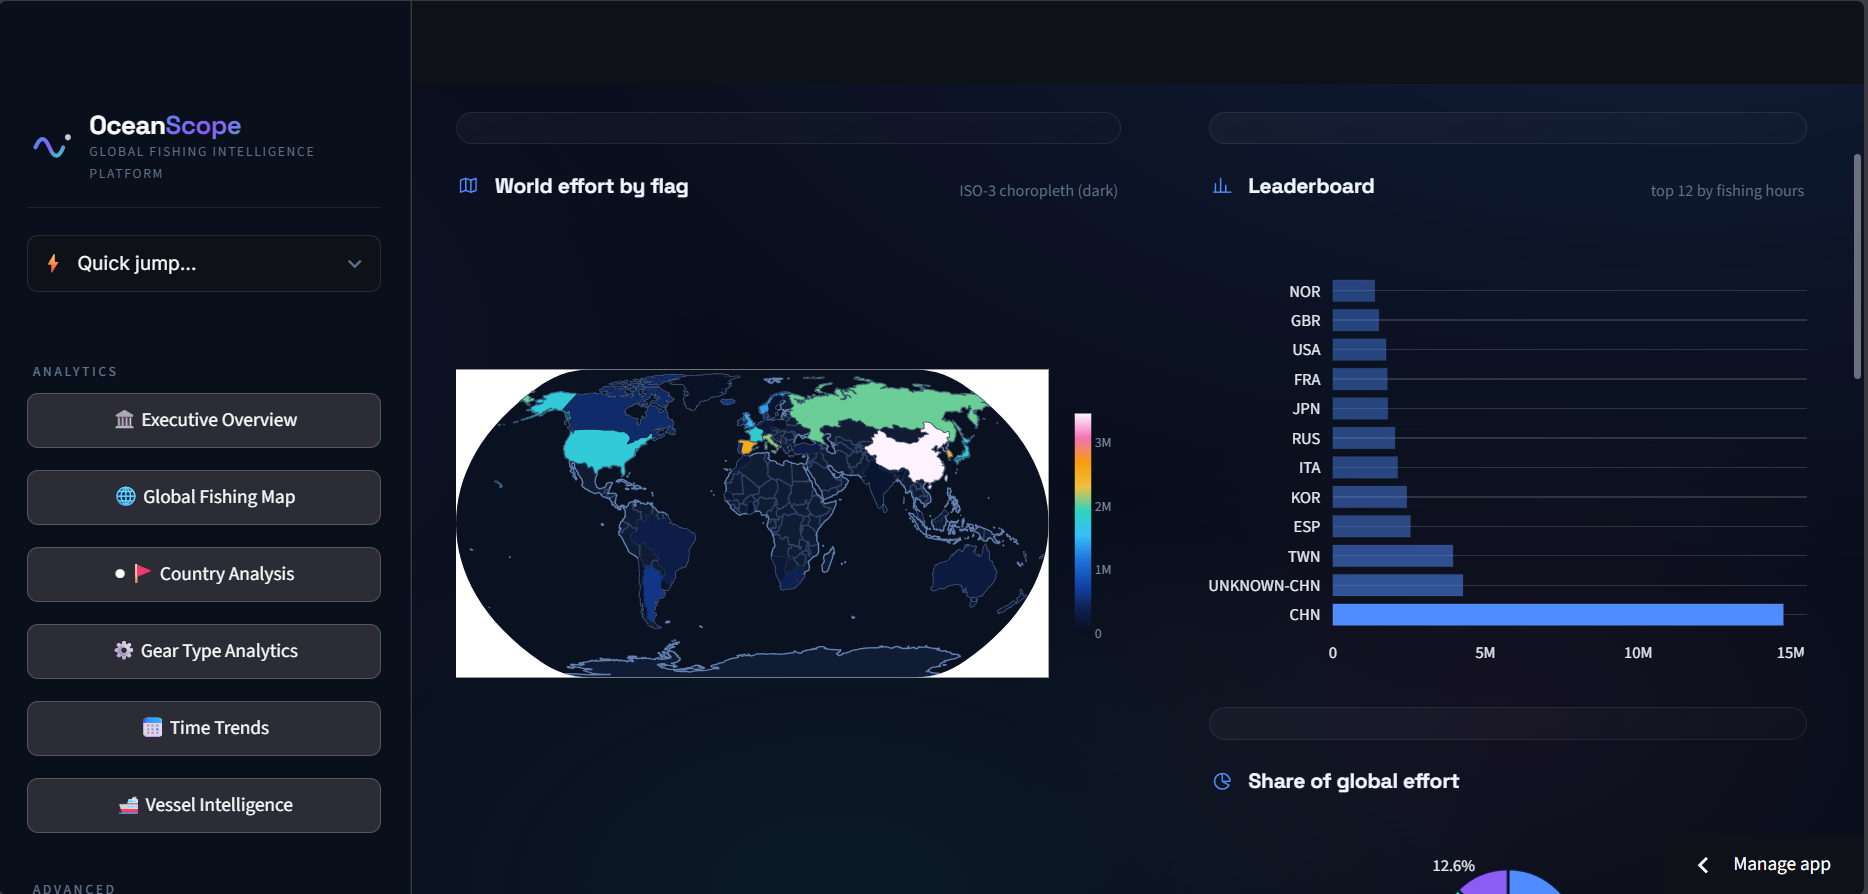
Country Analysis examines fishing activity by flag state.
It provides:
- Flag-state rankings
- Global effort share
- Choropleth visualization
- Flag → gear relationships
- Country comparisons
- Quarterly momentum
For example, our 2019 analysis shows that China accounts for 28.3% of global fishing effort, while the top five flag states account for 53.6%.
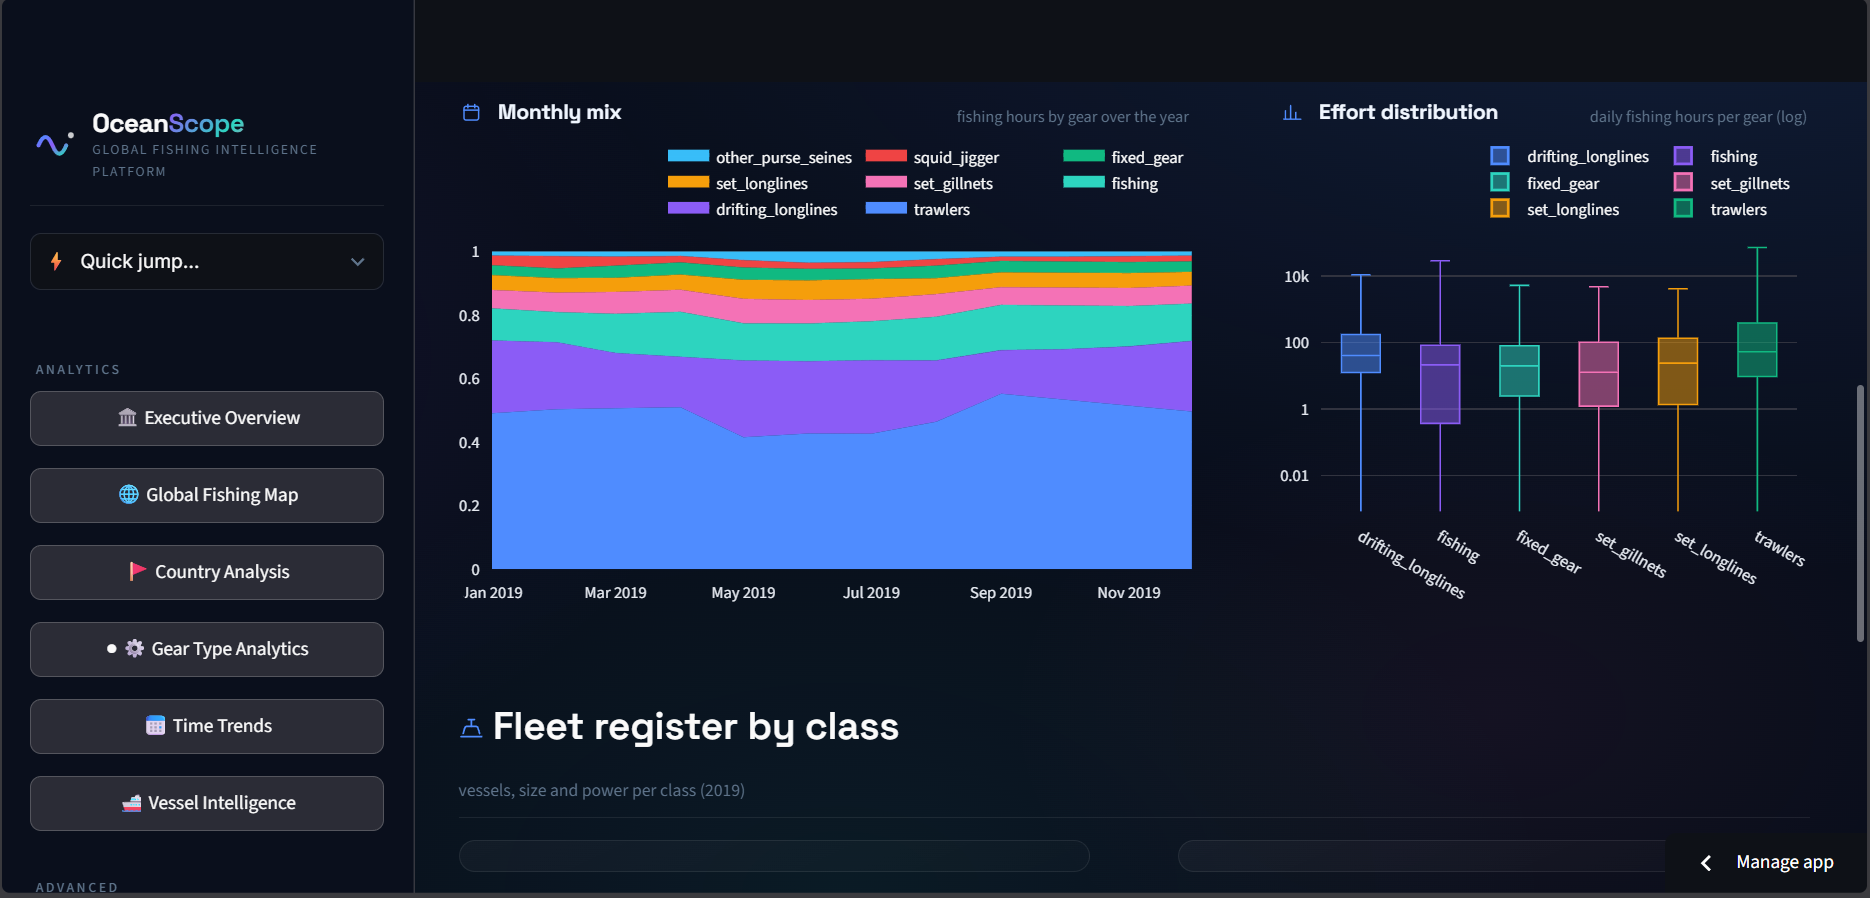
4. Gear Type Analytics
Fishing activity can also be analyzed by fishing method.
OceanScope supports 16 GFW gear classes and provides:
- Gear hierarchy
- Gear share
- Flag composition within gears
- Monthly gear trends
- Daily effort distributions
Trawlers represent approximately 47.4% of recorded fishing effort in the 2019 corpus.
5. Time Trends
The Time Trends module analyzes how fishing activity changes over time.
It includes:
- Daily fishing effort
- Moving averages
- Weekday patterns
- Year heatmaps
- Monthly changes
- Seasonal analysis
- Exploratory forecasting
This makes it possible to identify peaks, seasonal patterns, and changes in fishing intensity.
🚢 Vessel Intelligence
OceanScope connects fishing effort with vessel-level characteristics from the 2019 vessel register.
The platform analyzes:
- Vessel counts
- Flag distribution
- Vessel classes
- Vessel length
- Engine power
- Fishing utilization
The register contains approximately 68.5K unique vessels, with 87.6% reporting a fishing vessel type.
This helps bridge the gap between aggregated fishing activity and fleet-level characteristics.
🗺️ Spatial Analytics
The Spatial Analytics module transforms individual spatial observations into density patterns.
Using the 0.1° grid, OceanScope can identify:
- Dense fishing areas
- Fishing grounds
- Spatial hotspots
- Concentrated activity
- Regional patterns
This provides a higher-level view of where fishing activity is persistently concentrated.
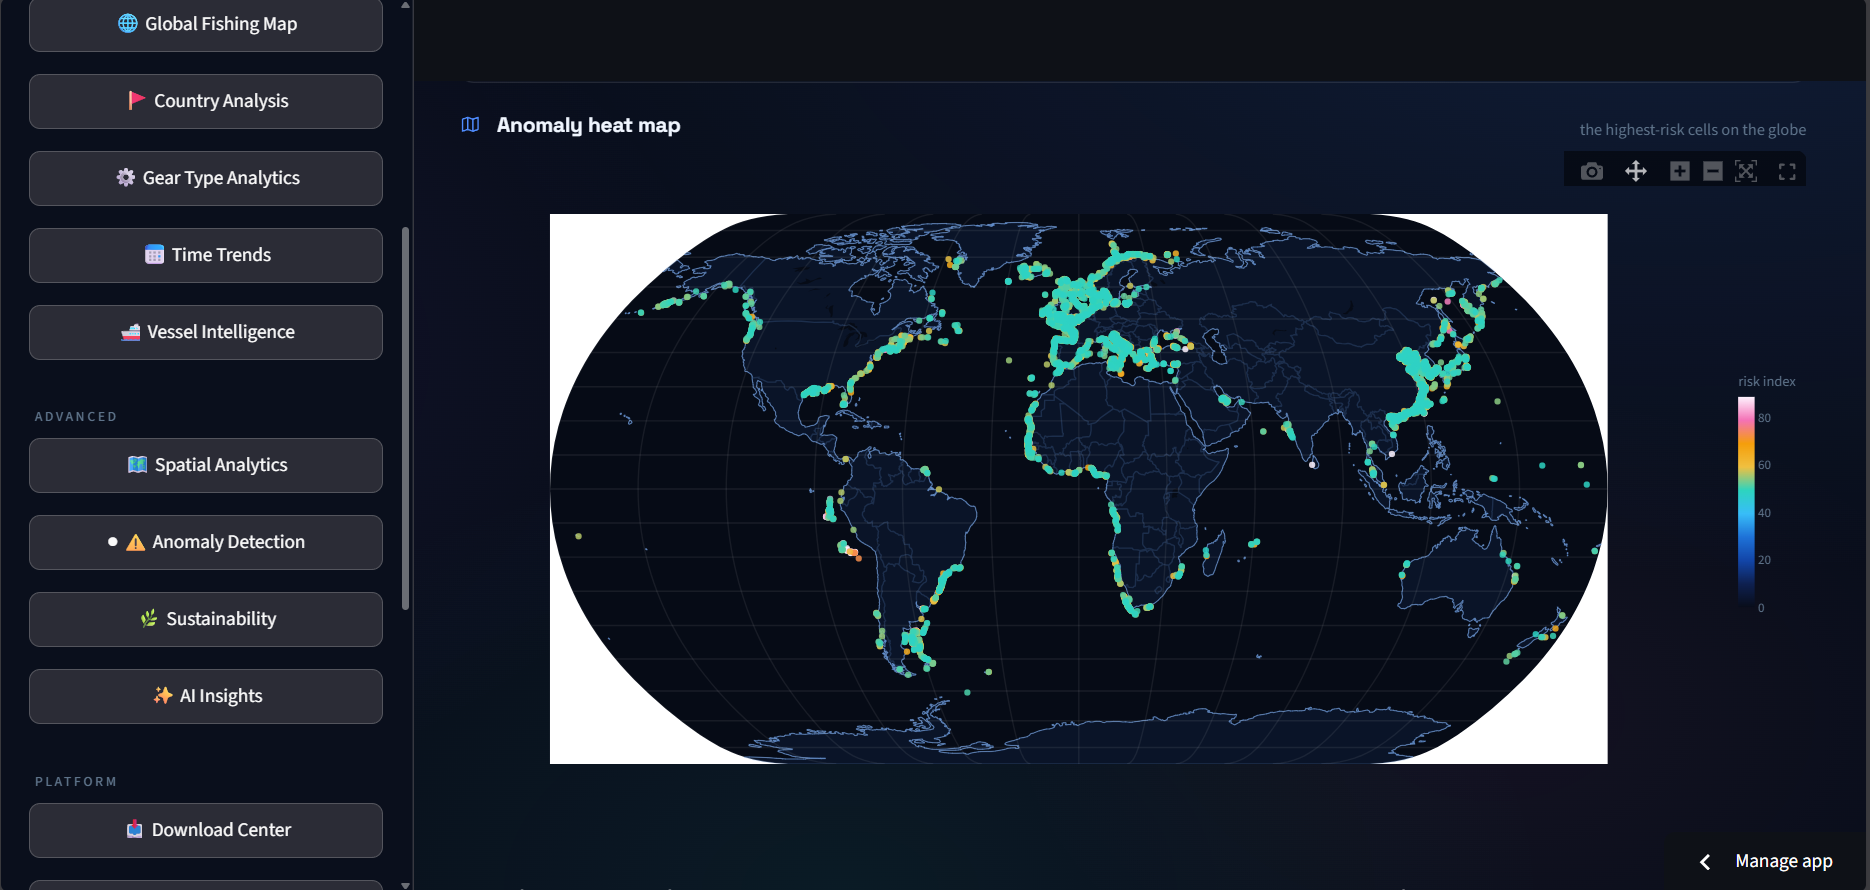
⚠️ Anomaly Detection
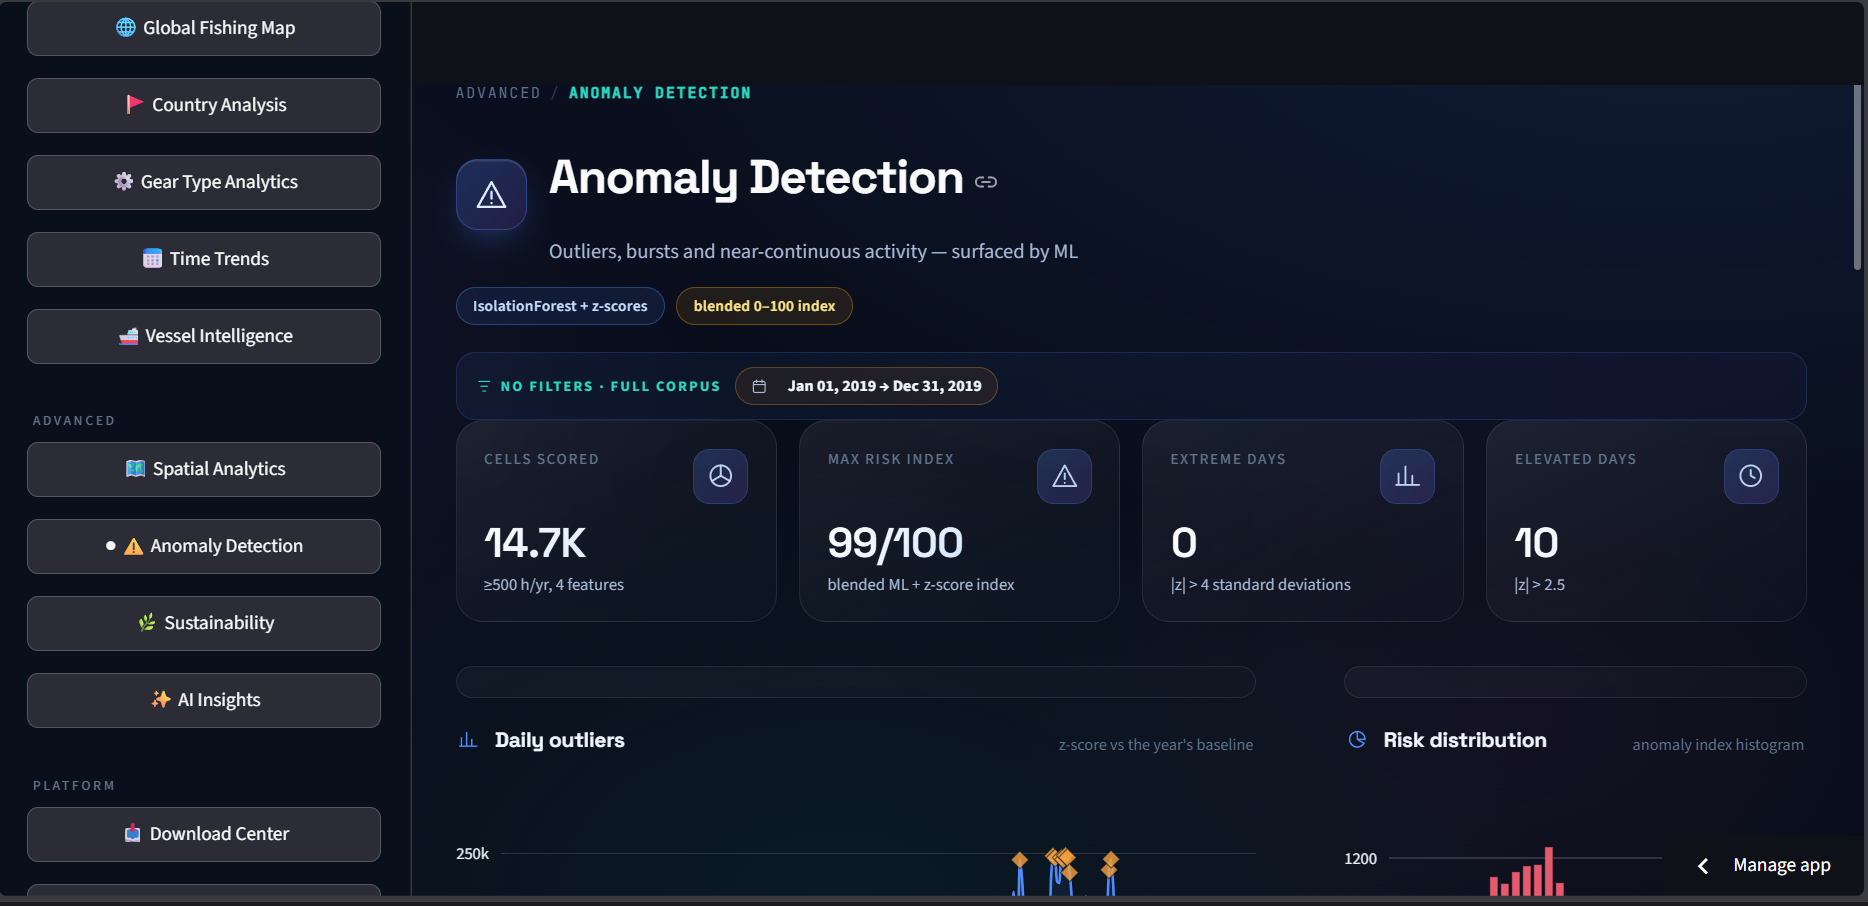
One of OceanScope's key intelligence features is anomaly detection.
We combine:
- Isolation Forest
- Statistical z-scores
- Multiple activity features
to generate an anomaly index and surface unusual spatial or temporal behavior.
The system can identify areas with unusually high activity and cells exhibiting near-continuous fishing ratios.
These results are intended as analytical signals for further investigation, not as automatic claims of illegal fishing.
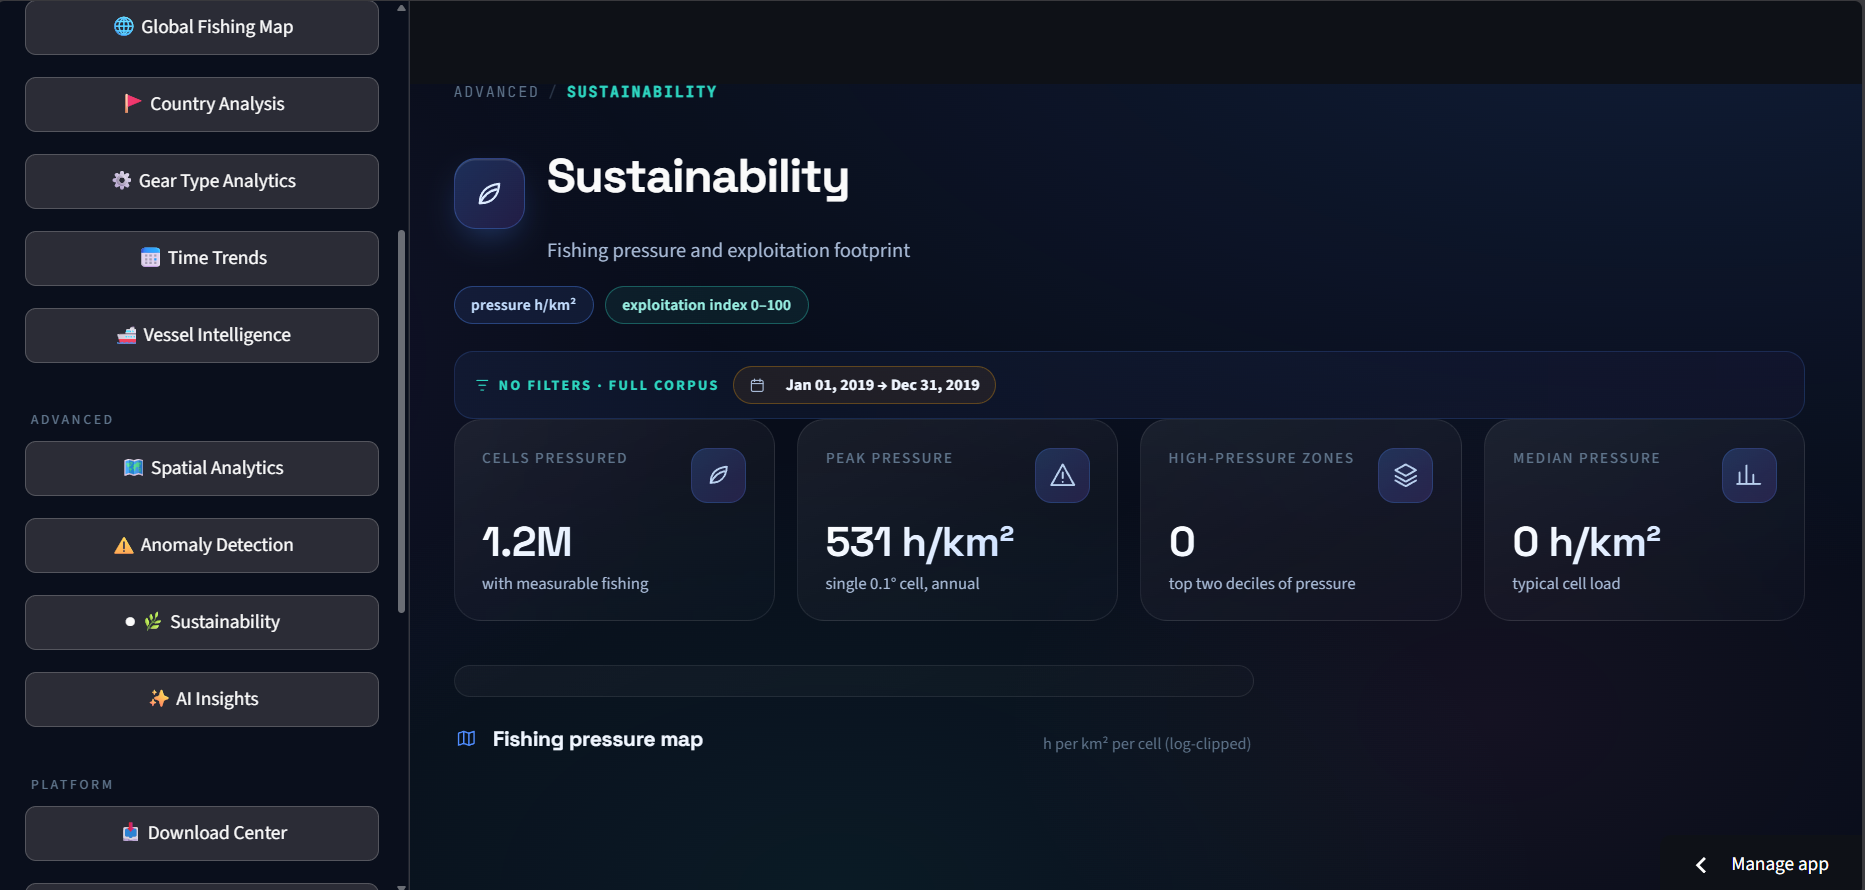
🌱 Sustainability Analytics
OceanScope also explores the environmental footprint of fishing activity.
The Sustainability module provides:
- Fishing pressure per km²
- Pressure distributions
- Fleet exploitation indicators
- Flag-level comparisons
- Fleet profiles
The exploitation metric is a composite analytical indicator combining factors such as fishing ratio, effort per vessel, gear concentration, and seasonality.
This provides a framework for comparing fishing intensity across fleets.
🤖 AI Insights
We wanted OceanScope to do more than display charts.
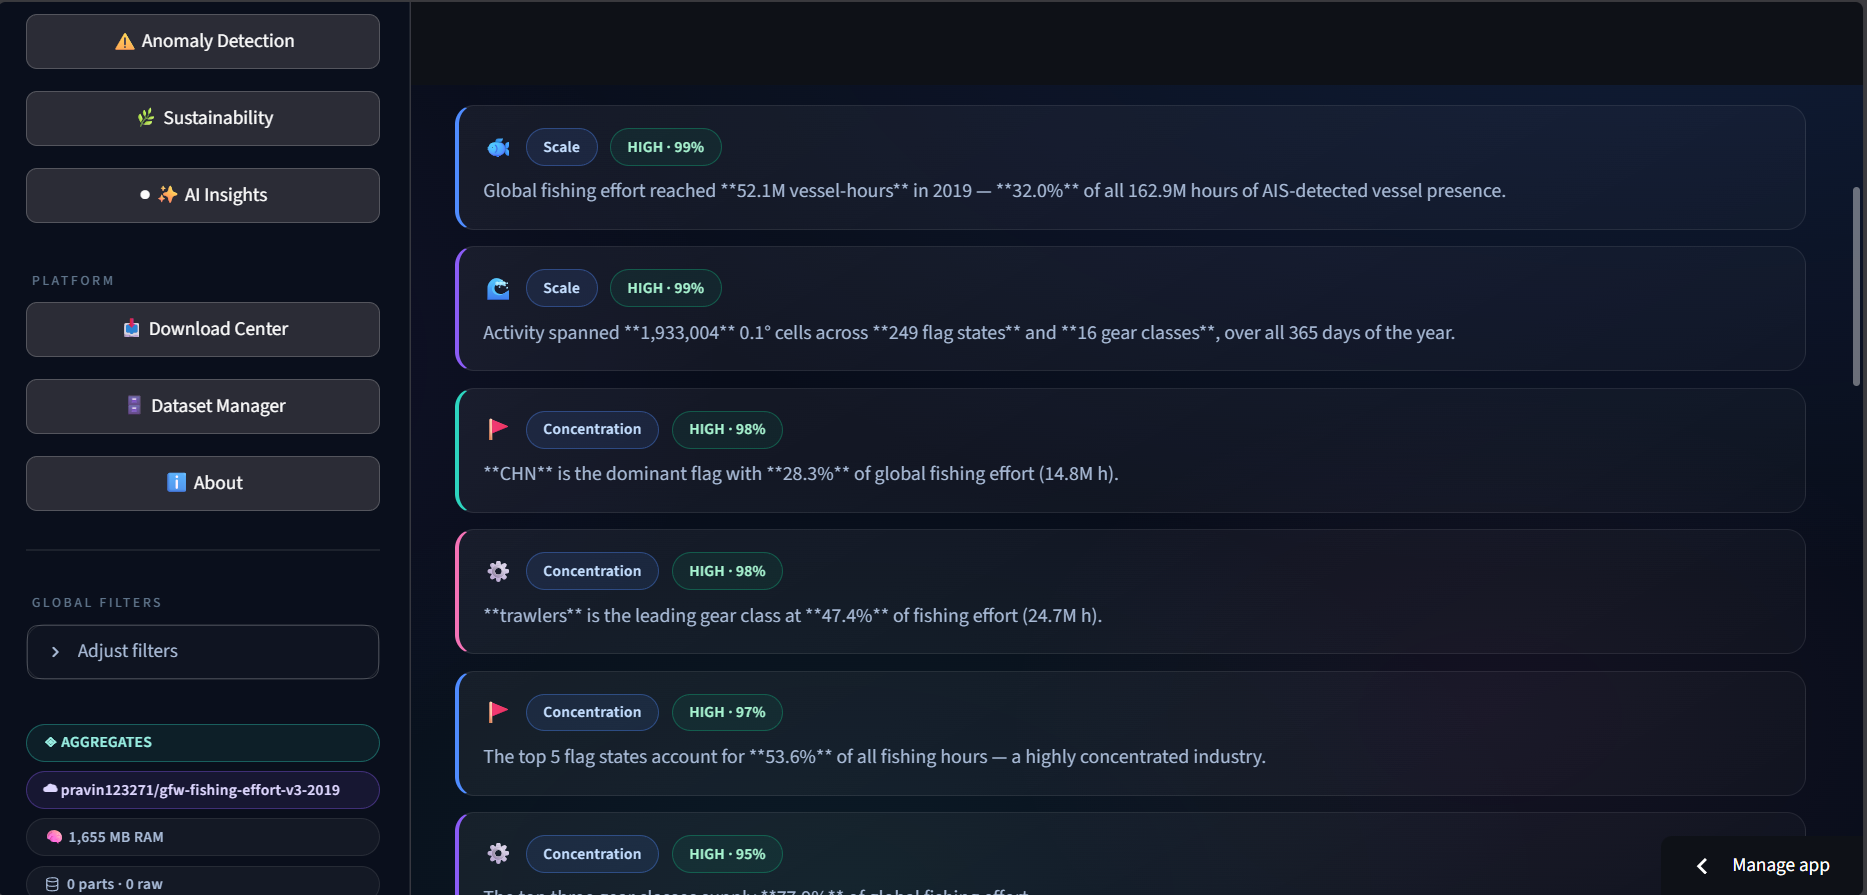
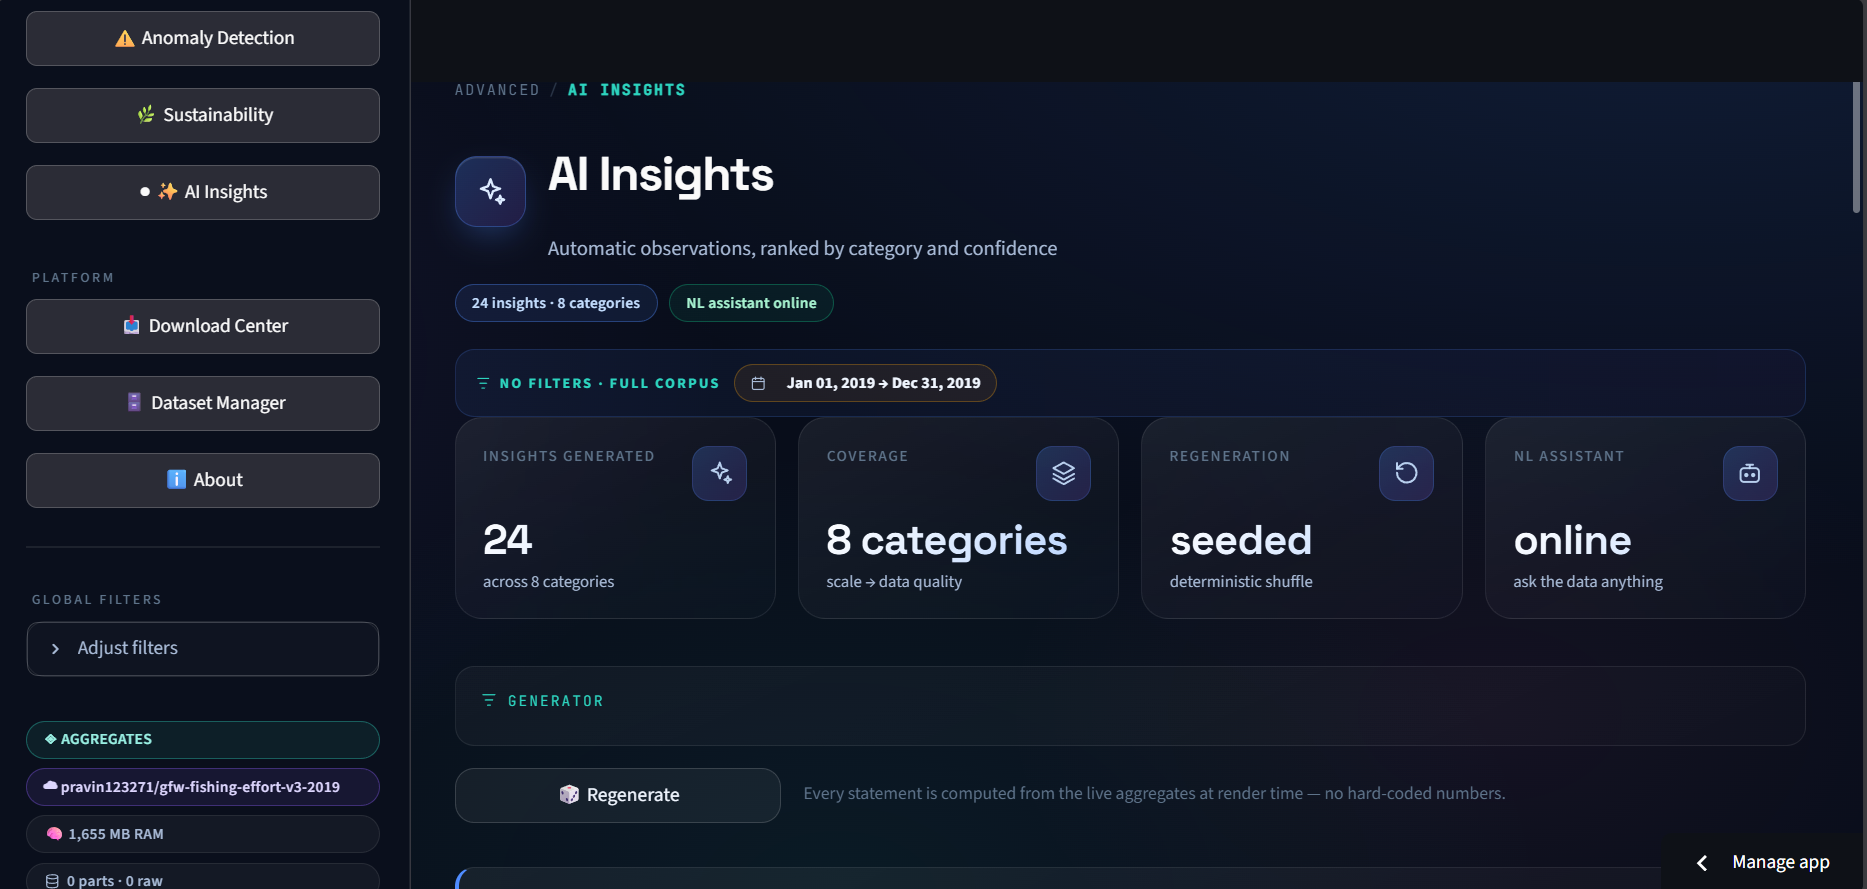
The AI Insights layer automatically generates observations from the computed aggregates.
Insights are categorized into areas such as:
- Scale
- Concentration
- Seasonality
- Spatial patterns
- Fleet behavior
- Anomalies
- Data quality
The platform also provides a natural-language interface where users can ask questions such as:
"Which country contributes the most fishing effort?"
"What is the dominant fishing gear?"
"When was fishing activity highest?"
Instead of manually searching through multiple charts, users can ask the data directly.
⚙️ How We Built It
OceanScope was designed around a high-performance analytical pipeline.
Data Layer
Global Fishing Watch v3.0
↓
Processing
Polars
↓
Analytical Engine
DuckDB
↓
Application
Streamlit
↓
Visualization
Plotly + deck.gl
↓
Intelligence
Statistical analysis + Isolation Forest + derived analytical indicators + natural-language insights
DuckDB allows analytical queries to be performed efficiently, while Polars provides high-performance dataframe processing.
Plotly powers interactive analytical charts, while deck.gl is used for large-scale geospatial visualization.
Streamlit ties the analytical and visualization layers together into a single interactive platform.
🧠 Why This Approach?
A major challenge was scale.
Large AIS-derived datasets are not practical to repeatedly load and manipulate directly inside an interactive dashboard.
We therefore designed OceanScope around pre-computed and queryable aggregates.
This allows the application to:
- Process large datasets efficiently.
- Reduce repeated computation.
- Apply filters dynamically.
- Keep visualizations responsive.
- Generate insights from the same underlying analytical layer.
The result is an interface that feels like an intelligence platform rather than a static dataset viewer.
🚀 What We Learned
Building OceanScope taught us that the difficult part of large-scale data applications is not simply creating charts.
The real challenge is designing the pipeline between:
Raw Data → Processing → Aggregation → Querying → Visualization → Intelligence
We learned how important data modeling, aggregation strategy, spatial resolution, query performance, and visualization design become when working with millions of records.
We also learned that analytical indicators need to be communicated carefully. Metrics such as anomaly and exploitation indices should be treated as signals for investigation rather than definitive conclusions.
🌍 Impact & Future Potential
OceanScope can evolve into a broader marine intelligence system.
Future versions could incorporate:
- Multi-year fishing activity
- Near-real-time AIS streams
- Protected marine areas
- Weather and ocean conditions
- Vessel ownership information
- Illegal, unreported, and unregulated fishing indicators
- Cross-year fleet behavior
- Advanced geospatial machine learning
- Automated alerts for emerging anomalies
- API access for researchers and organizations
The architecture is designed so that additional datasets and analytical modules can be integrated without rebuilding the entire platform.
🔗 Explore OceanScope
💻 Source Code
🌊 Live Platform
🗃️ Dataset
Global Fishing Watch v3.0 — 2019 Dataset
▶️ Demo Video
📊 Presentation
View the OceanScope Presentation
🏁 Final Thought
OceanScope started with a simple question:
What if massive global fishing data could be explored as easily as a modern analytics platform?
We built OceanScope to answer that question.
From raw AIS data to global fishing intelligence.
🌊 OceanScope
Built With
- ais
- artificial-intelligence
- data-science
- data-visualization
- deck.gl
- duckdb
- geospatial
- machine-learning
- marine-analytics
- plotly
- polars
- python
- streamlit
- sustainability


Log in or sign up for Devpost to join the conversation.