-
-
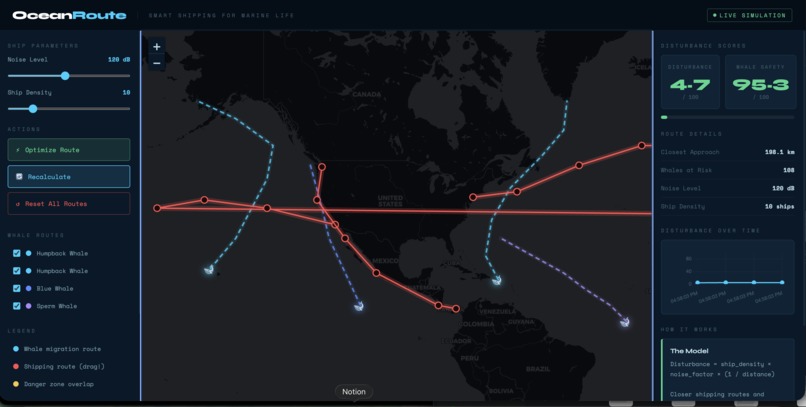
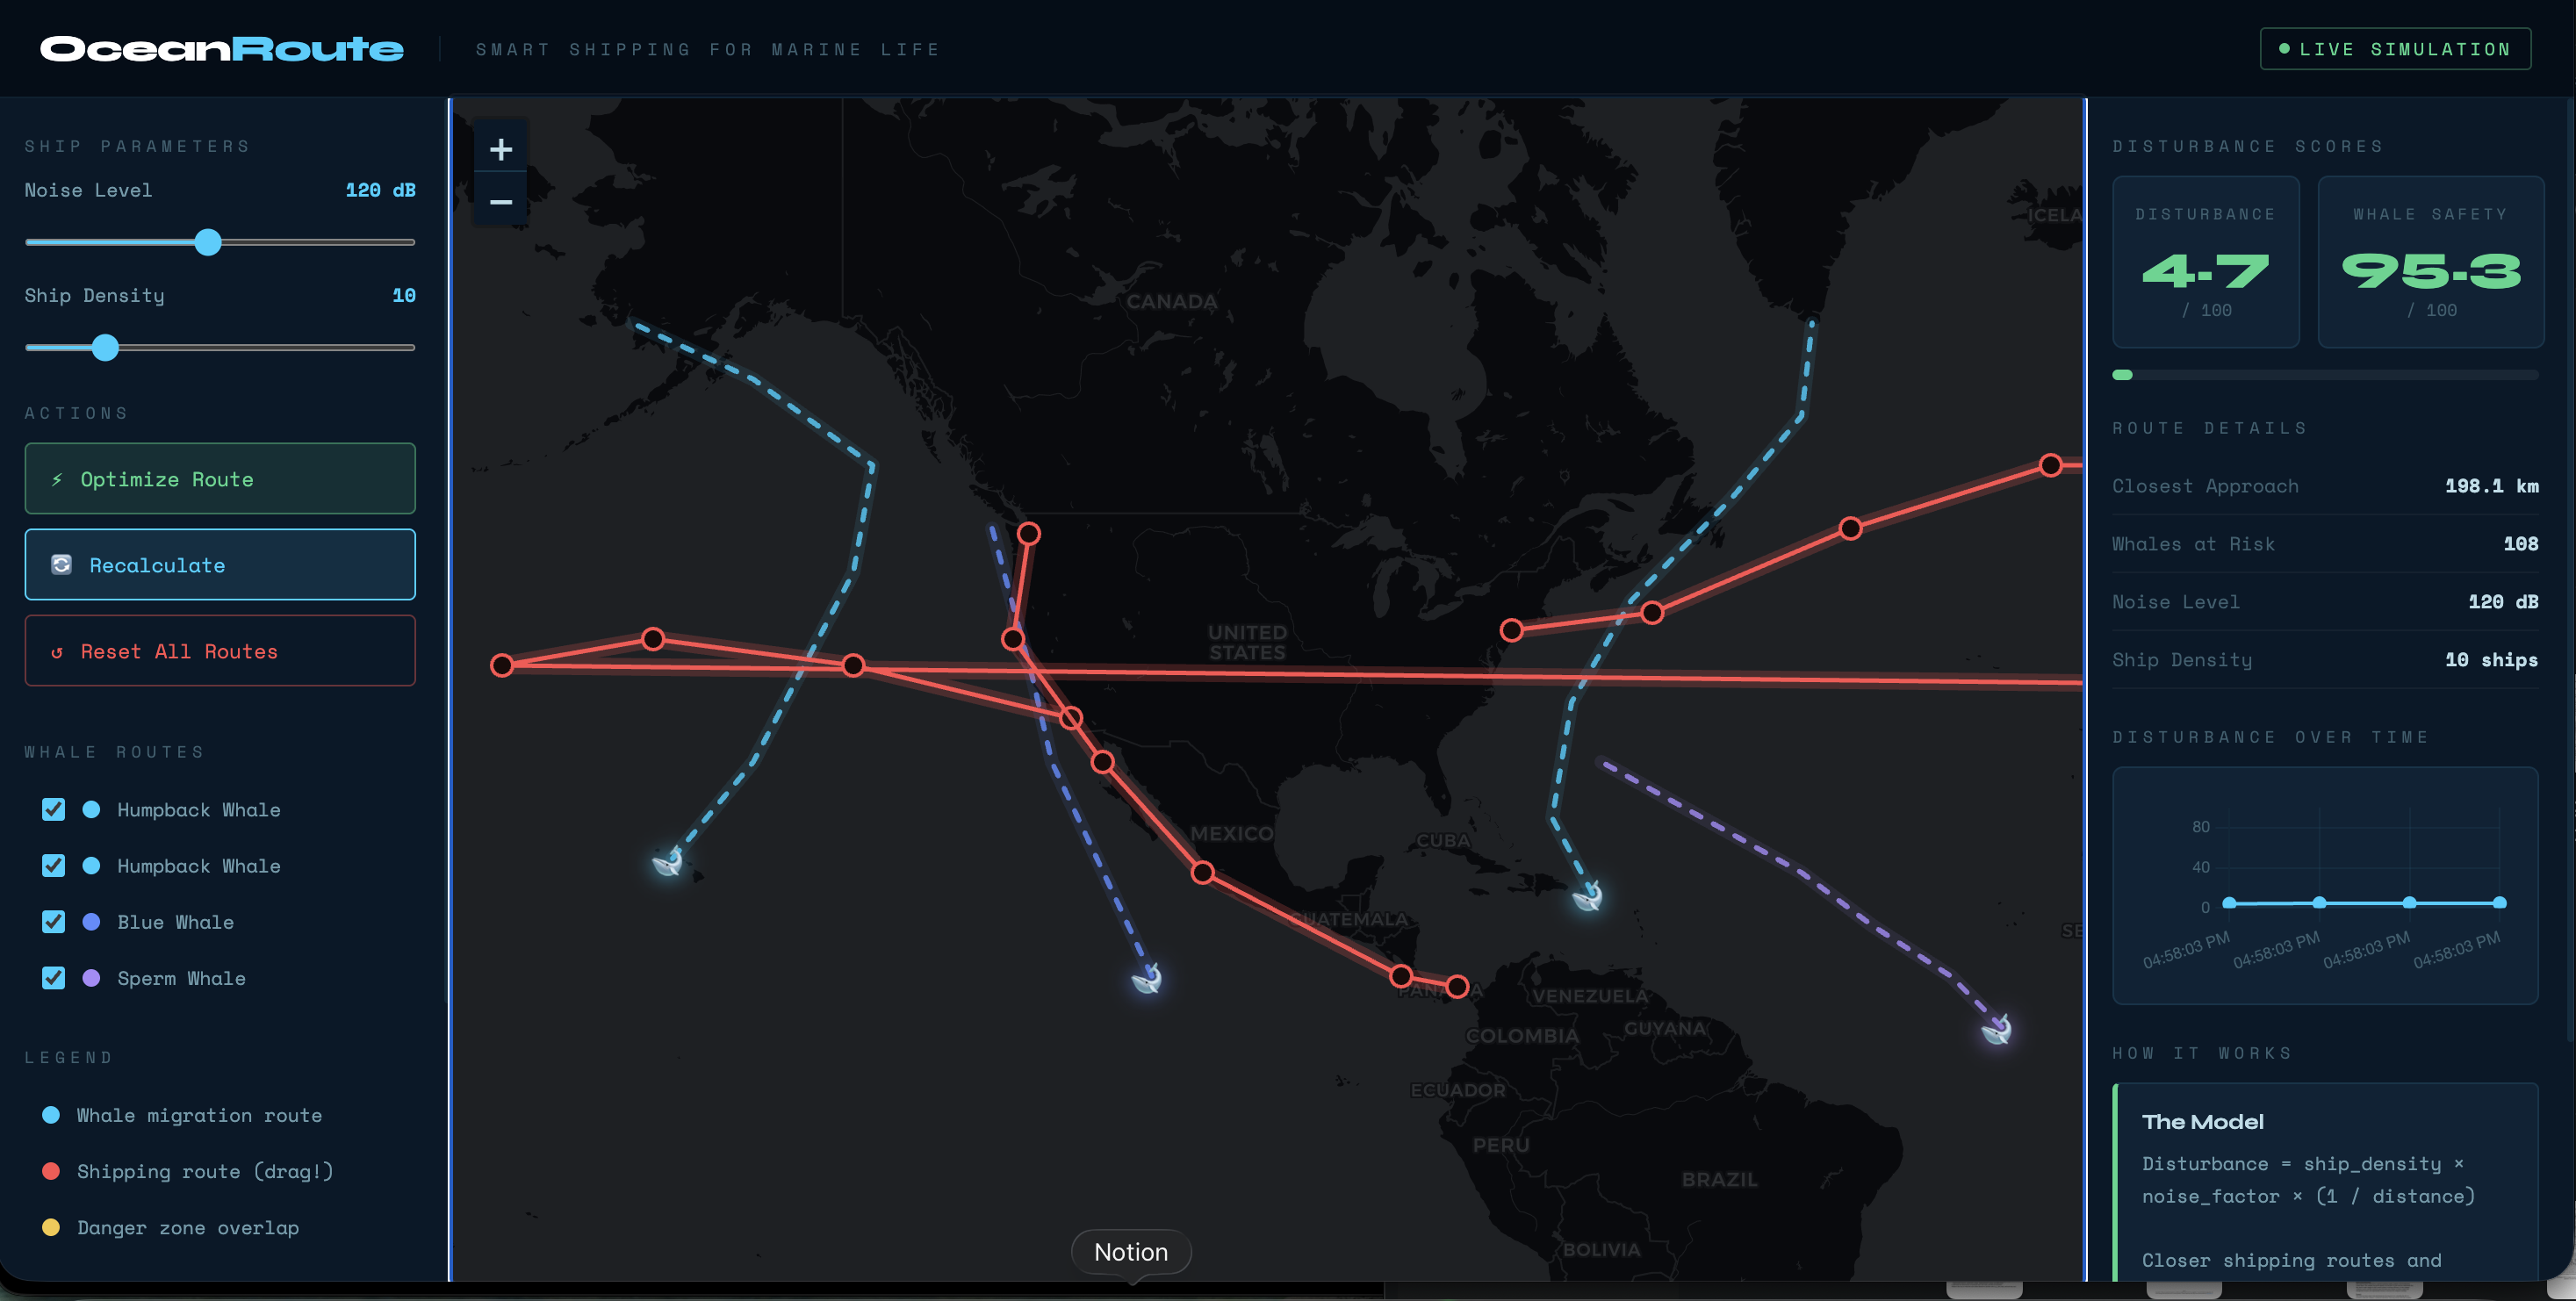
Screenshot of our app working
-
Our Logo
OceanRoute: Smart Shipping for Marine Life
Inspiration
We knew we wanted to do something ocean related for the theme, but we wanted it to actually mean something beyond just looking cool. One of us came across a statistic while researching that commercial cargo ships produce up to 190 decibels of underwater noise, which is louder than a jet engine. That led us down a rabbit hole about how whales communicate and navigate entirely through sound, and how shipping lanes cut straight through their migration corridors every single day.
What really got us was that nobody seems to be visualizing this overlap in a way that makes the impact obvious. Shipping routes are optimized for fuel and speed. Marine life is not part of that calculation at all. We thought if we could make the tradeoff visible and put a number on it, that was at least a step toward making it something people could actually act on.
What It Does
OceanRoute is an interactive data science dashboard that puts whale migration routes and commercial shipping lanes on the same world map and calculates a real time disturbance score based on how close they get to each other.
You can drag shipping route waypoints around the map and the score updates live through our Flask backend. There are sliders to adjust ship noise level and vessel density to reflect different traffic scenarios. An optimize button automatically shifts routes away from whale paths using a directional nudge algorithm. A Chart.js graph on the right side tracks how the disturbance score changes over time as you adjust routes so you can see the before and after of any decision.
The app includes four documented whale species and migration corridors: North Pacific Humpback, North Atlantic Humpback, Eastern Pacific Blue Whale, and Tropical Atlantic Sperm Whale, with coordinates sourced from NOAA cetacean tracking data.
How We Built It
The backend is Python and Flask with two API endpoints, /calculate-disturbance and /optimize-route. The disturbance model runs in plain Python with no external ML libraries. Geographic distances are calculated using the Haversine formula, which accounts for the curvature of the Earth and returns accurate kilometer distances. We initially used flat Euclidean distance between coordinates and it produced completely wrong numbers at ocean scale, so switching to Haversine was one of the more important fixes we made.
The disturbance score is based on three factors: ship density, noise level, and the minimum distance between the shipping route and the nearest whale migration point.
$$\text{disturbance_score} = f_{\text{density}} \times f_{\text{noise}} \times f_{\text{overlap}}$$
$$f_{\text{density}} = \frac{\text{ship_density}}{50}, \quad f_{\text{noise}} = \frac{\text{noise_level} - 50}{150}, \quad f_{\text{overlap}} = \frac{1}{d_{\min} + 1}$$
The minimum distance \(d_{\min}\) is calculated with Haversine
$$a = \sin^2!\left(\frac{\Delta\phi}{2}\right) + \cos\phi_1 \cdot \cos\phi_2 \cdot \sin^2!\left(\frac{\Delta\lambda}{2}\right), \quad d = 2R \arctan\left(\sqrt{\frac{a}{1-a}}\right)$$
The frontend is HTML, CSS, and vanilla JavaScript. Leaflet.js handles the interactive map and the draggable waypoint markers. Every drag fires a POST request to Flask which returns the updated score. We separated live drag updates from full recalculations to avoid lag. Chart.js renders the disturbance history graph. All route data is stored as JSON and served statically.
Challenges We Ran Into
Calibrating the disturbance model was a big challenge we faced which was harder than we expected. The first version of the outputting scores was from 0.003 to 12000 which depending on the inputs, made the 0 to 100 scale meaningless. We continuously adjusted to the scaling factors until the output had matched the commonsense: a route cutting through a migration corridor will score in the danger range, a route 500 kilometers away scores low. Getting that to feel right took a lot of iteration.
We tried to make the drag interaction feel as responsive as possible and this was also a challenge. By firing a full API call on every mouse it created a noticeable lag. To resolve this we split it into a lightweight live update during the drag and we also did a full recalculation with chart update on each mouse release.
The most technically challenging part was understanding the Haversine formula without any prior understanding. It was our first time working with spherical trigonometry before and because of that it took us more time to actually get it to work correctly.
What We Learned
None of us had built a Flask REST API before so learning how the backend communicates with the frontend through fetch requests was a big part of this. We also had no prior experience with geographic distance calculations or the Haversine formula, and working through it helped us understand why coordinate math breaks down at global scales.
The bigger takeaway was less technical. When we actually plotted real shipping lanes next to real whale migration corridors, the overlap was worse than any of us expected. Knowing abstractly that shipping affects marine life is different from seeing a transoceanic trade route pass directly through a documented humpback migration corridor on a map.
What's Next for OceanRoute
The most useful next step would be integrating real AIS data, which is the live GPS broadcast that commercial ships transmit publicly. That would turn OceanRoute from a simulation into a real time monitoring tool. We would also want to add seasonal variation to the whale routes since migration corridors shift by month, and a cost calculator that shows how much extra fuel a rerouted ship uses versus the conservation benefit. Longer term we think a tool like this could support the case for expanding the IMO's voluntary whale safe zones into mandatory routing regulations.
Built With
Python, Flask, JavaScript, Leaflet.js, Chart.js, HTML, CSS
Built in 24 hours at SMathHacks 2026, Data Science Track by Aneesh Pudipeddi, Dhruv Mishra, Arjun Patel, and Sashank Kondraju


Log in or sign up for Devpost to join the conversation.