-
-
OceanGuard Landing Page
-

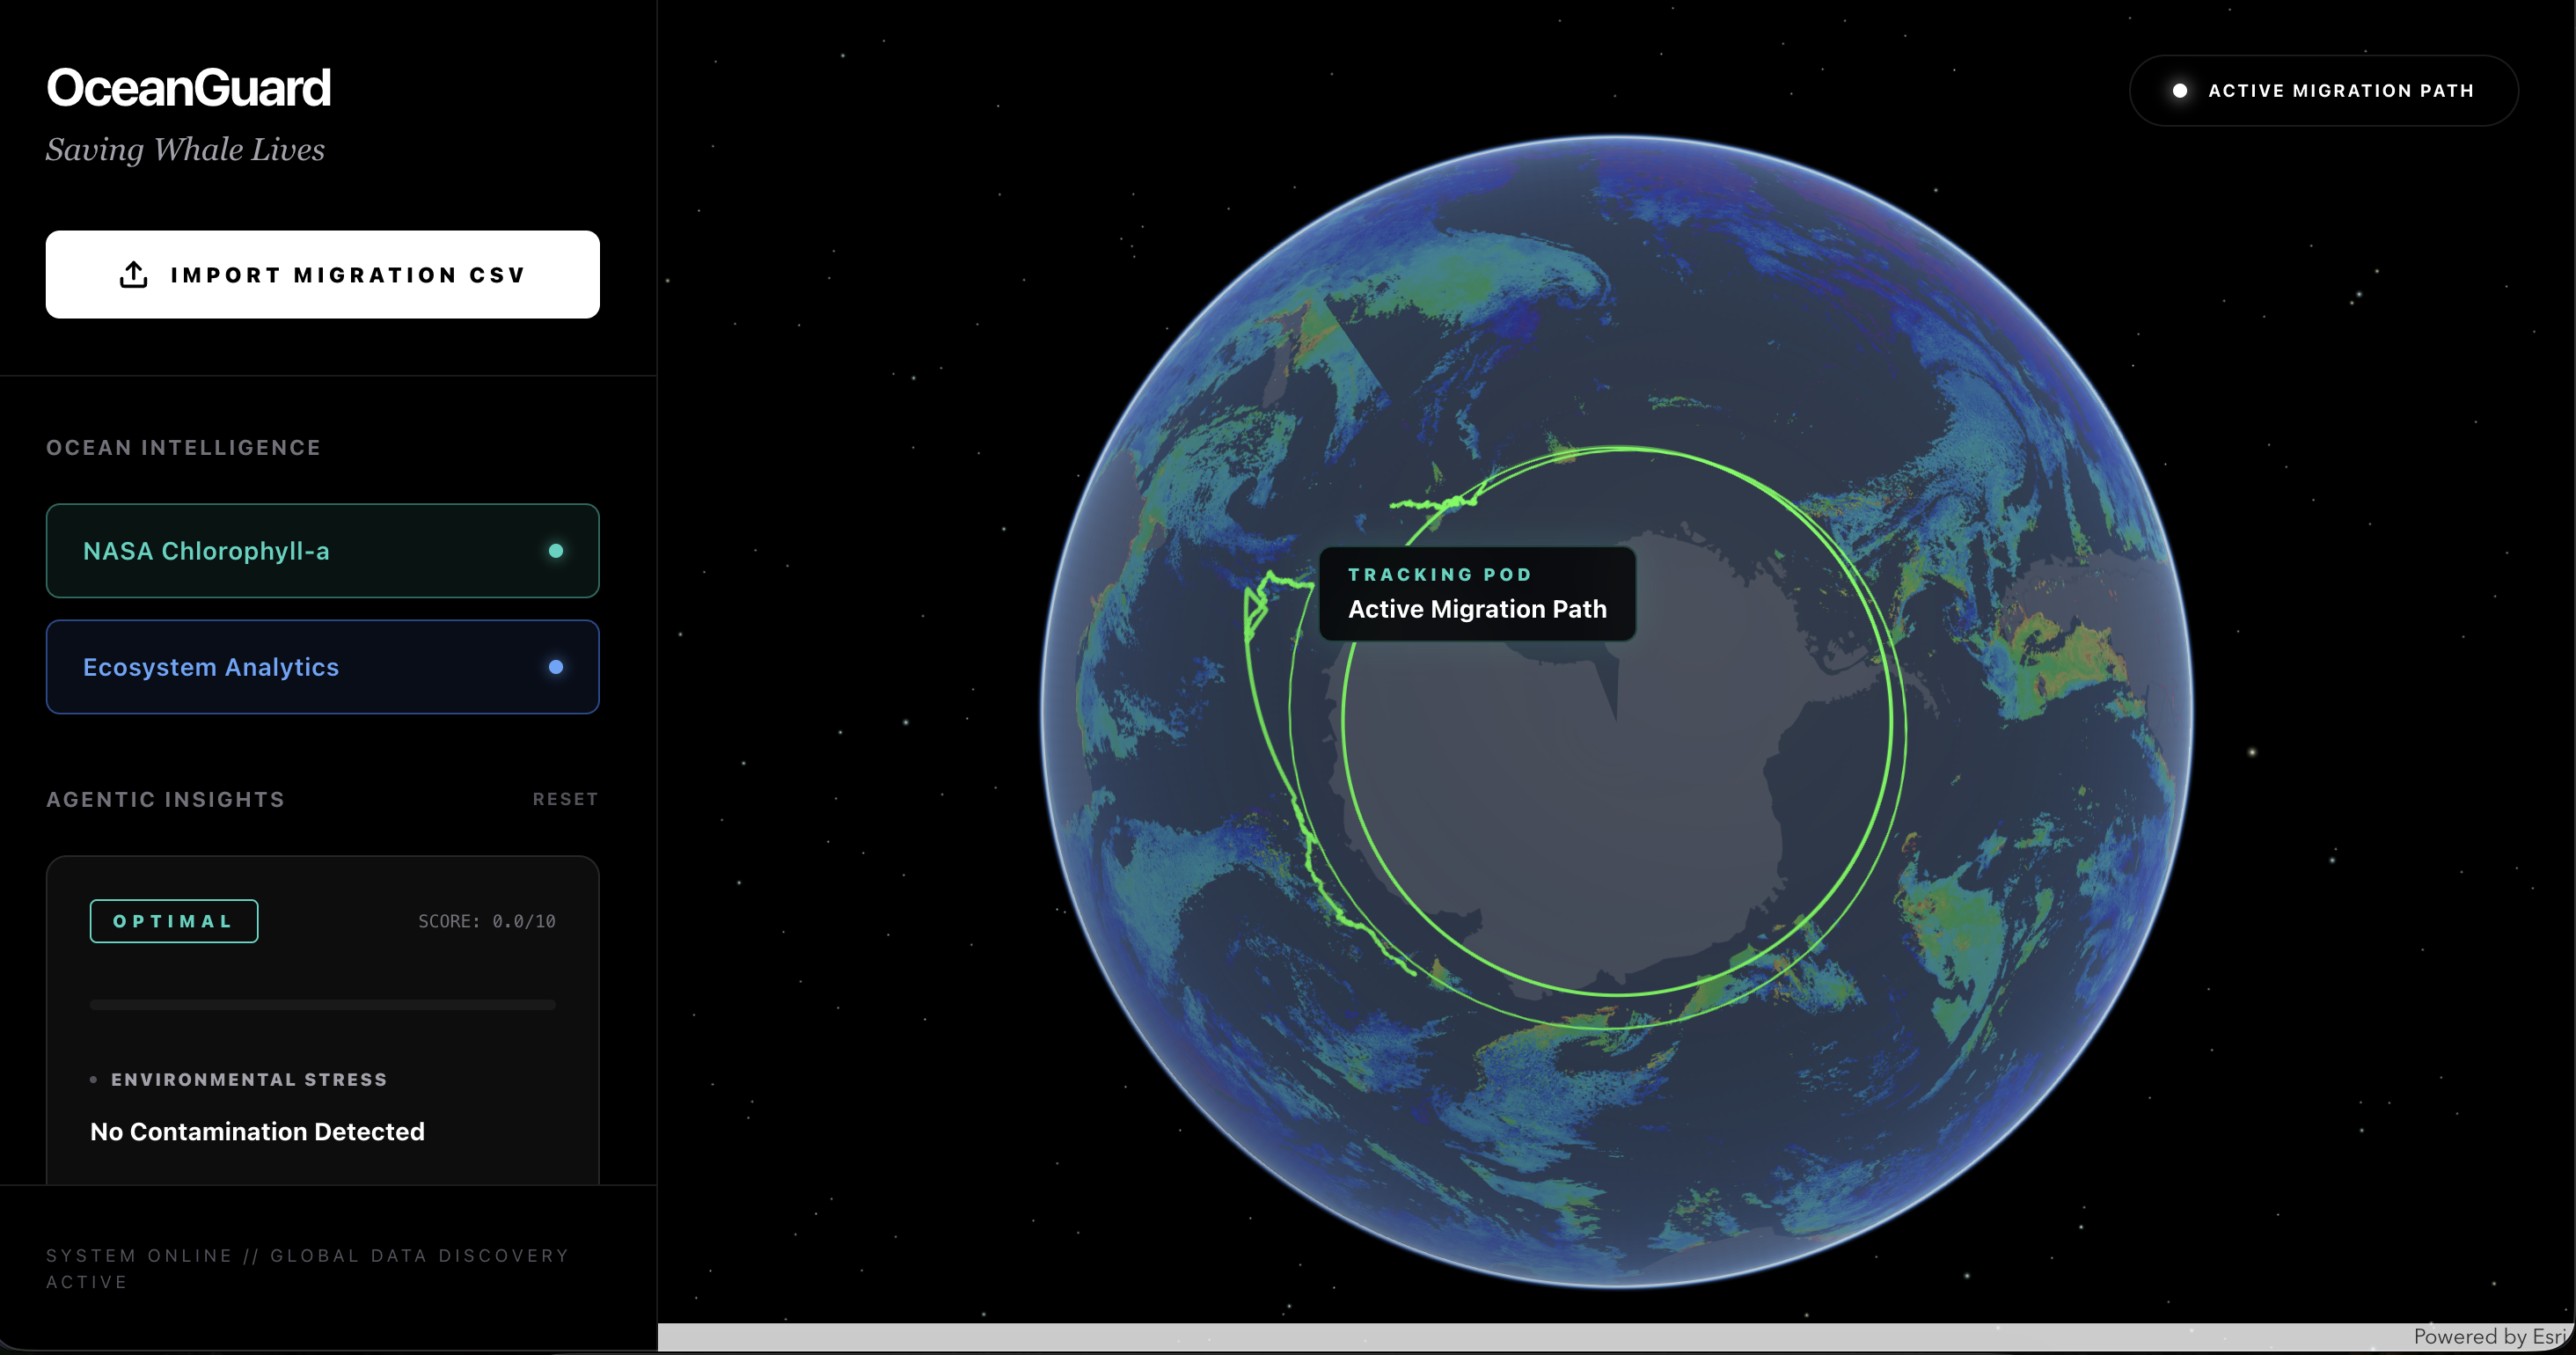
Metric Dashboard

OceanGuard: Agentic Marine Life Protection
Inspiration
Every year, thousands of marine mammals are lost to the "invisible threats" of the ocean: massive garbage patches and environmental contamination zones that overlap with ancient migration routes. We wanted to build a tool that didn't just visualize data, but acted as an AI-driven guardian—predicting risks and providing actionable intelligence before tragedy strikes.
What it does
OceanGuard is a high-fidelity geospatial dashboard that tracks whale migration pods across a 3D digital twin of our oceans. Using real-time data and agentic AI, it:
- Visualizes Ecosystem Stress: Integrates NASA Chlorophyll-a data and global contamination zones.
- Agentic Insights: Uses Gemini 2.0 Flash to perform deep-reasoning impact assessments on specific whale pods.
- Spatial Intelligence: Calculates complex intersections between biological migration paths and environmental hazards using
turf.js. - Global Fleet Analysis: Provides a system-wide risk score for all tracked marine life, synthesizing thousands of data points into a single "Intelligence Feed."
- User-Driven Research: Enables researchers to upload custom migration CSVs, instantly visualizing new paths and analyzing their spatial awareness relative to existing trash and debris obstacles.
How we built it
- Frontend: React + Vite with a custom "Cinematic Dark" design system.
- Geospatial Engine: ArcGIS Maps SDK for JavaScript for the 3D global visualization.
- Intelligence: Node.js backend integrating the Google Gemini API for agentic reasoning.
- Data: Custom GeoJSON processing for whale pods, garbage patches, and ecosystem markers.
- Styling: Vanilla CSS with glassmorphism and modern typography (Inter/Outfit).
Challenges we ran into
- ArcGIS Integration Hurdles: We initially faced significant difficulties setting up the full ArcGIS software suite. We eventually pivoted to using the ArcGIS Maps SDK packages directly. However, this meant we couldn't easily utilize their pre-provided datasets, forcing us to hunt down raw, open-source oceanographic data across the web and manually convert it into a publishable GeoJSON format.
- Real-time Spatial Math: Calculating intersections between multi-segment LineStrings and complex Polygons on a global scale required optimizing our spatial logic.
- AI Structured Output: Ensuring the Gemini model consistently returned valid JSON reports for our dashboard UI required rigorous prompt engineering.
Accomplishments that we're proud of
- High-Fidelity UI: We moved beyond "standard dashboard" aesthetics to create a premium, immersive experience that feels like a mission control for the planet.
- AI-Human Collaboration: The "Agentic Insights" panel effectively translates complex spatial data into readable, professional-grade reports.
- Performance: Smooth 3D rendering of global migration paths with real-time HUD overlays.
- Dynamic Spatial Awareness: Our custom CSV parser allows users to drop in their own dataset and immediately see how those specific pods interact with global pollution hotspots.
What we learned
- The power of Agentic AI in geospatial contexts—LLMs are incredible at interpreting spatial relationships when provided with the right geometric context.
- The intricacies of the ArcGIS Maps SDK and how to push its 3D rendering capabilities for cinematic storytelling.
What's next for OceanGuard
- Acoustic Stress Monitoring: Integrating live hydrophone data to track noise pollution risks.
- Predictive Rerouting: Using AI to suggest alternative migration corridors for vessels to avoid active whale pods.
Built With
- esri
- express.js
- geminiapi
- javascript
- nasa-api
- node.js
- papaparse
- react
- turf.js
- vite

Log in or sign up for Devpost to join the conversation.