-
-
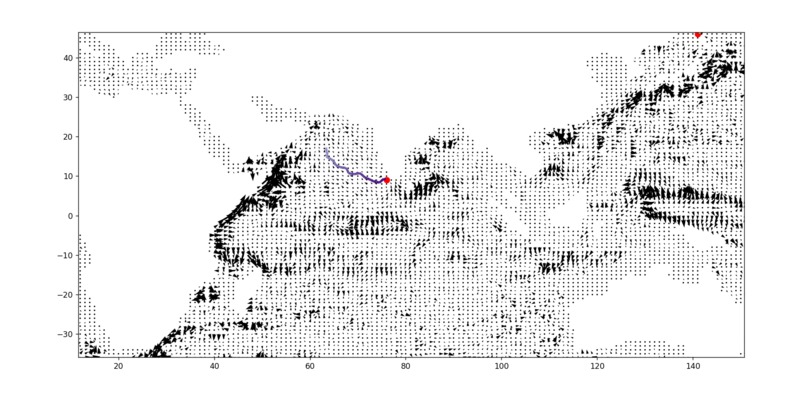
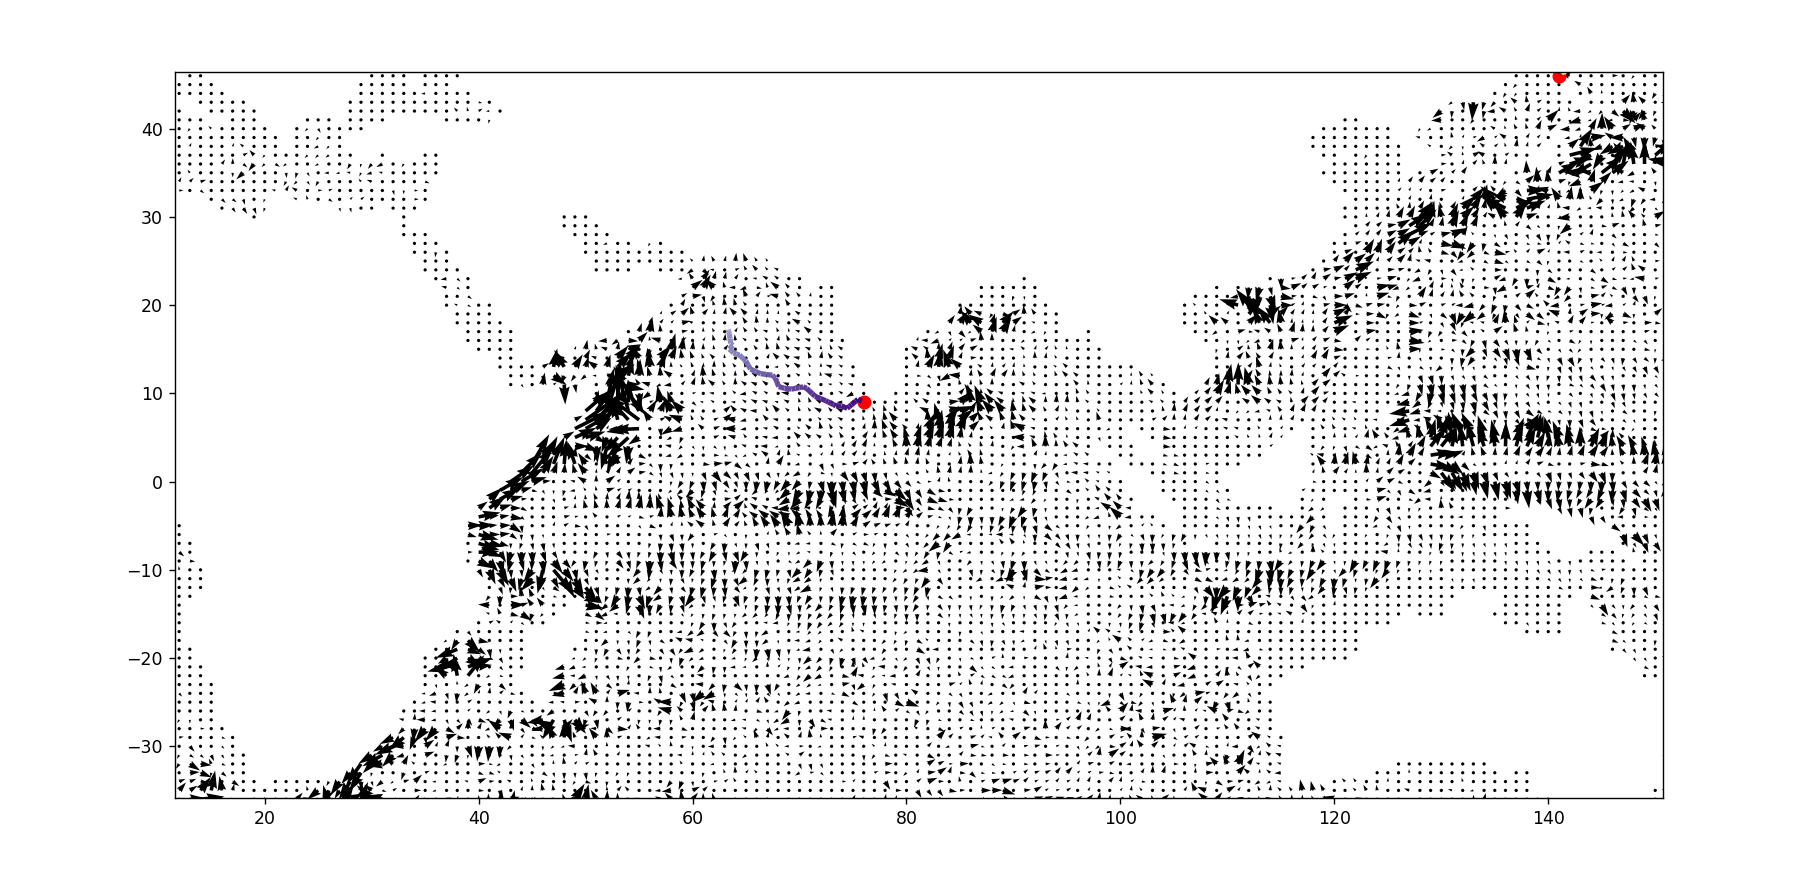
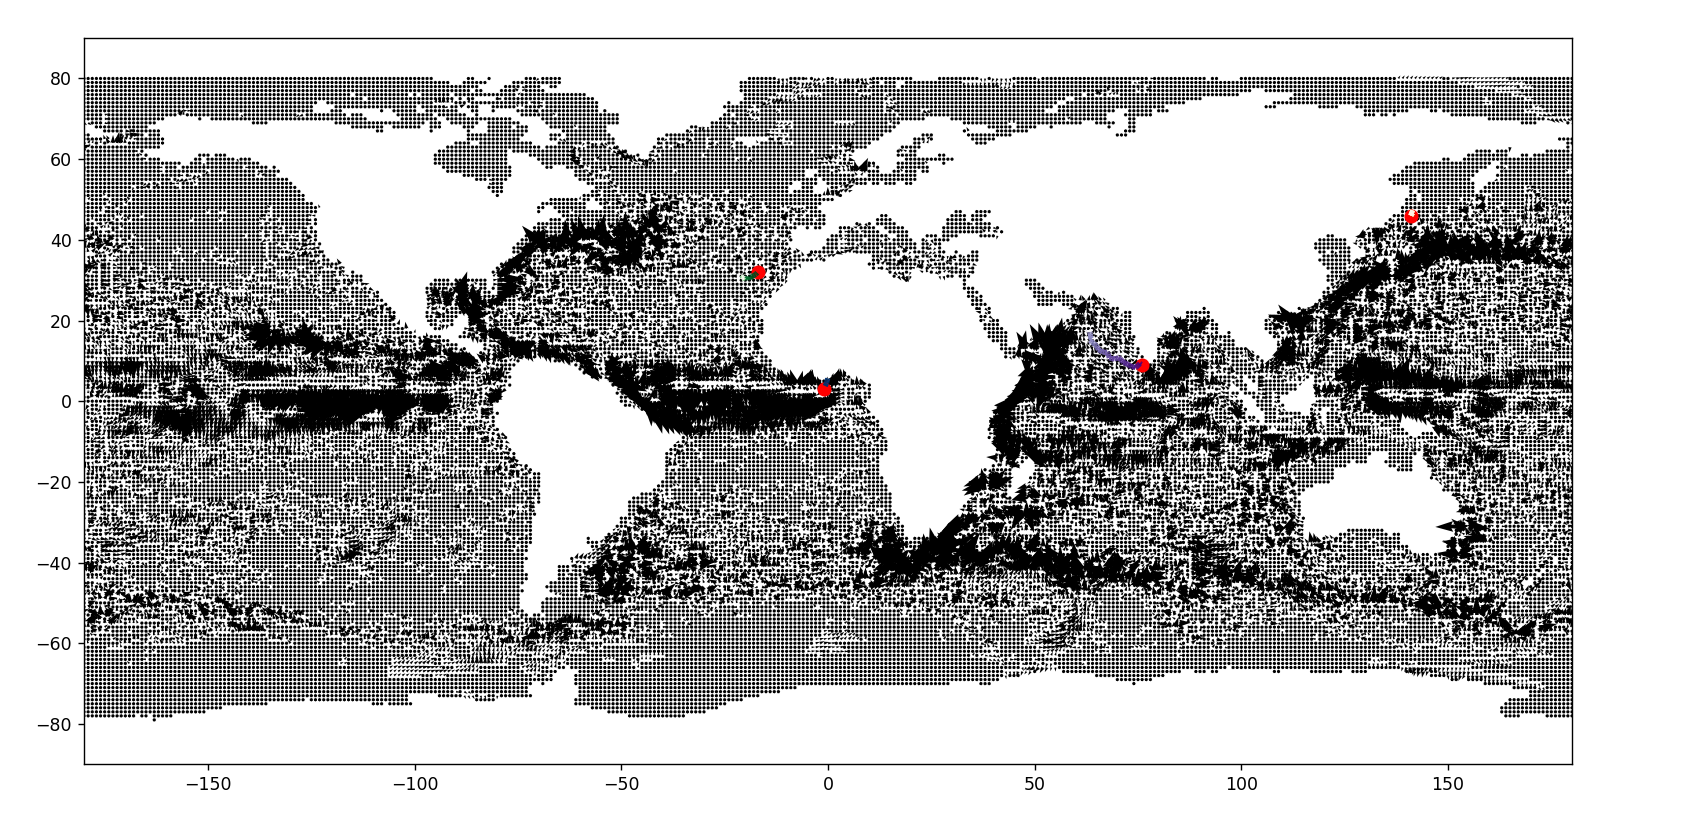
Route of trash
-
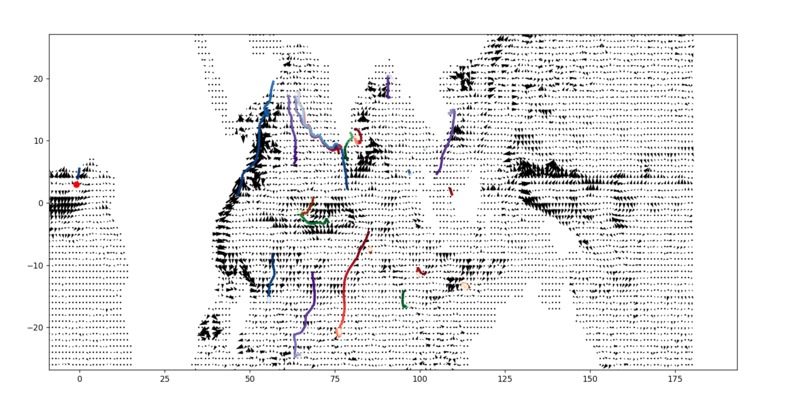
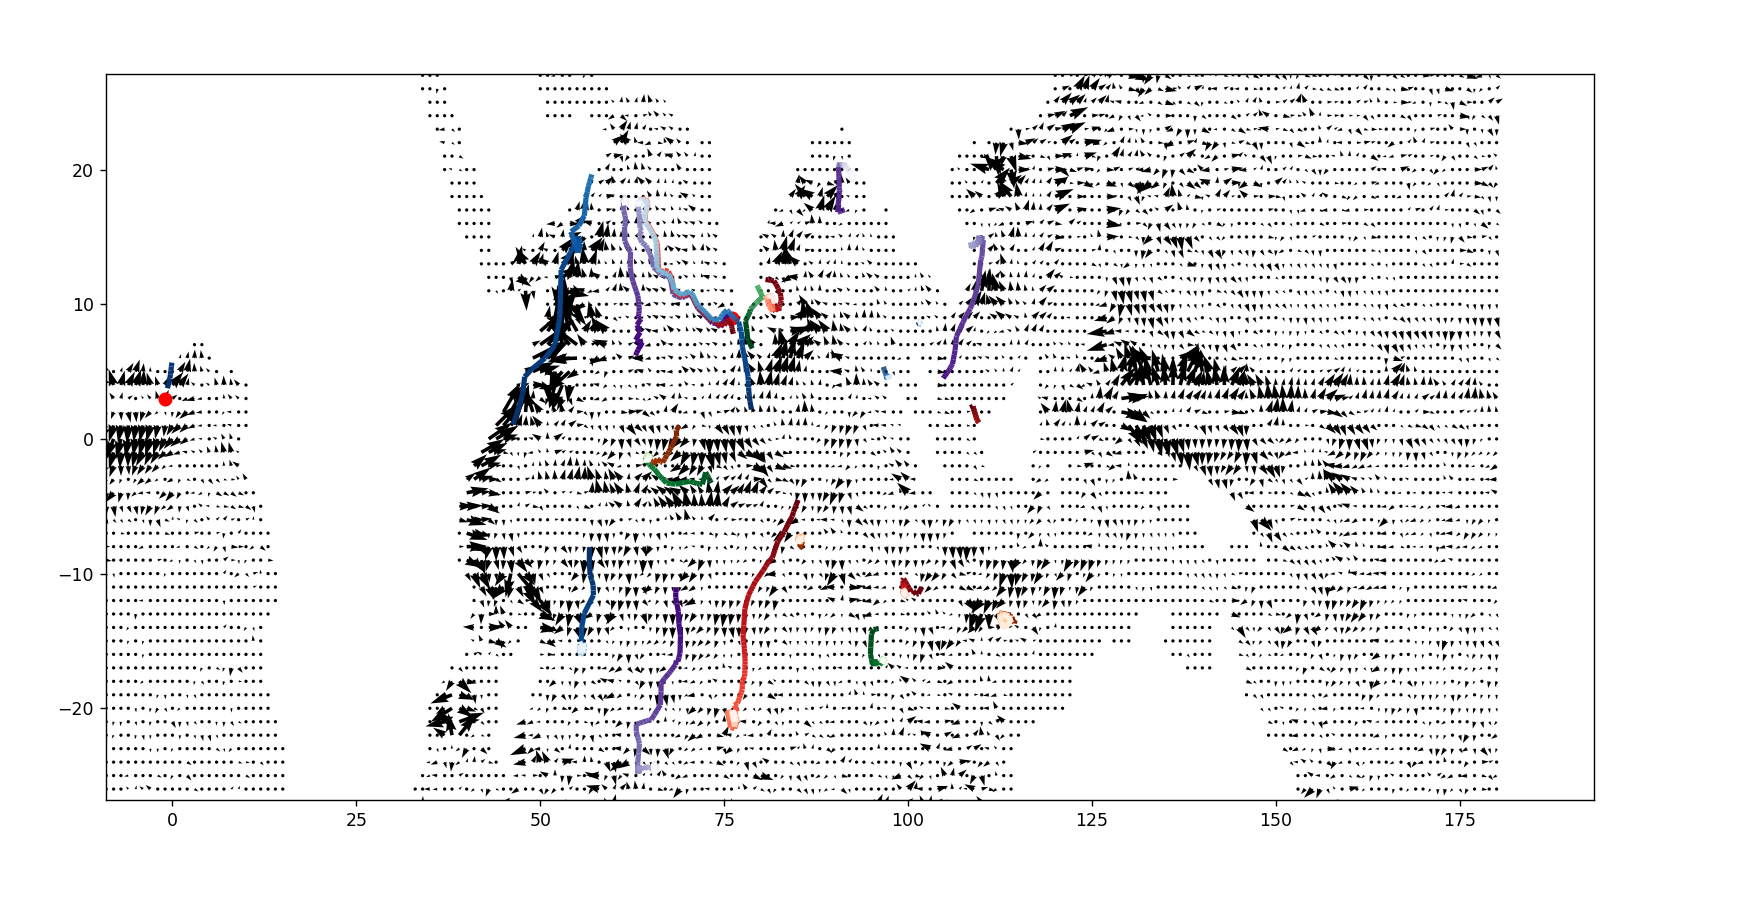
Multiple routes of tash dropped at diffrent locations
-
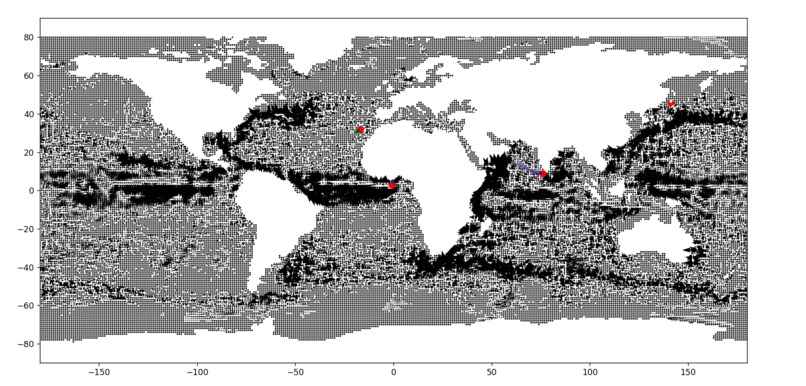
Overview (red dots mark where garbage was dropped)
Inspiration
In the vast stretches of India, as a passionate swimmer, witnessing the beaches submerged under heaps of trash carried by the ocean was truly devastating. Observing volunteer groups organising cleanup events every weekend to restore my beach prompted me to ponder ‘Is there a more efficient way to target these cleanups directly in the ocean?’. That's where my idea for Ocean Watch sprouted – utilising ocean watch communities to track the most probable location where ocean pollutants will end up, leading to a more efficient and targeted cleanup. As there are many large ships in the ocean already cleaning up trash Ocean Watch will just help maximise their productivity.
What it does
Ocean Watch, uses geospatial data about the world’s ocean current’s velocity and direction and plots it onto a map (the data was taken from meteomatics.com). Then you can simulate the path of garbage particles at any given point on the map and it will track its location.
How we built it
The prediction algorithm in 'Ocean Watch' utilises satellite data on ocean currents and speed to simulate the trajectory of pollutants in the ocean. Through data preprocessing and merging, the code calculates the u and v components of velocity vectors, representing east-west and north-south flow. The application visualises this data with a quiver plot, displaying arrows that depict the direction and magnitude of currents at various locations. By simulating particle movement based on the calculated components, 'Ocean Watch' enables us to predict where pollutants might travel from any point in the vast ocean.
Challenges we ran into
I faced numerous challenges while building this. One of the main challenges I faced was finding a way to plot the world’s ocean currents without using too many resources so the simulation runs quickly. I finally concluded using the matplotlib library’s quiver plot function, which presented as the most appropriate option. Another one of the issues was finding data in a suitable format. After trying numerous data sets, some being unorganised, some having heavy excess info. I finally decided to go with meteomatics’ data which provided comprehensive data in a suitable csv file which was easy to index.
Accomplishments that we’re proud of
I take immense pride in the remarkable accomplishments achieved through 'Ocean Watch,' my application that aims to combat marine pollution. One of the highlights is its remarkable ability to predict the trajectory of garbage from any point in the vast ocean, empowering communities and conservationists to strategize targeted cleanup efforts effectively. Moreover, I am happy that I could build a skeleton of a project that I am very proud of as in the future it will help make an impact on my local community.
What we learned
While building this project, I learned new ways to anaylise and represent data. I also learned about the impact marine pollution truly has on the world.
What's next for Ocean Watch
I hope to try to make this project more suitable for real world tasks in the future. By plotting river bodies on the land which drain out as they mainly carry a large amount of the ocean pollution. Furthermore, I hope to make it a more real time based simulation as ocean currents are very versatile. I would also like to host this on a website as an interactive site so that people understand how littering in the ocean is not only causing an impact on them but the whole world as well. Lastly, Ocean Watch will be available as an API so that people from all over the world can use it to track garbage in their area for targeted cleanups and other educational purposes.


Log in or sign up for Devpost to join the conversation.