-
-

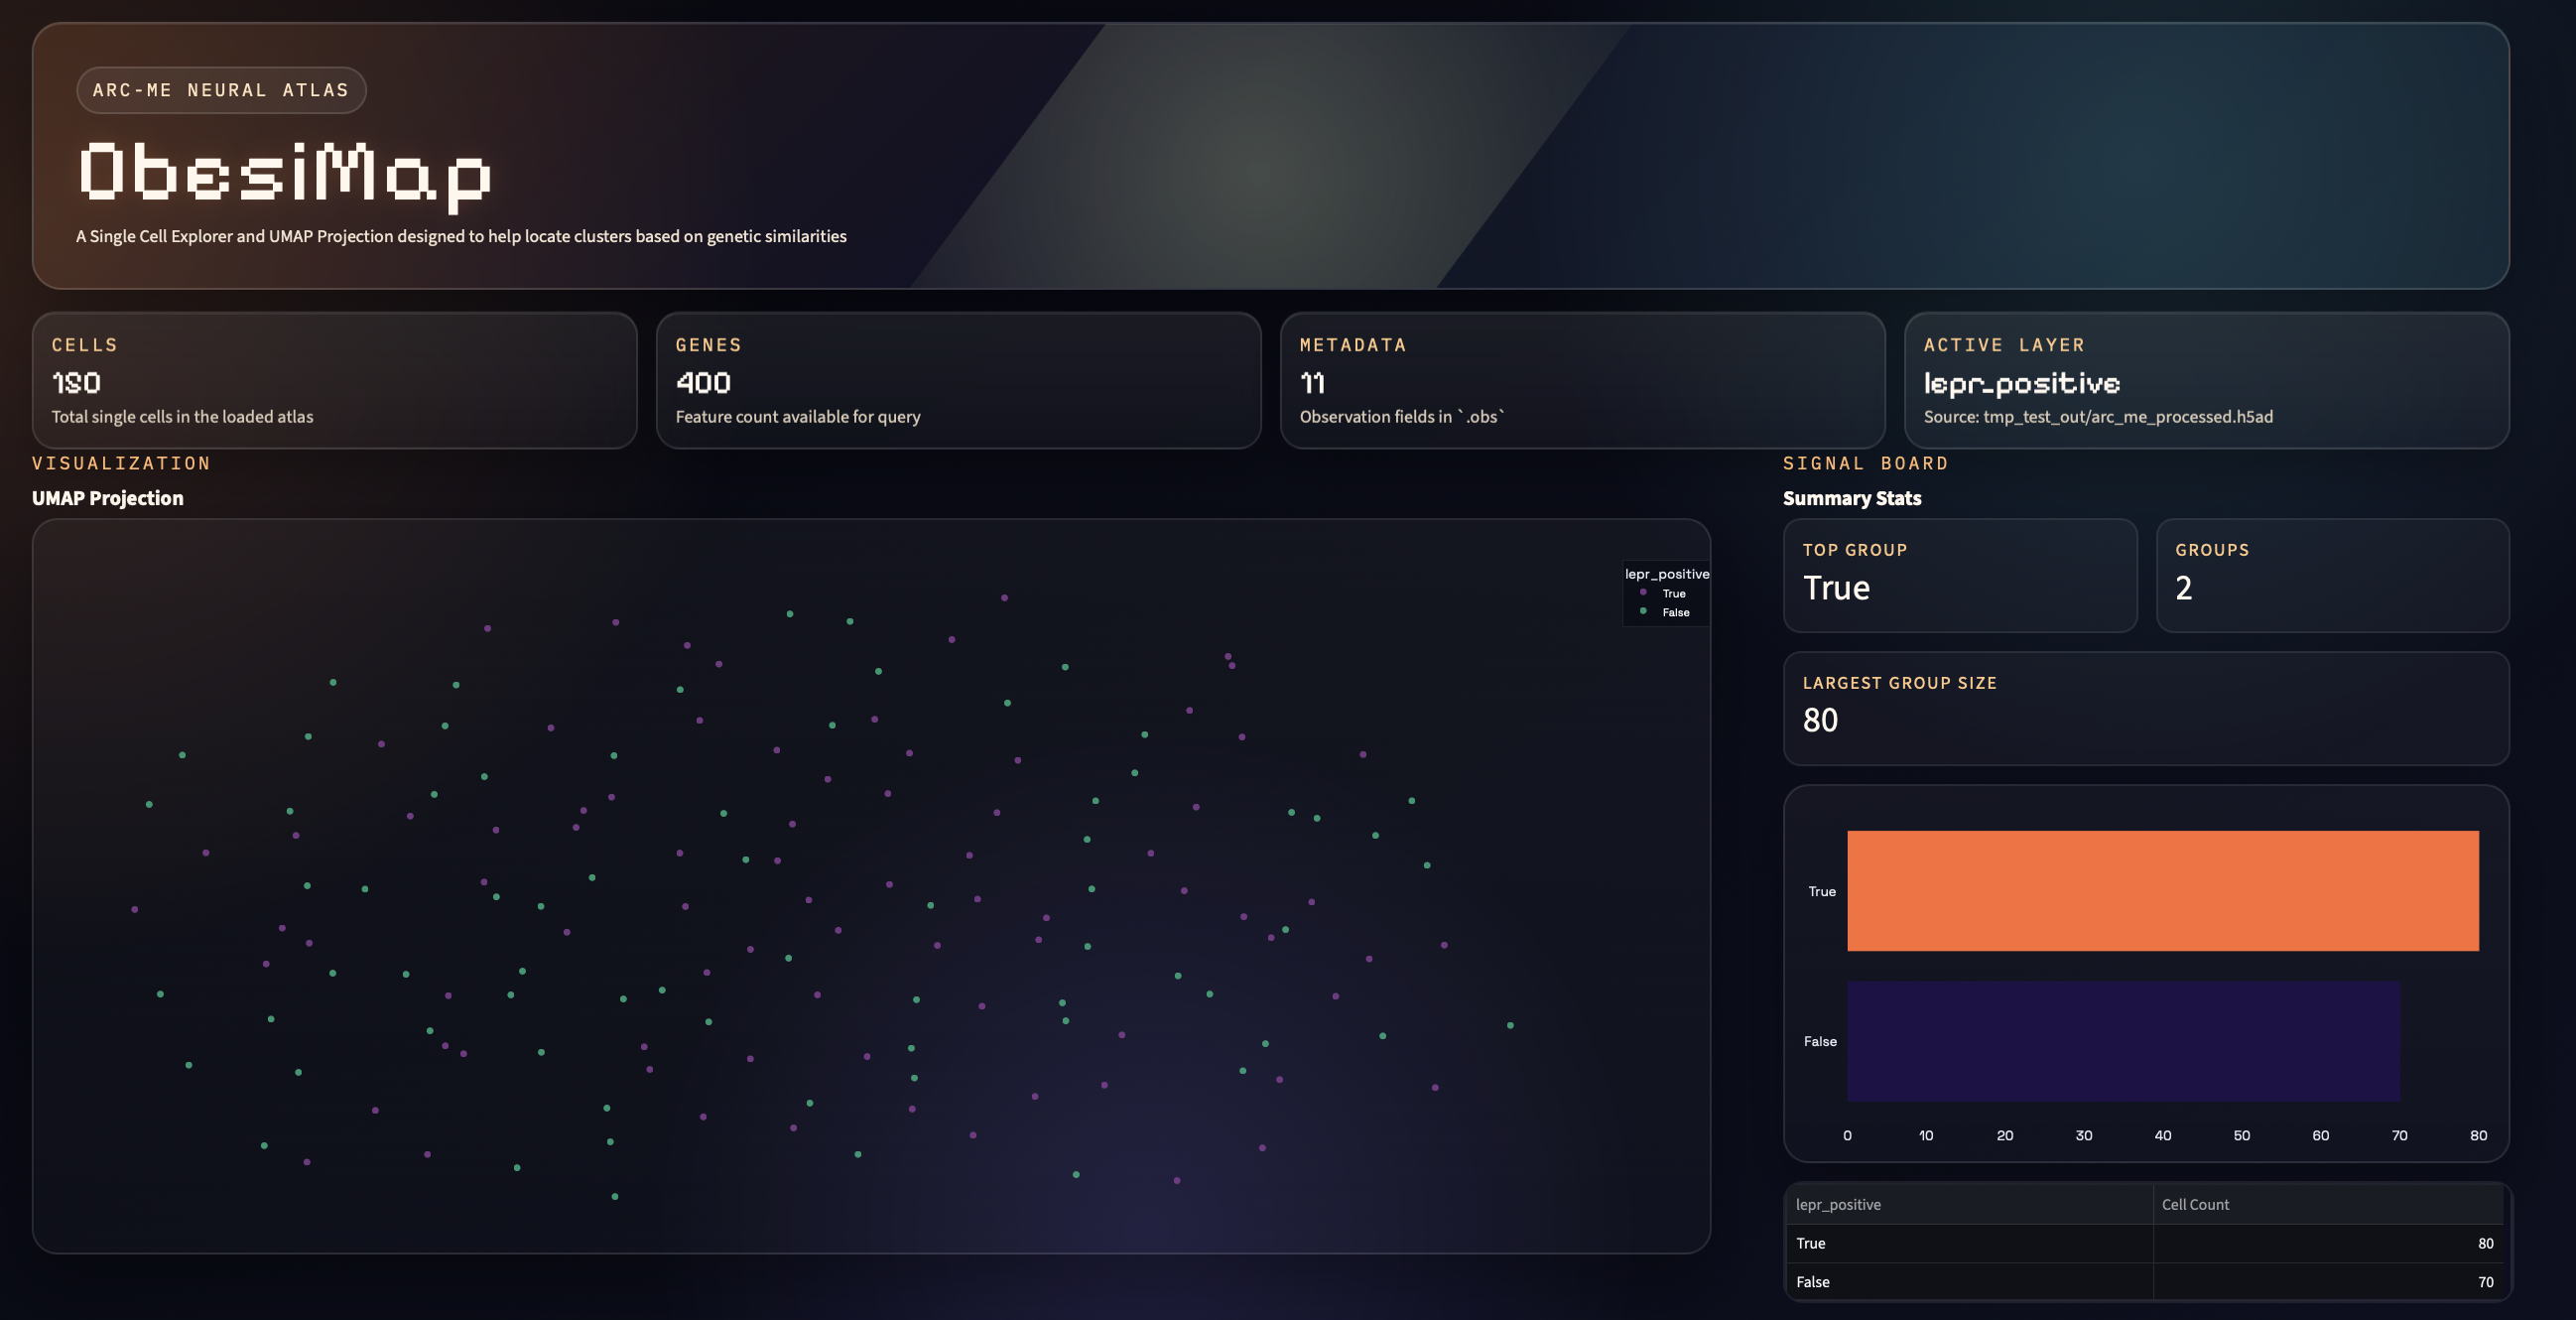
Front-End Showcase of Dashboard for Lepr-Positive Cells
-
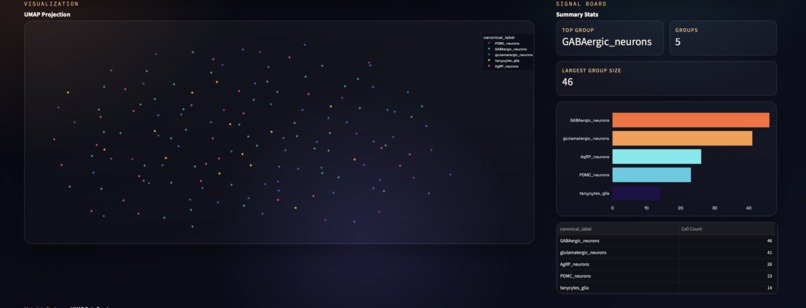
Dashboard for checking other labels
-
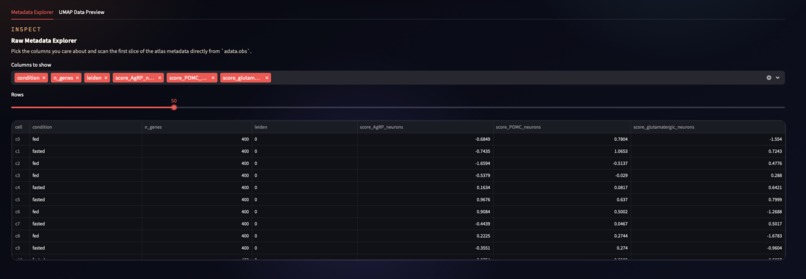
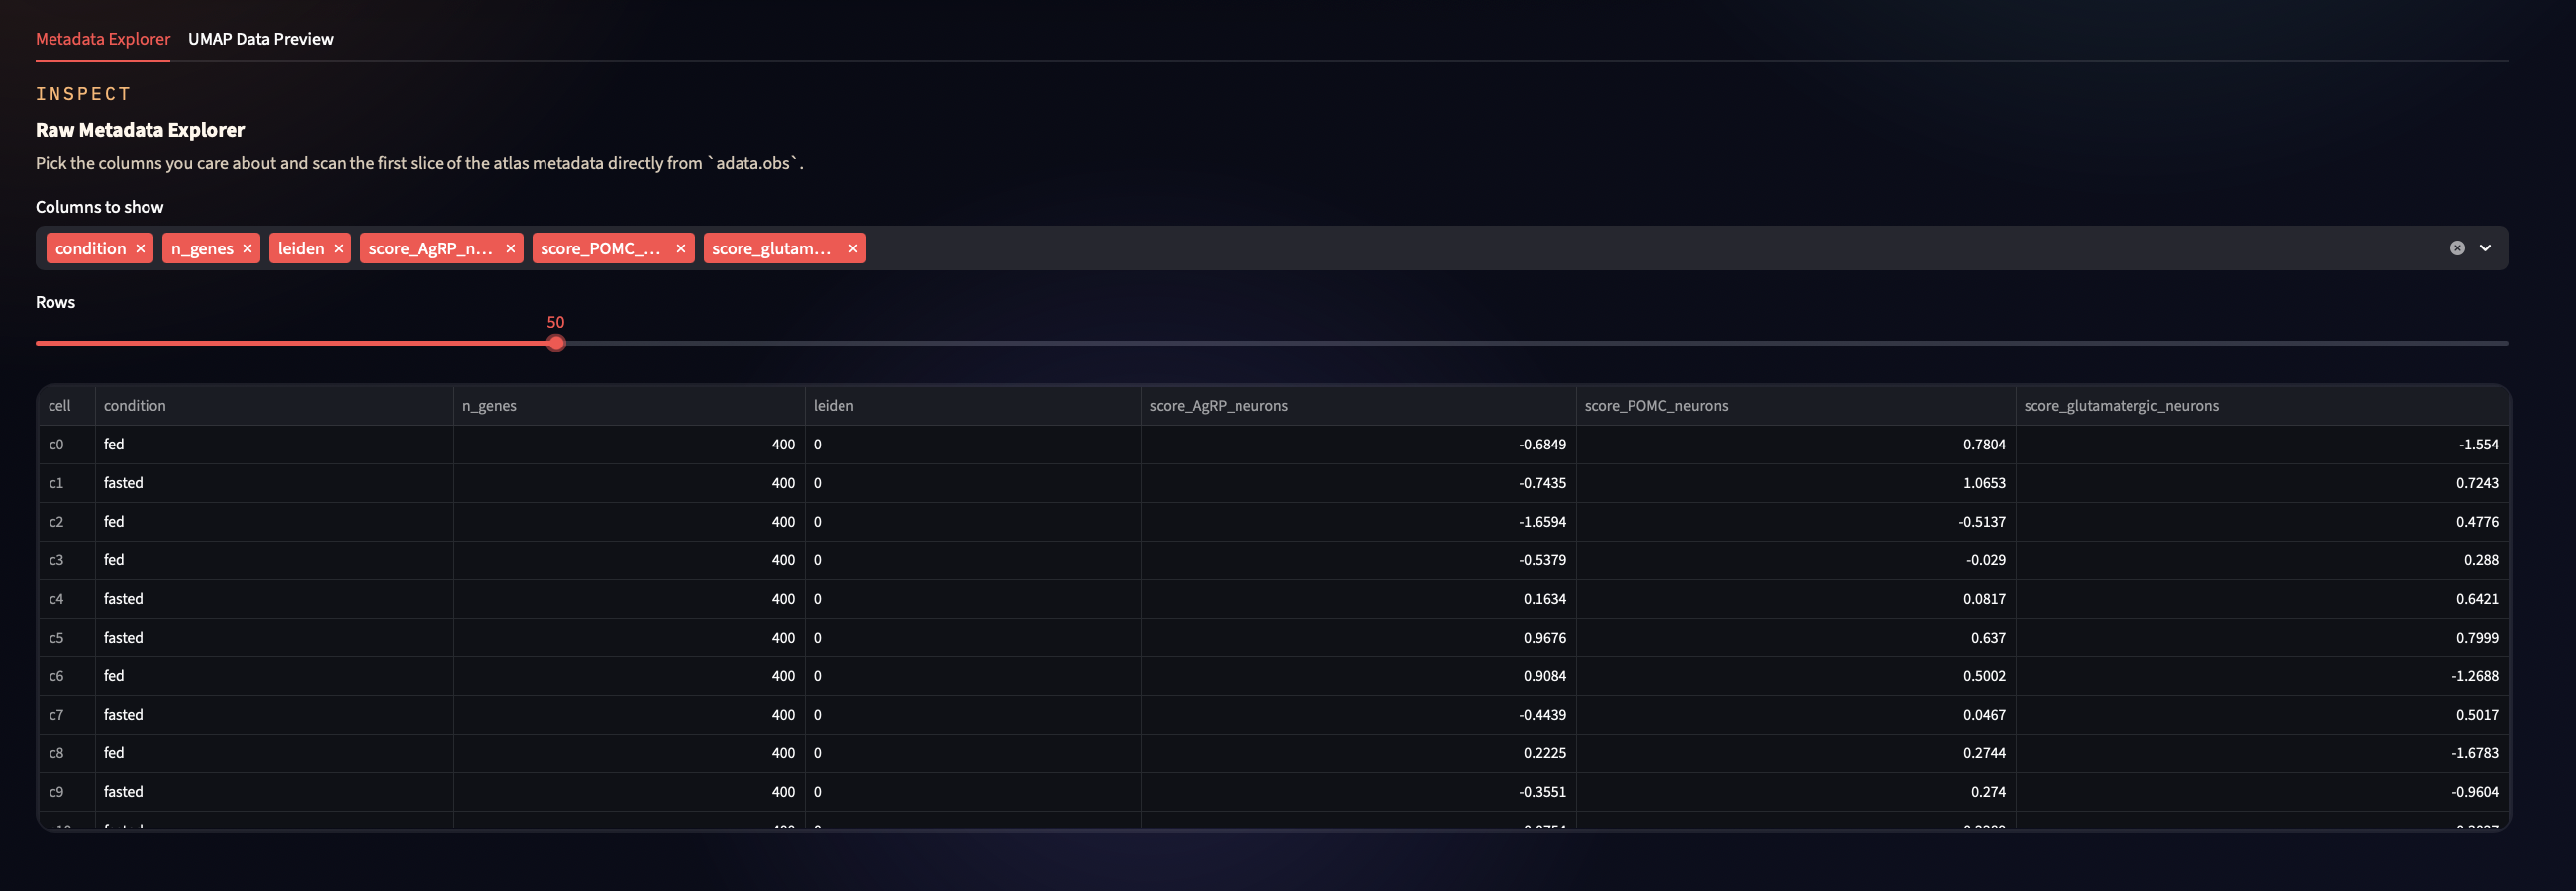
Showcase each cell in the MetaData Explorer

https://docs.google.com/presentation/d/1u4xChHNRjkReAiZJzwi7xR-IDo-cuCktkiawQRglcYs/edit?usp=sharing
Overview
Obesity is both a metabolic disorder and a breakdown in brain connectivity. Specifically, leptin resistance occurs when the brain's control center the Arcuate Nucleus and Median Eminence (Arc-ME) stops responding to leptin (the satiety hormone).
Our project ObesiMap provides an interactive, end-to-end bioinformatics dashboard to analyze single-cell RNA sequencing (scRNA-seq) data from the Arc-ME (based on Campbell et al., 2017). By algorithmically isolating Lepr+ (Leptin Receptor) expressing cells, this tool decodes the specific genetic pathways that drive hunger and satiety during metabolic stress (Fed vs. Fasted states). Using our pipeline, we applied a custom thresholding algorithm to search the genetic matrix for expression of the Leprgene. We isolated the exact cells capable of sensing Leptin which you can now see highlighted as the 'True' population on our map and signal board. Furthermore, we ran a Wilcoxon rank-sum differential expression analysis, comparing the Lepr-positive cells in a 'Fed' state versus a 'Fasted' state. We then ran pathway enrichment on those results. We found that starvation actively upregulates specific neuropeptide signaling pathways to force a biological hunger response."
Key Features
- Interactive UMAP Projections: Visualize complex, high-dimensional genetic data in a 2D spatial map.
- Targeted Cell Isolation: Algorithmic thresholding to isolate and flag
Lepr+cells from the broader hypothalamic atlas. - Gene Expression Search: Real-time querying for canonical metabolic markers (e.g., Agrp, Pomc, Npy).
- Condition Analysis: Differential expression tracking between Fed and Fasted states to identify active signaling pathways.
Languages and Libraries Used
- Data Processing Pipeline: Python,
Scanpy,AnnData - Frontend Dashboard:
Streamlit,Plotly - Data Handling:
Pandas,NumPy

Log in or sign up for Devpost to join the conversation.