-
-
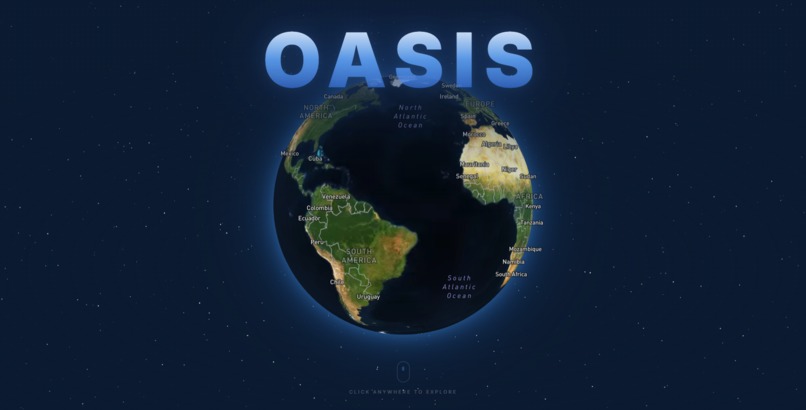
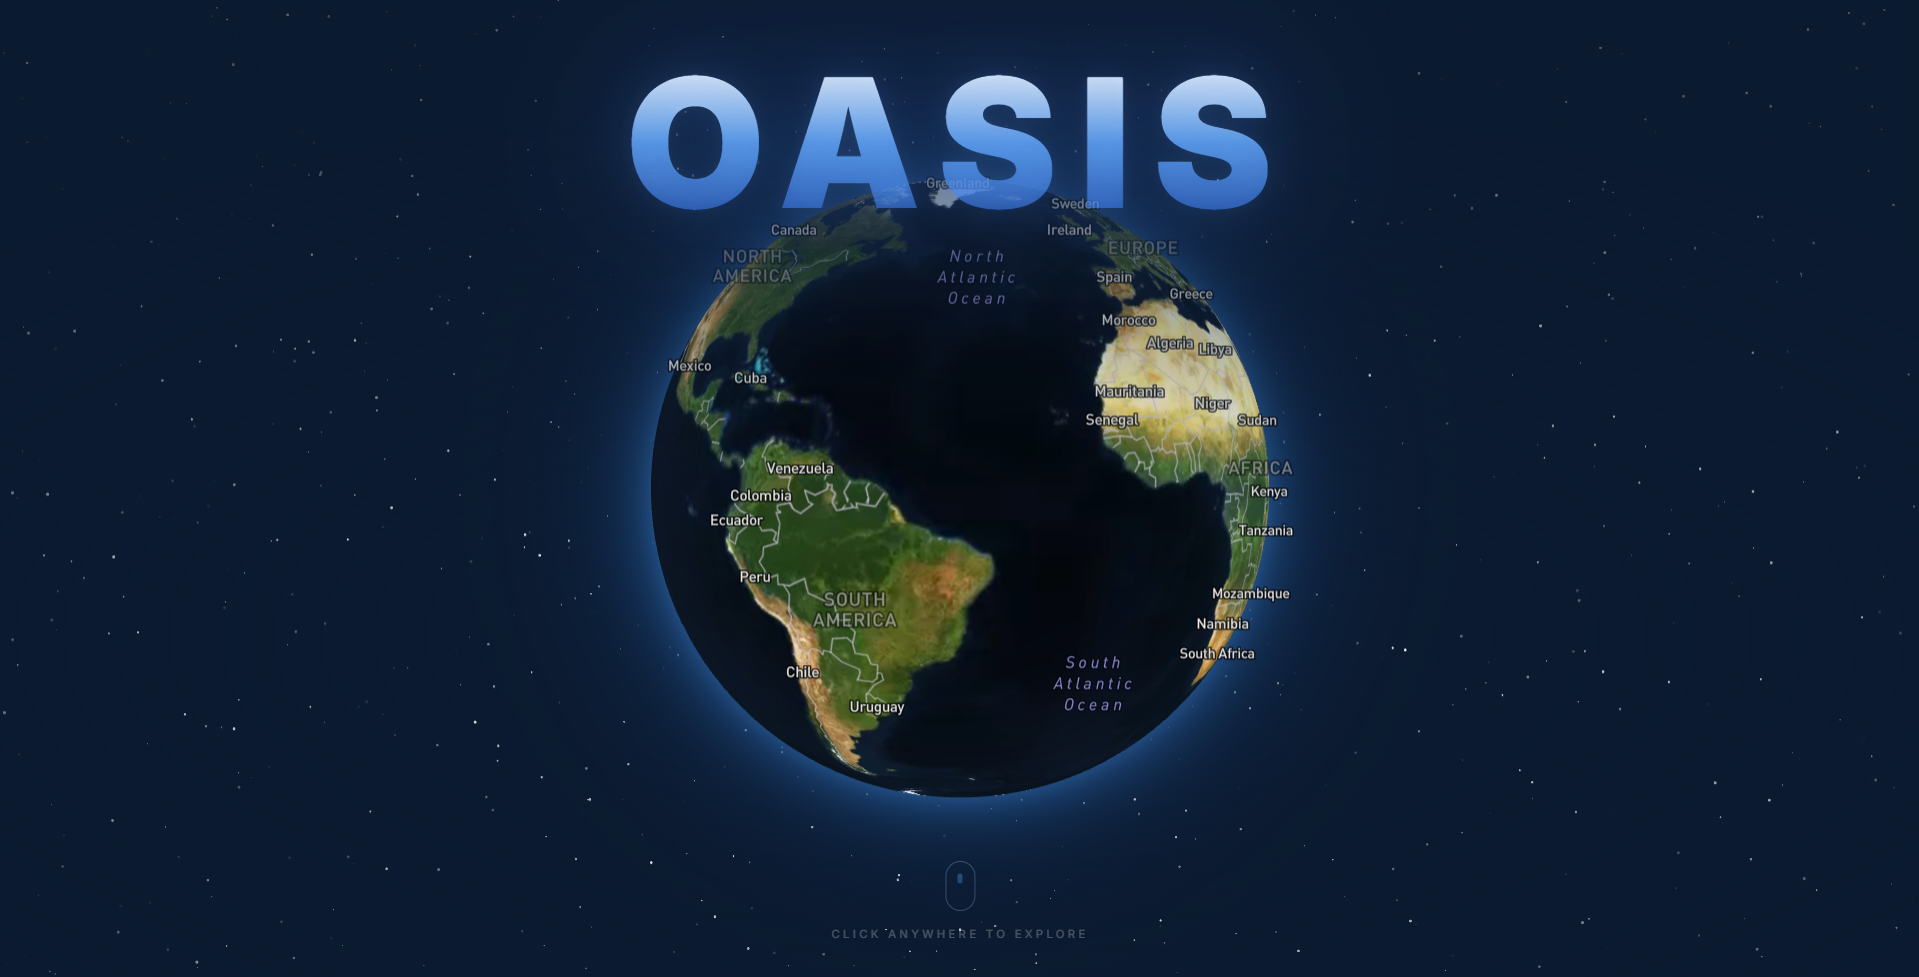
Landing Page
-
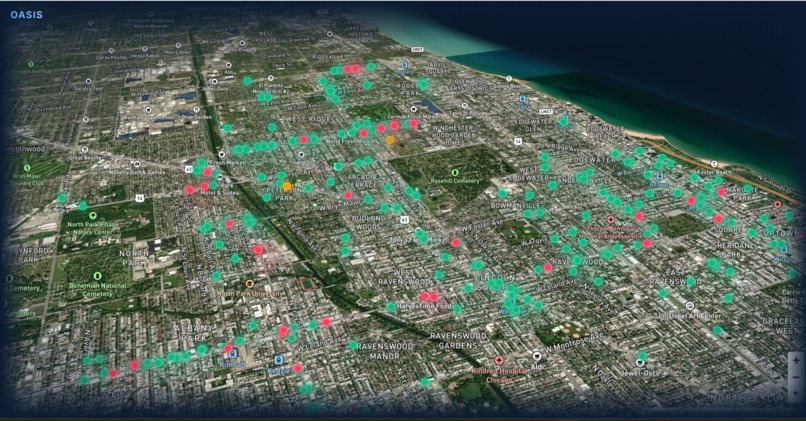
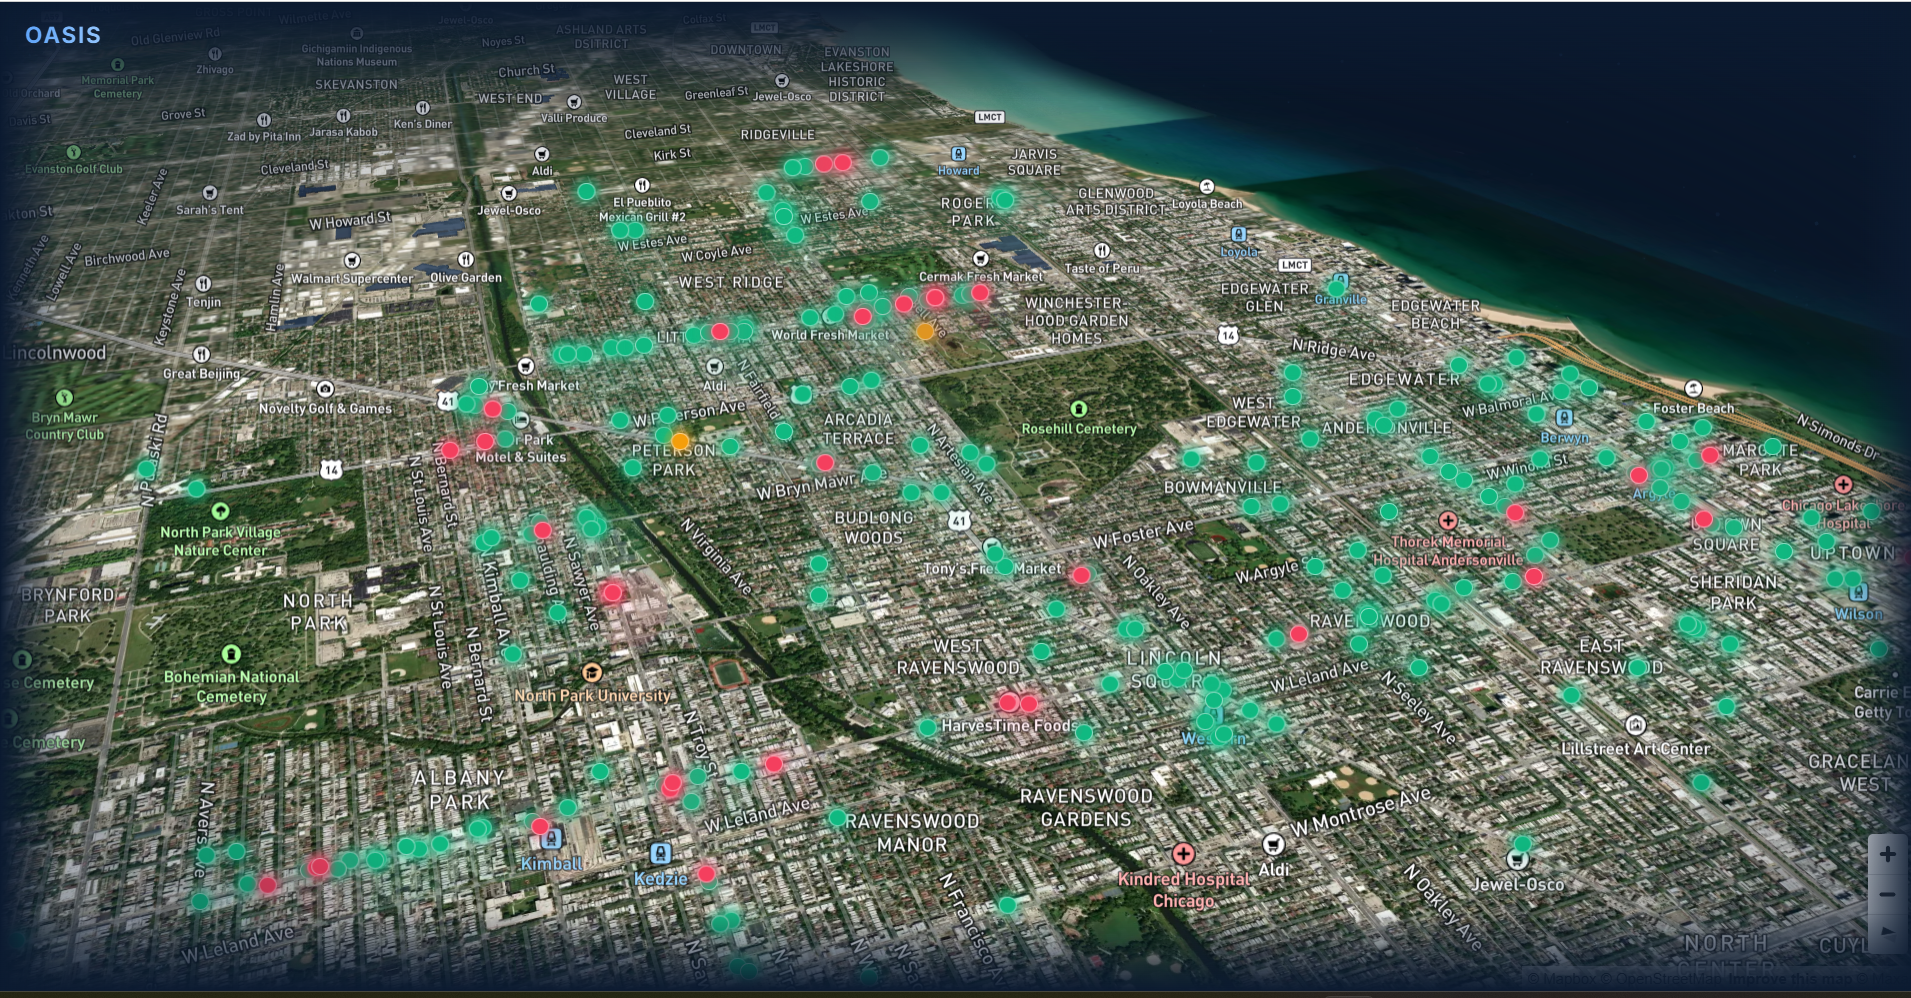
Picture of business map without selection.
-

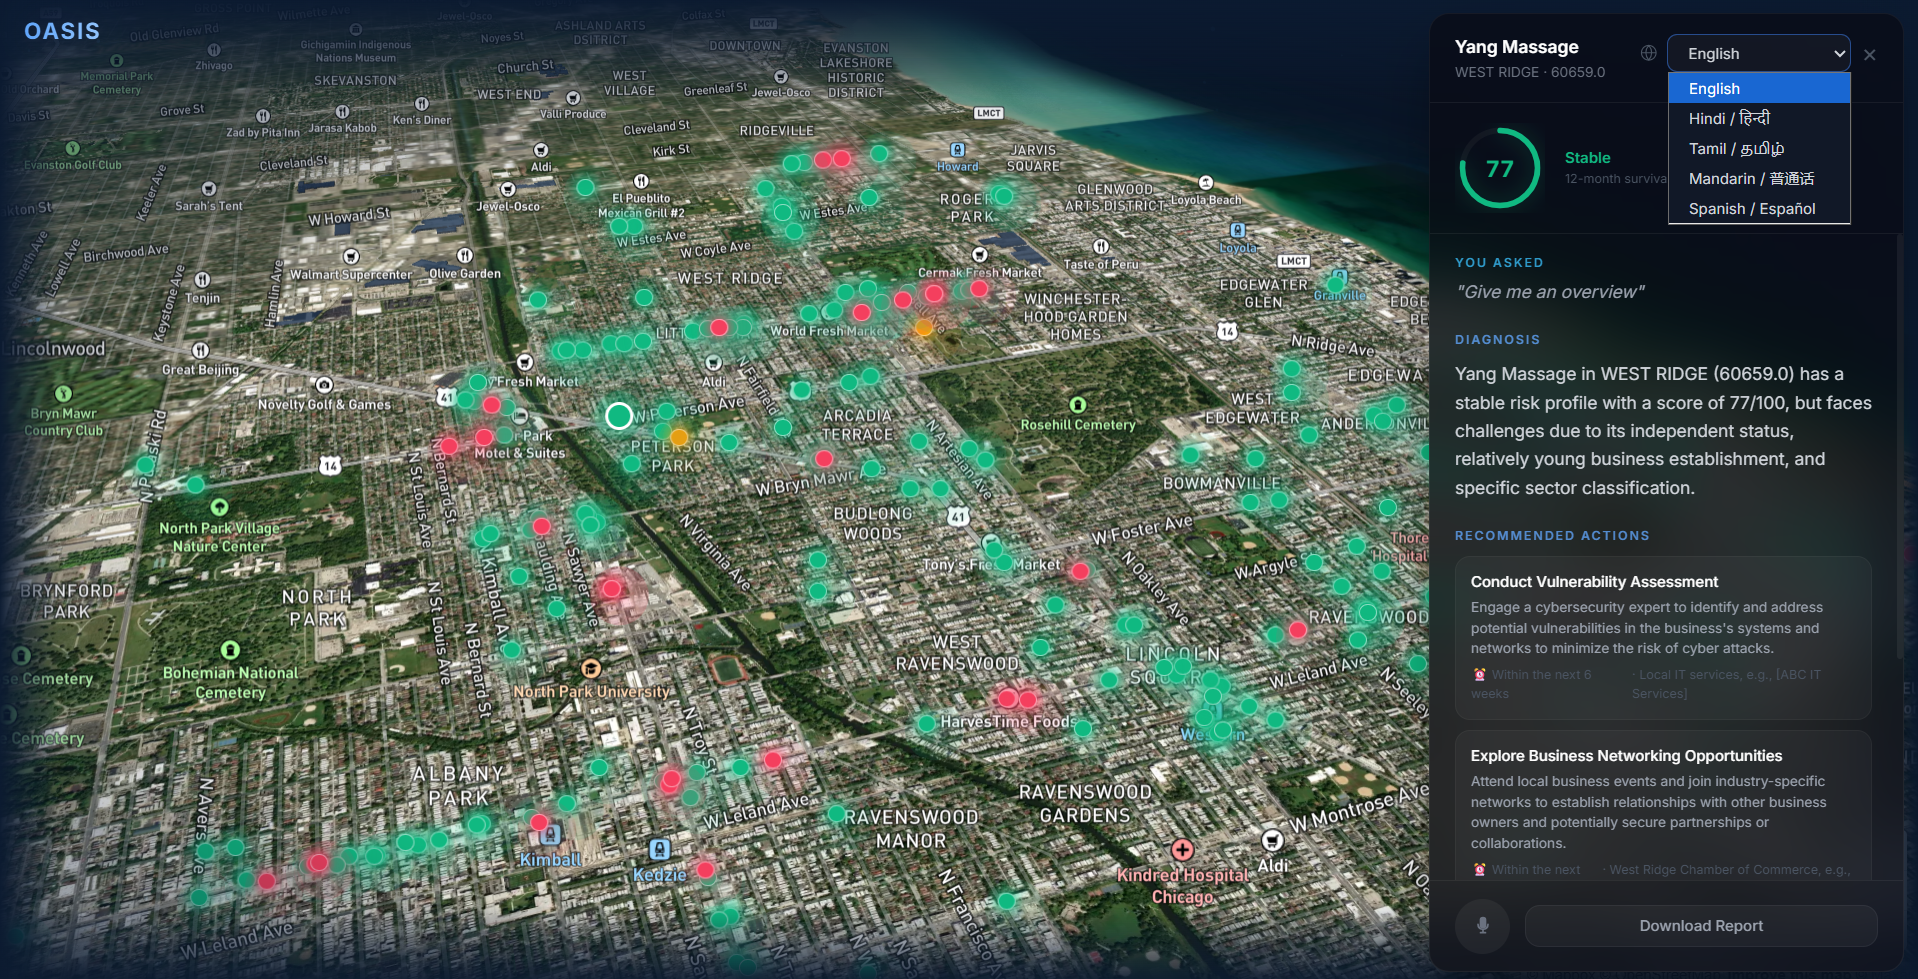
Selected Business Risk Analysis
-
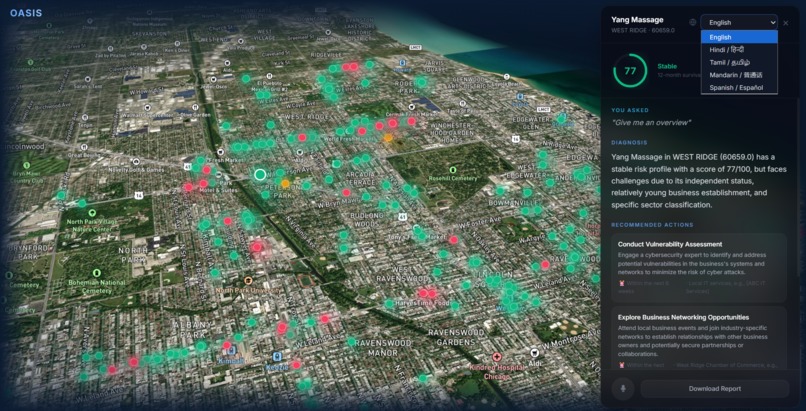
Choosing language selection.
-

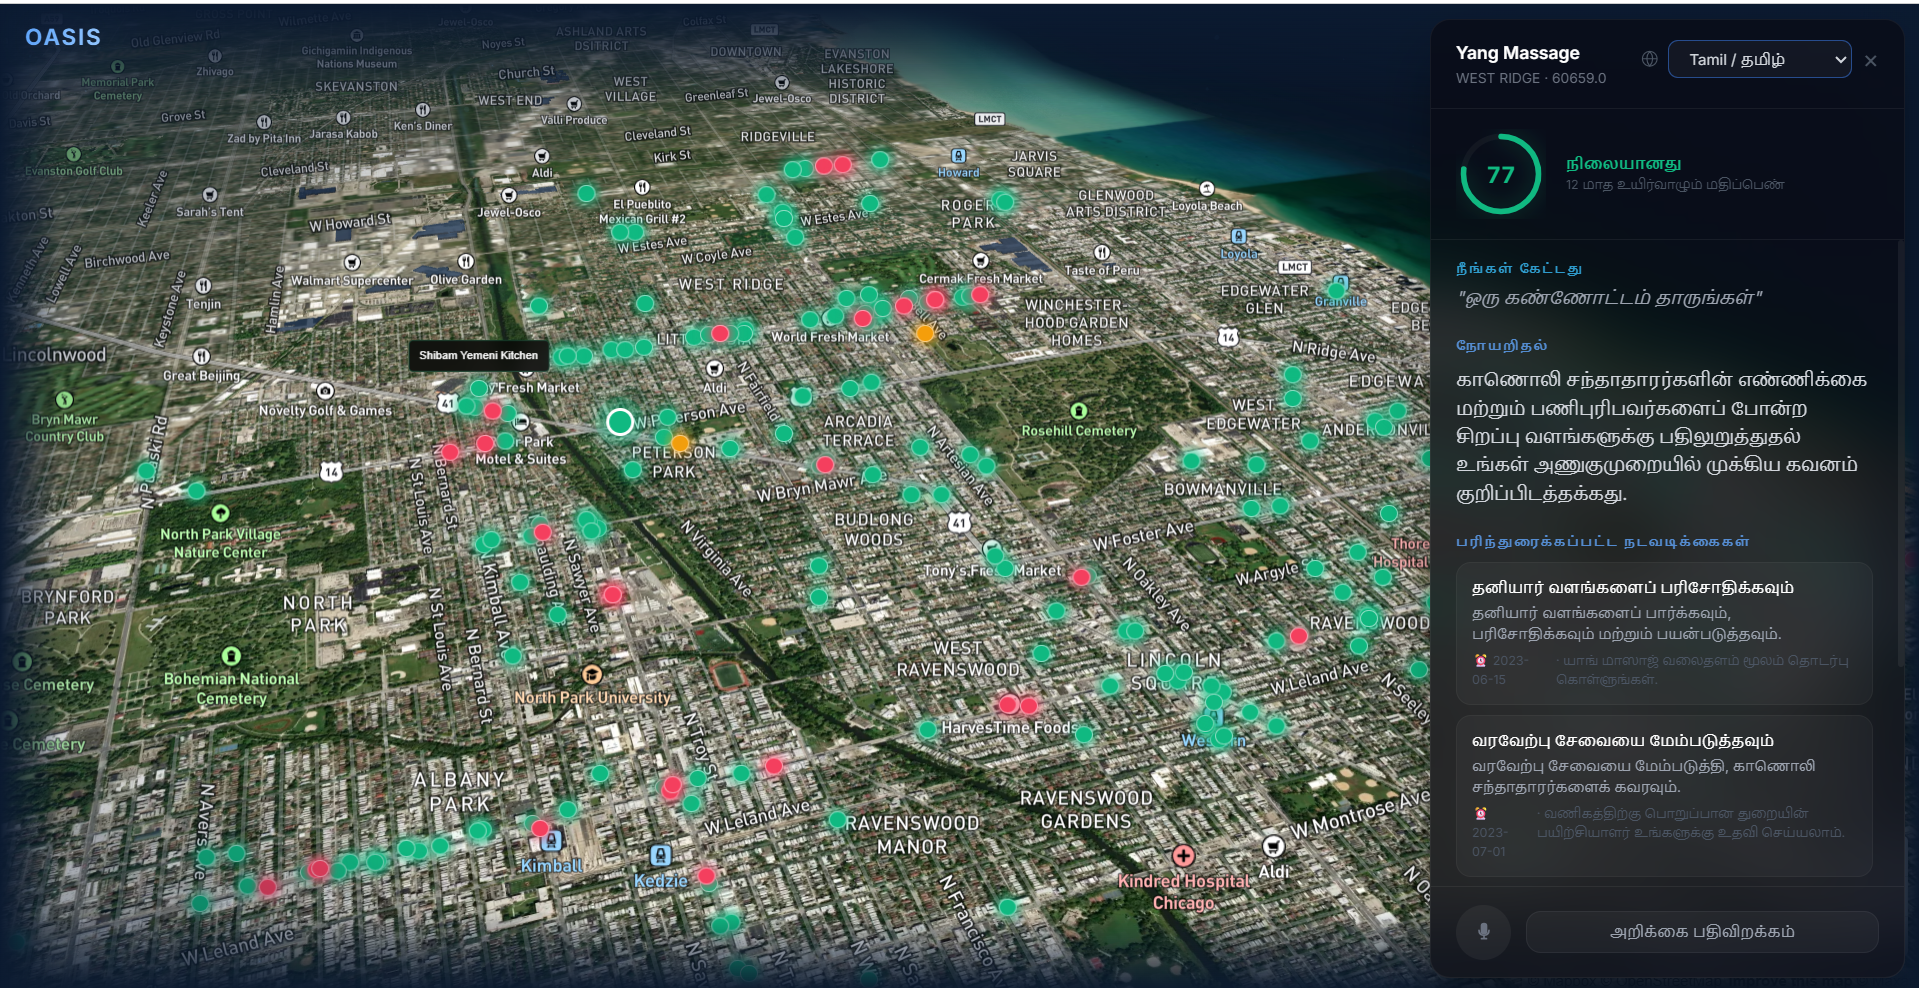
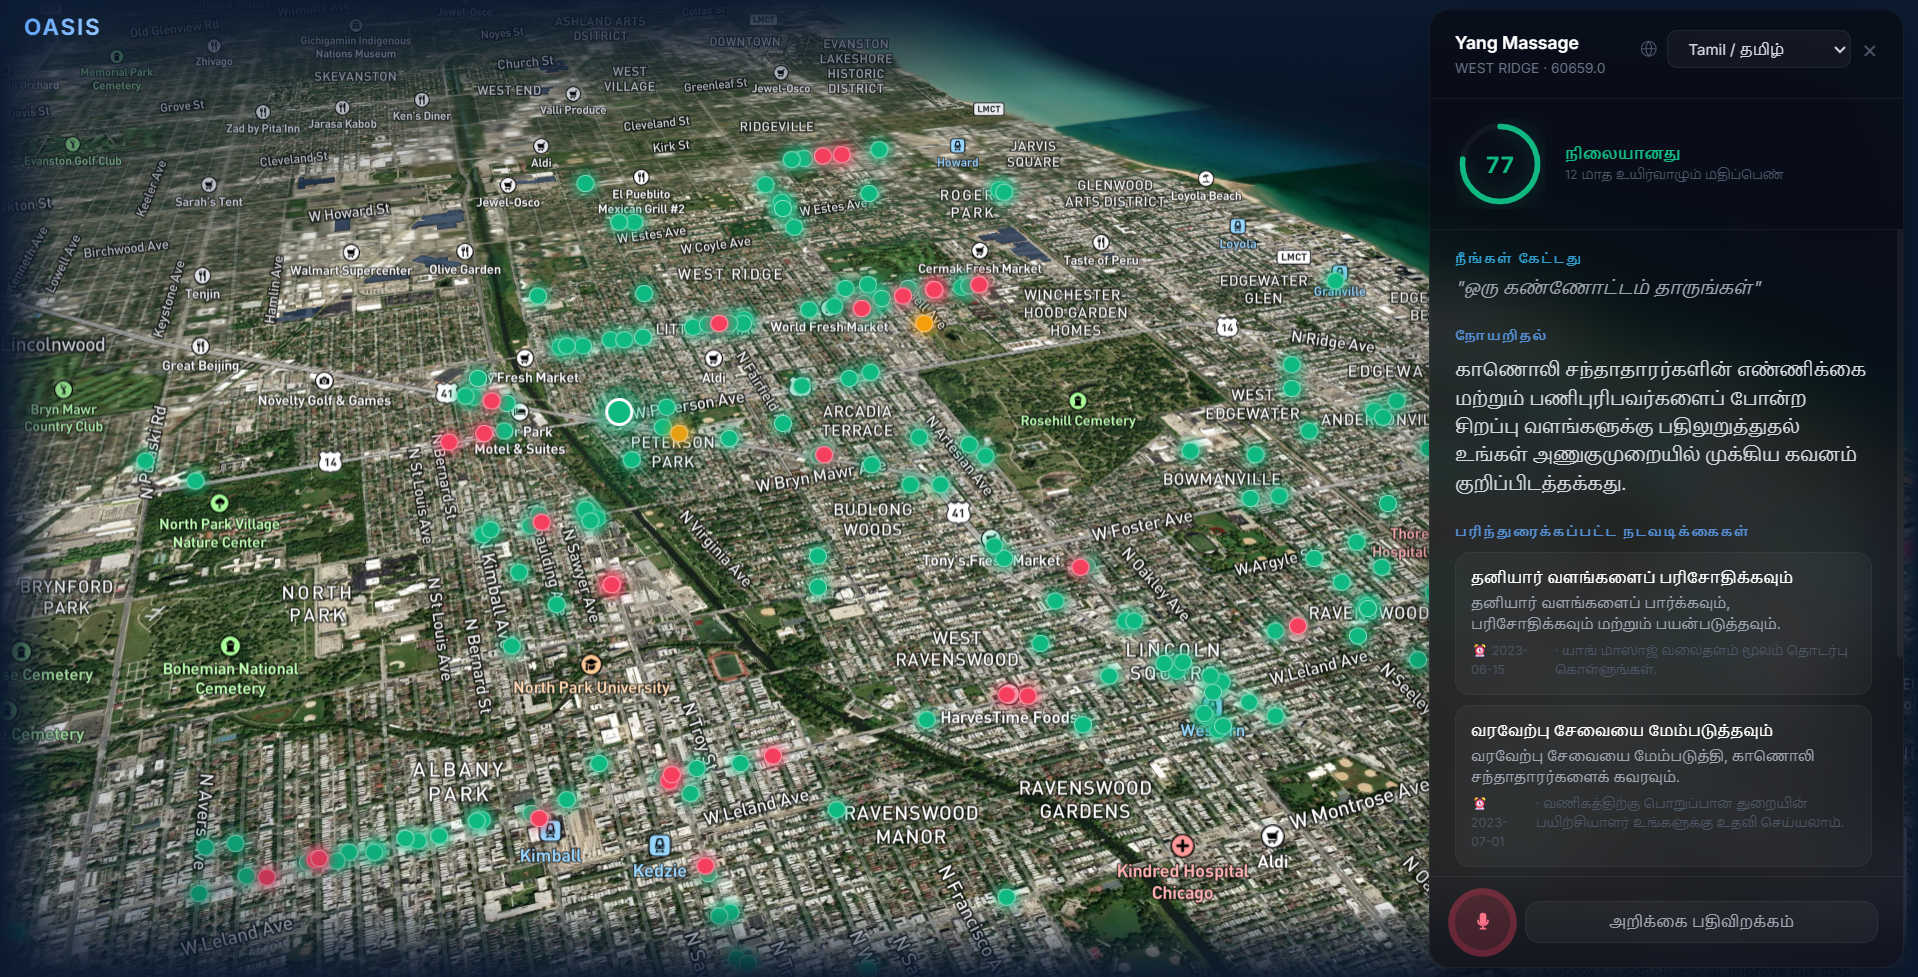
Tamil Language Dashboard
-

Recording Voice Input in Tamil
-
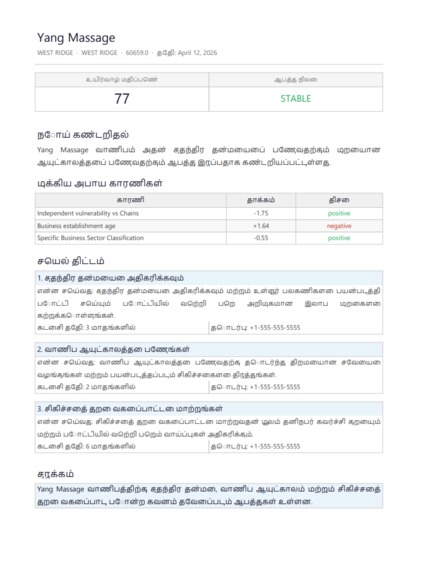
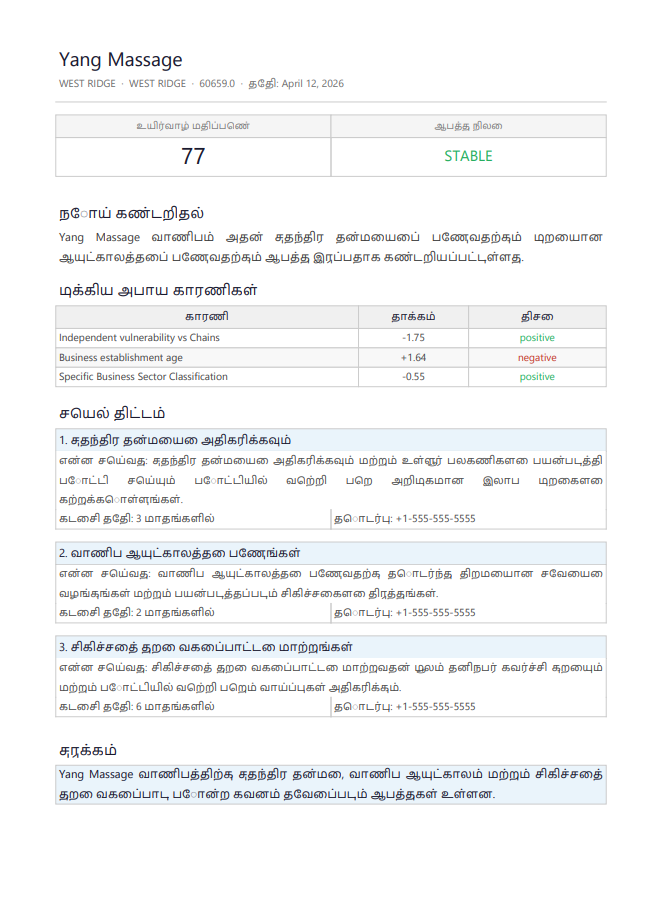
Risk analysis PDF download in Tamil.

Oasis – Small Business Survival Intelligence
Inspiration
Chicago has lost tens of thousands of small businesses over the past decade. Many of these were not failing because of lack of effort, but because owners didn’t have access to early warning signals hidden in data. Business license renewals, health inspections, neighborhood income shifts, and customer activity all contain signals, but they exist in separate systems and are not accessible in a usable way.
As a team, we wanted to build something that could bring these signals together and make them actionable. The goal was to give small business owners the same level of risk insight that large firms use, but in a simple, accessible, and multilingual format.
What We Built
Oasis is a small business survival platform that predicts closure risk and explains the underlying factors.
We built a system that:
- Aggregates data from multiple sources (business licenses, census data, Google reviews, etc.)
- Trains a machine learning model to predict 12-month closure risk
- Visualizes results on an interactive map with clear risk levels
- Provides an AI-generated explanation and action plan for each business
Each business has:
- A survival score
- The top contributing risk factors (via SHAP)
- A generated diagnosis and recommended actions
We also designed the system to be usable in real-world settings:
- Multilingual support (English, Hindi, Tamil, Mandarin, Spanish)
- Voice input and audio responses
- Downloadable PDF reports for offline use
- Corridor-level summaries for planners and community organizations
How We Built It
Data and Pipeline
We combined six different data sources into a unified dataset. This included:
- Business license data from the Chicago Data Portal
- Google Places data for ratings and engagement
- Census data for socioeconomic context
One of the biggest challenges early on was that license data did not include coordinates. As a team, we built a geocoding pipeline that queried additional endpoints and matched records in batches. This reduced our dataset from around 1,000 records to ~570 usable, mappable entries.
We engineered features across three levels:
- Business-level (age, renewal patterns, independence vs chain)
- Customer-level (ratings, review velocity)
- Neighborhood-level (income, rent, growth trends)
Modeling
We trained an XGBoost binary classifier to predict whether a business would close within 12 months.
- Used class weighting to handle imbalance
- Tuned hyperparameters with randomized search and cross-validation
- Evaluated on a held-out test set
We also integrated SHAP to generate per-business explanations. This allowed us to surface the top three factors driving each prediction, making the model outputs interpretable rather than just numerical.
We explicitly removed features that could cause data leakage, such as renewal delays and nearby closures, to ensure the model remained realistic.
Backend and AI Layer
The backend was built with FastAPI. Instead of running predictions per request, we computed all predictions upfront and stored them in memory for fast lookup.
For the AI assistant:
- We constructed structured prompts using model outputs and SHAP explanations
- Used Gemini as the primary model and Groq as a fallback
- Enforced strict JSON outputs for consistency
We also implemented:
- Voice transcription using Whisper
- Text-to-speech using ElevenLabs
- PDF generation using ReportLab with multilingual font support
Frontend
The frontend was built with React, Mapbox, and Three.js.
We focused on making the experience intuitive and visually clear:
- Color-coded risk markers (high, medium, low)
- Interactive map with 3D elements
- Sliding panel showing business insights
- Animated score visualization
Challenges
One of the biggest challenges was working with incomplete and inconsistent data.
- License data lacked coordinates, requiring a custom geocoding pipeline
- API calls (Google Places) failed silently at scale, requiring fallback handling and checkpointing
- Ensuring consistency in how risk scores were interpreted across backend, frontend, and AI responses caused repeated bugs
We also ran into issues with:
- Multilingual AI responses returning inconsistent formats
- Unicode rendering in PDF generation
- Synchronizing assumptions across team members working on different parts of the stack
What We Learned
As a team, we learned that the hardest part of building a data product is not the model, but the pipeline. Cleaning, joining, and validating data took significantly more effort than training the model itself.
We also saw that:
- Explainability (SHAP) is essential for making ML outputs useful
- Structured prompting and fallback models improve reliability in AI systems
- Building end-to-end systems requires constant coordination across frontend, backend, and ML components
What’s Next
We plan to:
- Expand coverage to all Chicago businesses
- Incorporate additional signals such as lease timing and real-time trends
- Build a generalized version that can be deployed for other cities
The long-term goal is to make this type of risk intelligence accessible to any small business, not just large organizations.
Built With
- census-api
- elevenlabs
- fastapi
- framer-motion
- google-gemini
- google-places
- groq
- mapbox
- pandas
- python
- react
- react-three-fiber
- reportlab
- scikit-learn
- shap
- socrata-open-data
- tailwindcss
- three.js
- vite
- xgboost

Log in or sign up for Devpost to join the conversation.