Inspiration
Inspired by food desert research done in sociology, we thought we could replicate the results using open sourced data.
What it does
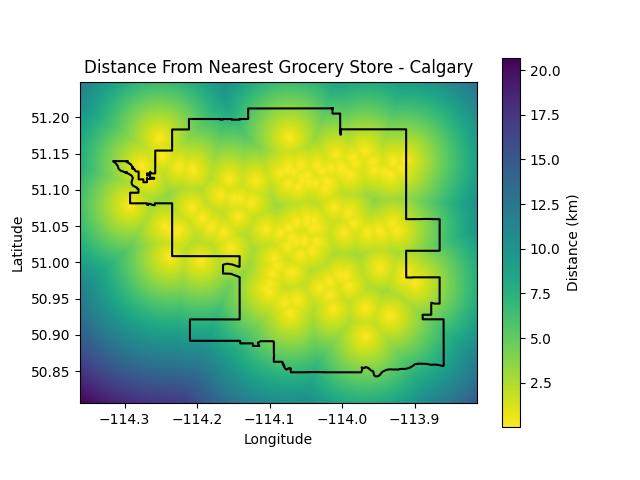
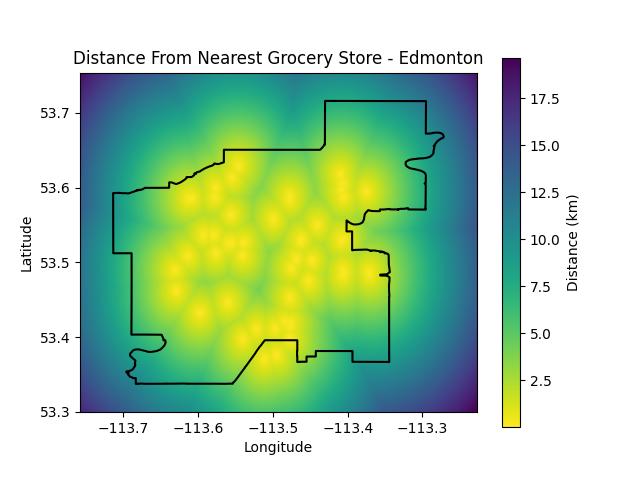
Generates heat maps based on how close an area is to the nearest grocery store
How we built it
Datasets from Calgary and Edmonton Open Data Datasets for business licenses and city boundaries were processed with pandas, numpy and matplotlib Webserver created using fastAPI and jinja2 templating
Challenges we ran into
Had to precompute data since it would take too long in the API otherwise Filtering Data webserver struggles
Accomplishments that we're proud of
Working webserver and pretty plots
What we learned
Manipulating geospatial data i.e. haversine formula for distance approximation
Built With
- fastapi
- javascript
- matplotlib
- numpy
- pandas
- python

Log in or sign up for Devpost to join the conversation.