-
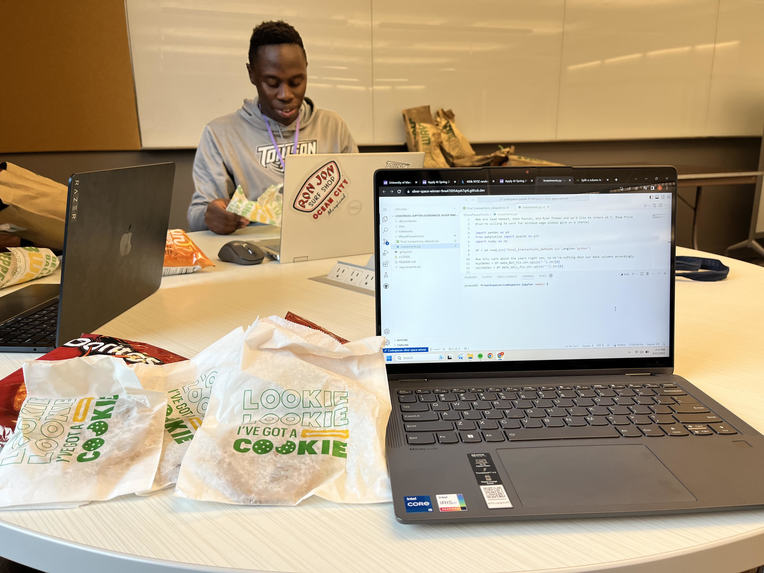
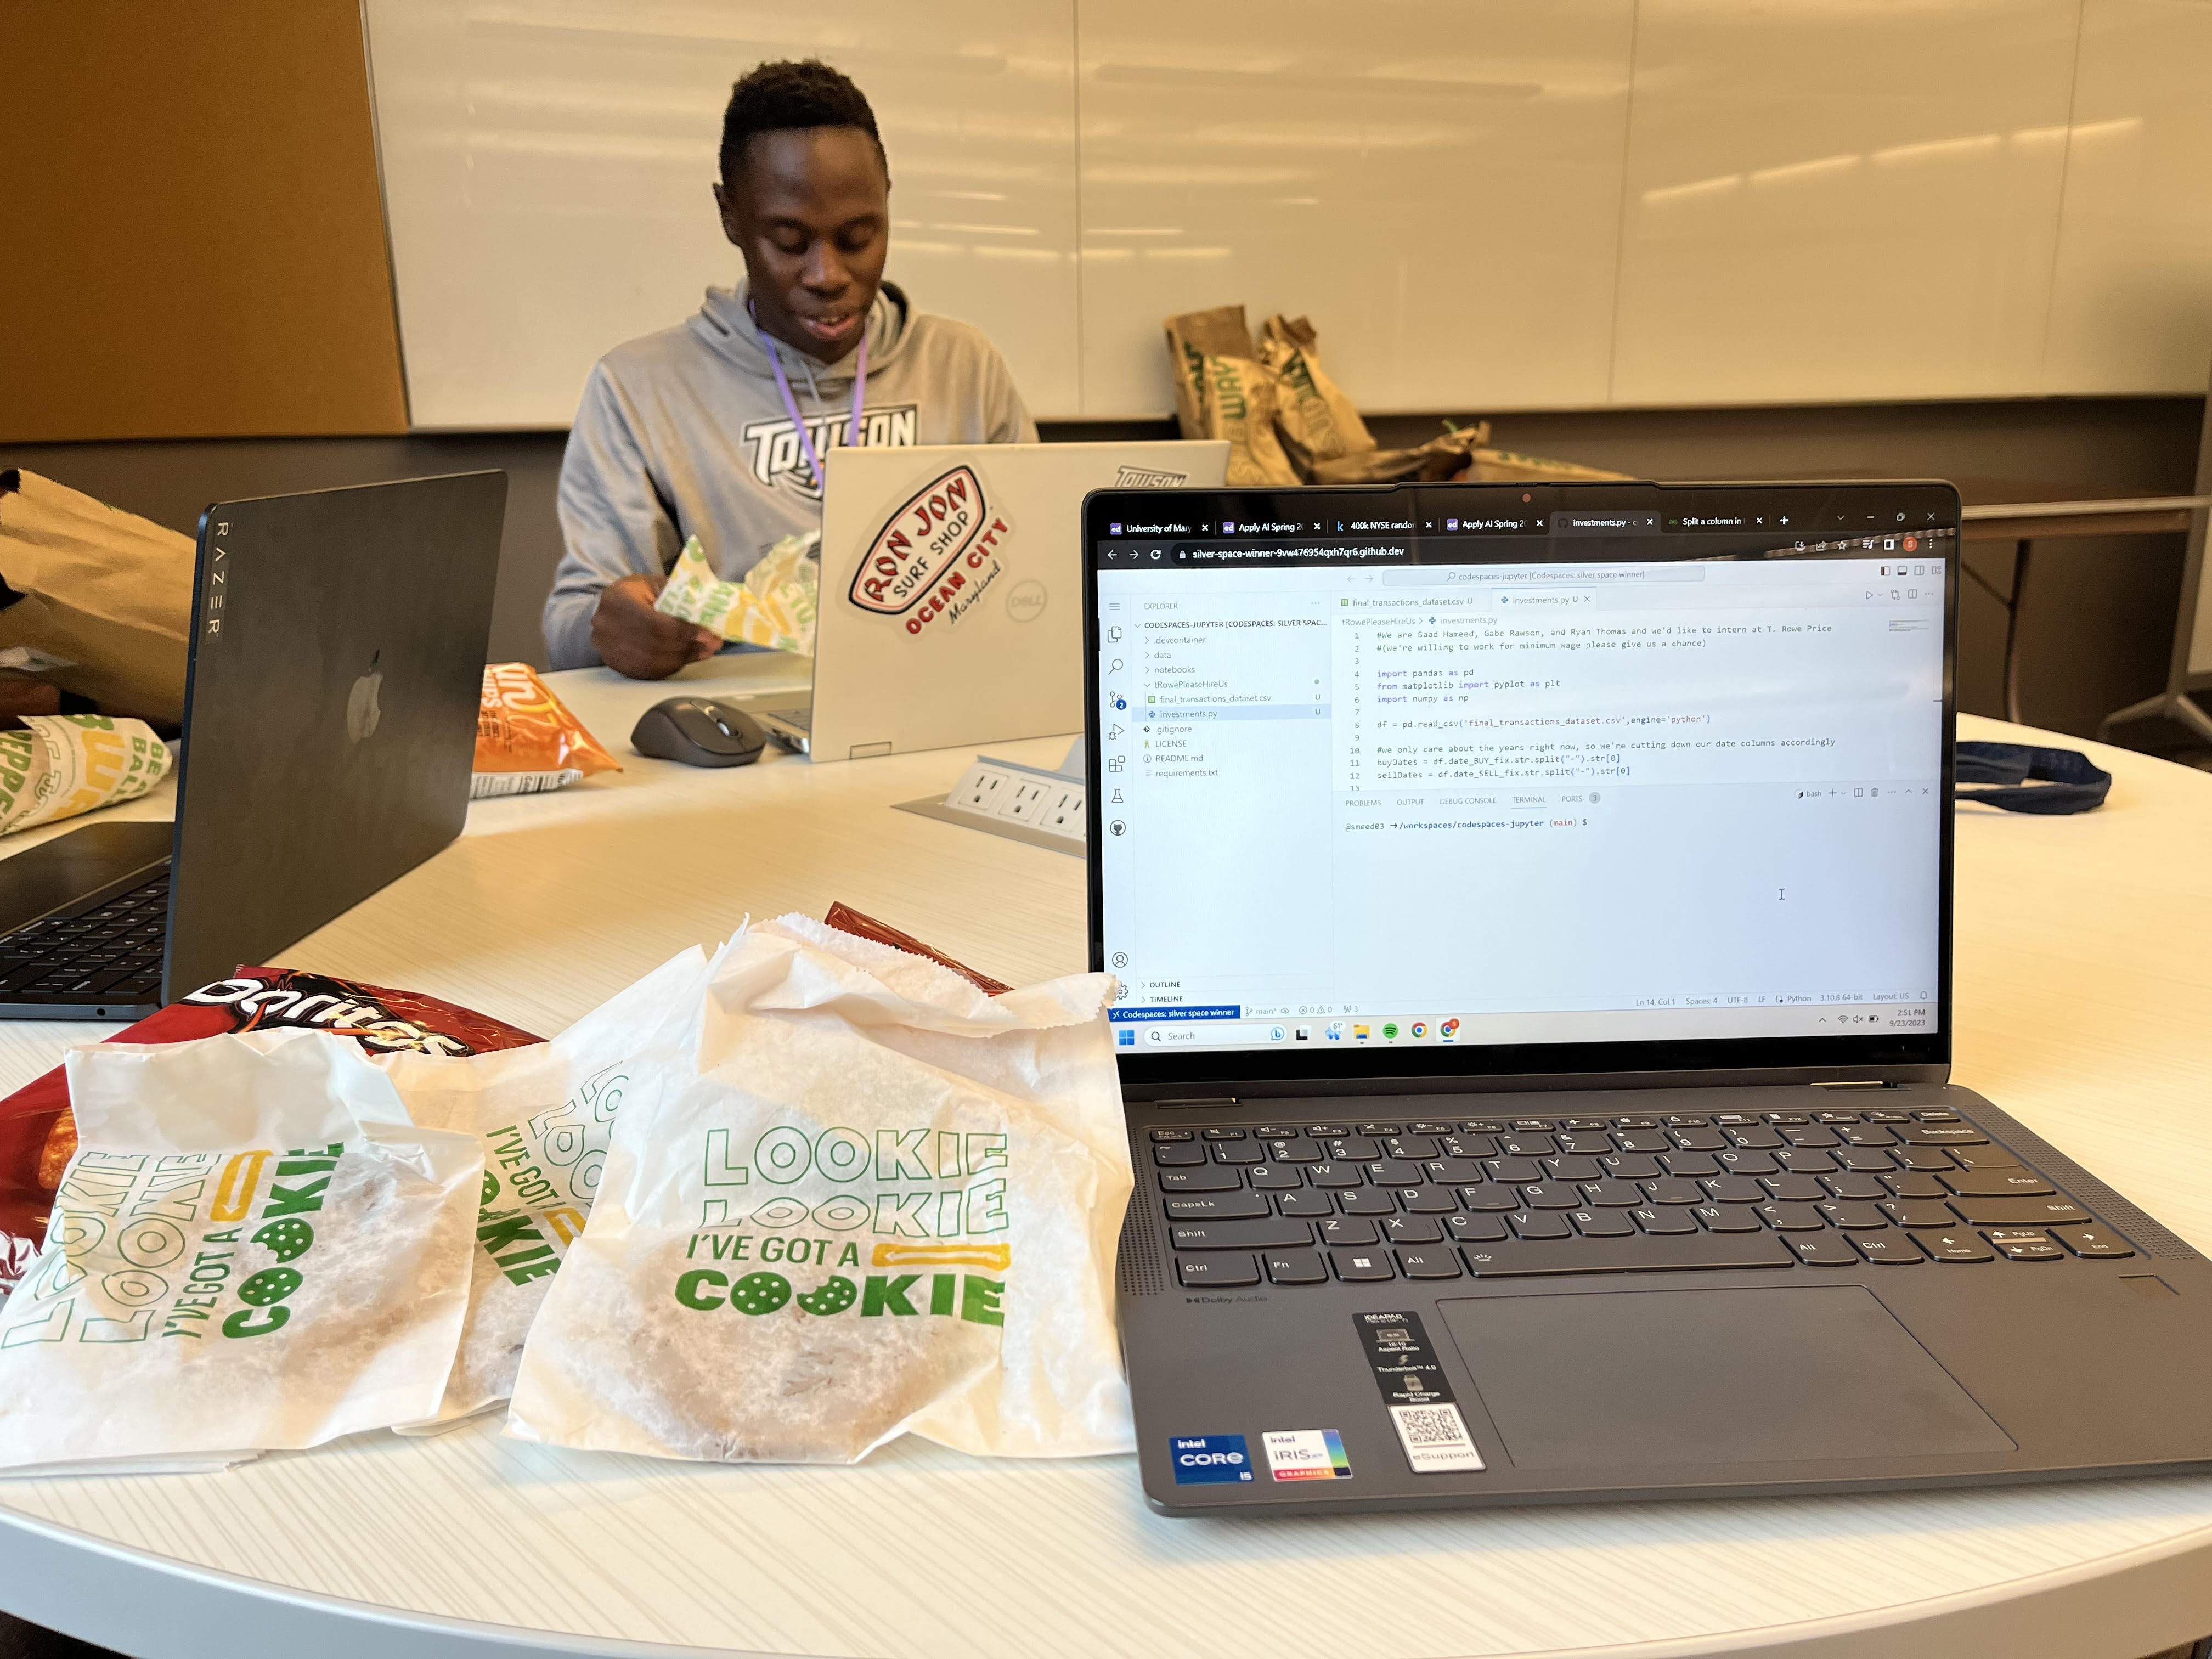
Please ignore the amount of Subway bags in the back (the volunteer guy insisted we take that many)
Inspiration
We knew we wanted to put our recently acquired pandas skills to the test. After a nice conversation with the T. Rowe Price representatives, we figured we'd try using a dataset related to finance/investing.
What it does
Using Python's pandas library, our code analyzes a csv file on over 400000 NYSE investments made over 10 years, helping us draw conclusions on what sectors we, as less experienced investors, might want to look into.
How we built it
We used the Jupyter Notebook template in a GitHub codespace, made a checklist of things we wanted to learn from the data, and proceeded to write code in separate cells for each task.
Challenges we ran into
We found that it was taking an annoyingly long time to run our code, as the dataset was rather large. In order to speed things up, we decided to drop unused columns of our dataset, which drastically picked up the pace.
Accomplishments that we're proud of
We're proud of everything we and everyone else accomplished today man <3
What we learned
We can do this. Also, the automotive industry is not where you want to put your money.
What's next for NYSE Analysis
There were a lot of different visualizations we wanted to try out for our data before we ended up getting sleepy. We'll probably add a correlation matrix between ESG scores and a few other columns to better analyze that value's impact. A few pie charts could be cool to see where people have been putting their money the most.

Log in or sign up for Devpost to join the conversation.