Inspiration
Signing a lease in New York is the largest financial commitment most people make on the least information. You get a twenty-minute viewing, fresh paint, and a landlord telling you the radiator "just needs bleeding."
The city already knows the truth. Every heat complaint, every hazardous violation, every bedbug filing is public — spread across seven separate NYC Open Data datasets, keyed by identifiers like BBL and BIN that no renter carries around. The information exists and is simply not reachable by the person standing in a hallway five minutes before they have to decide.
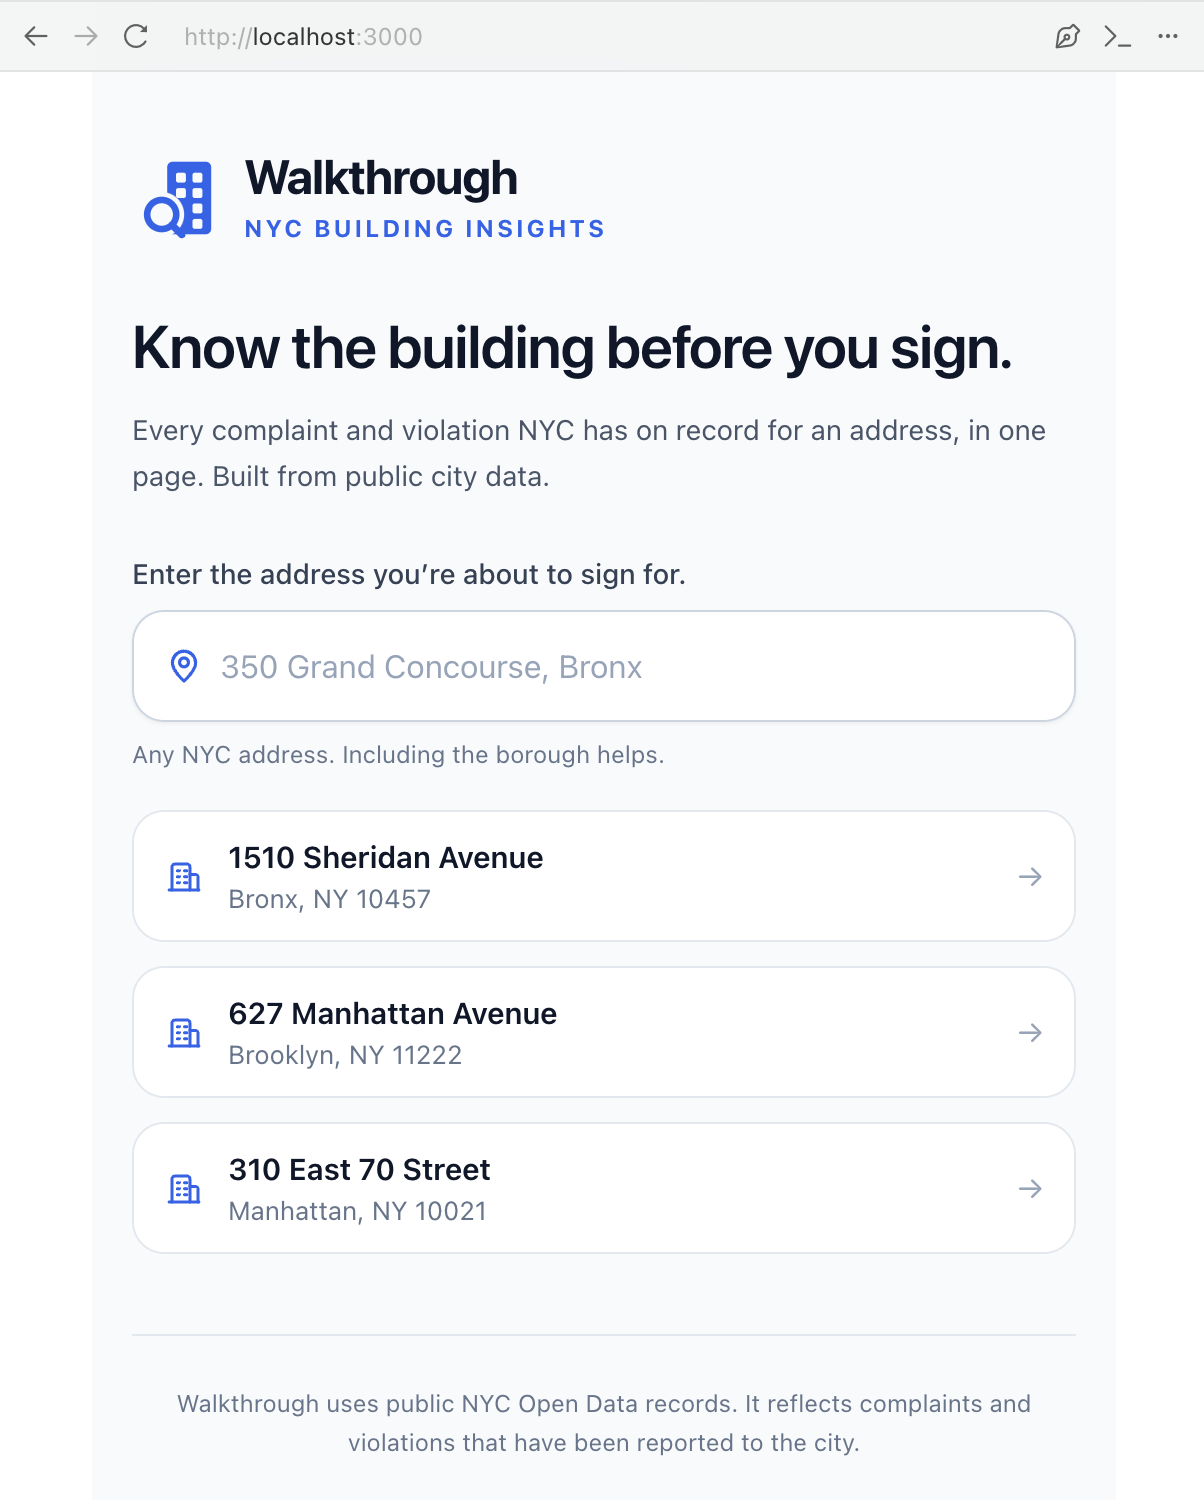
We wanted to collapse that gap into one search box.
What it does
You type a NYC address. Walkthrough resolves it to a tax lot, pulls that building's full public record, and returns a graded risk report.
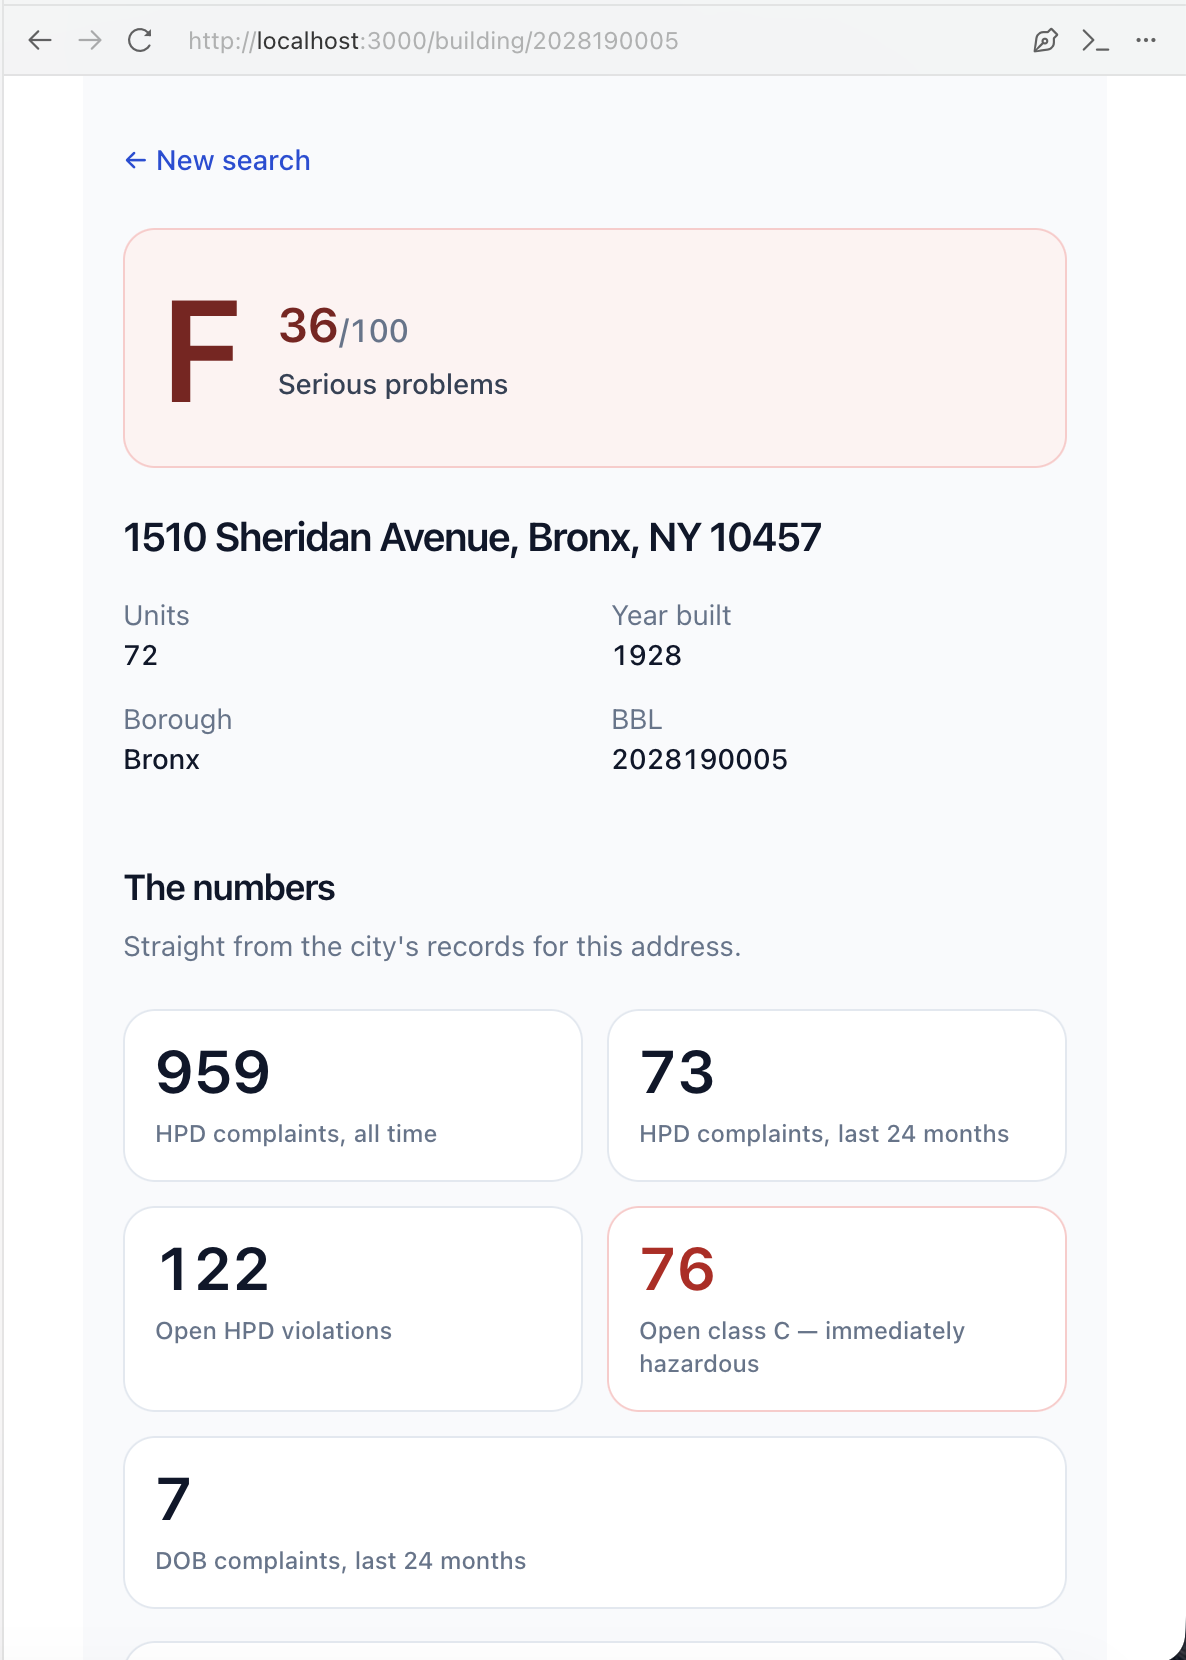
- A letter grade and a score out of 100, from a fixed, published formula — 12 points per open Class C (immediately hazardous) violation, 4 per open Class B, 1 per complaint in the last 24 months, normalized per unit so a 200-unit tower isn't punished for being large.
- The numbers, first. Total complaints, complaints in the last 24 months, open violations, open Class C violations, DOB complaints.
- Complaints per apartment per year, against the citywide median. A raw count of 959 complaints means nothing without a denominator. 0.51 per unit against a median of 0.28 means something immediately.
- What the complaints are actually about, bucketed into heat, plumbing, pests, electrical, structural, elevator, and safety.
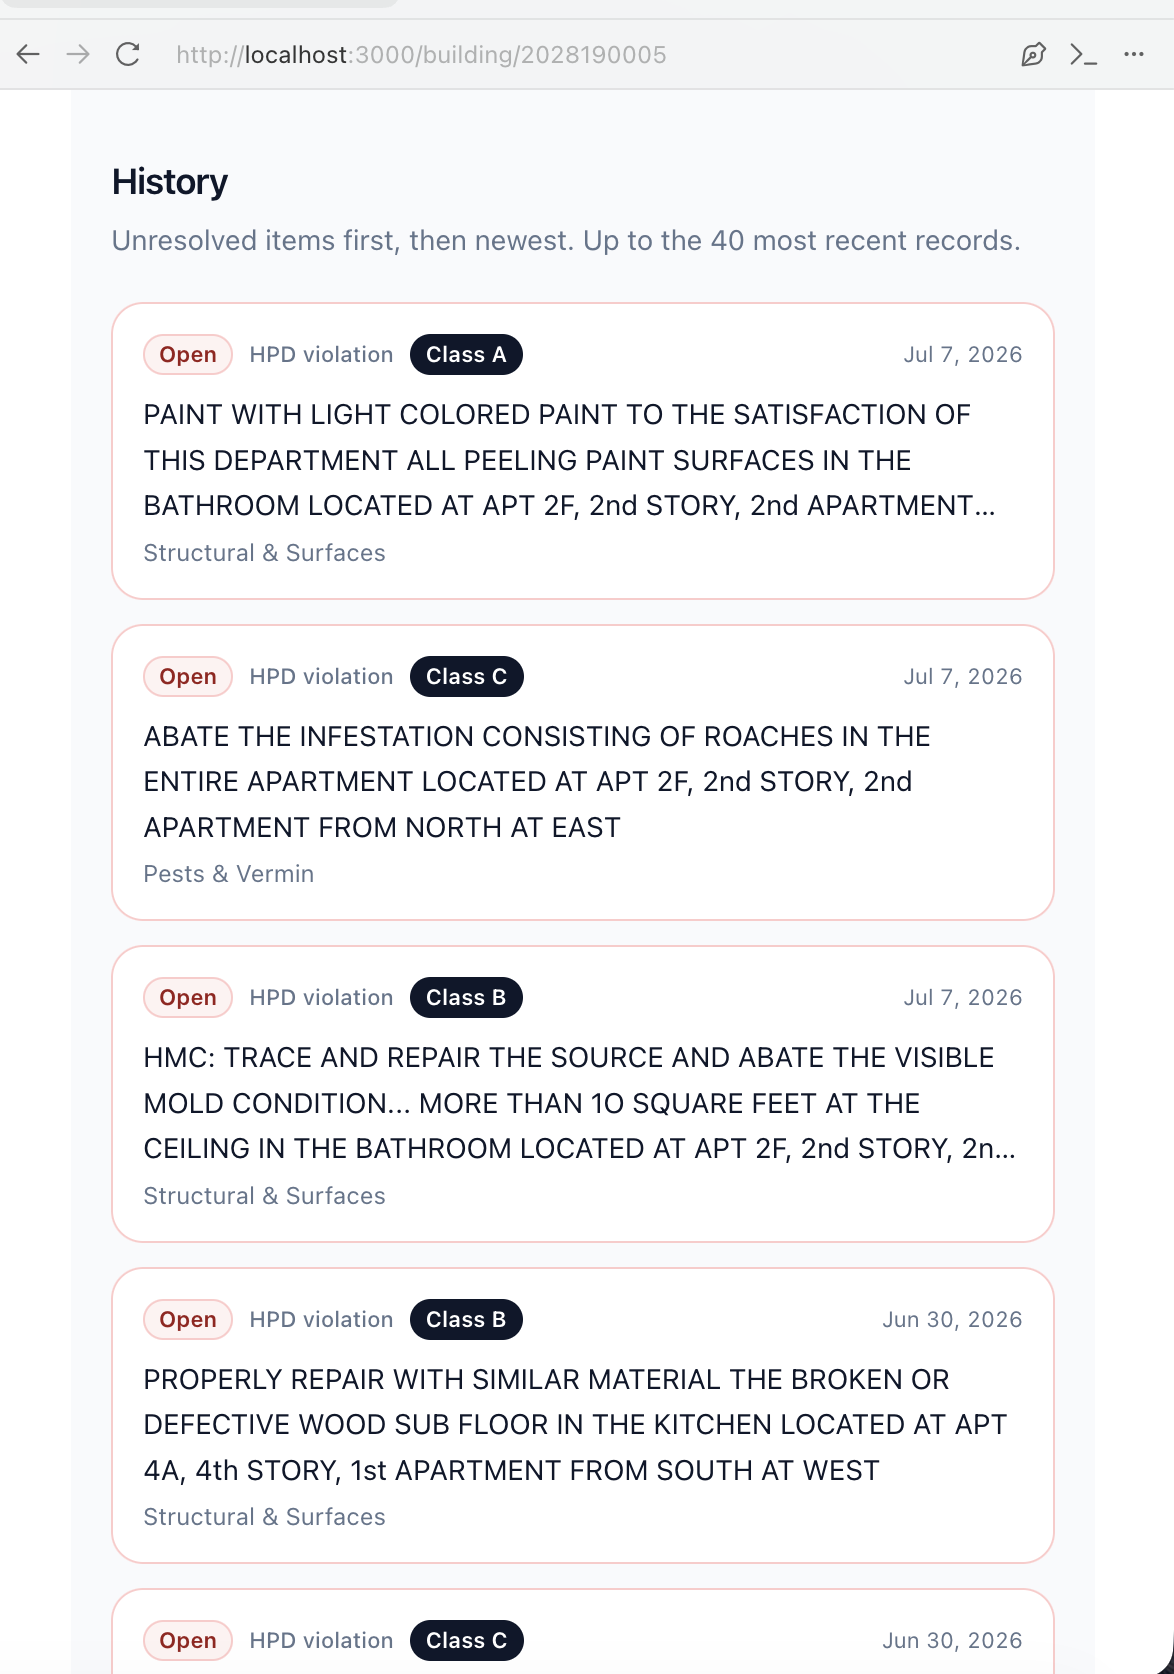
- A timeline of the newest 40 records, open items pinned first.
- "See the raw records" — every row links back to the city dataset it came from, so anyone skeptical can check our work in one tap.
- An AI summary, last. It interprets the numbers we computed and turns them into questions to ask at the viewing. It never calculates anything.
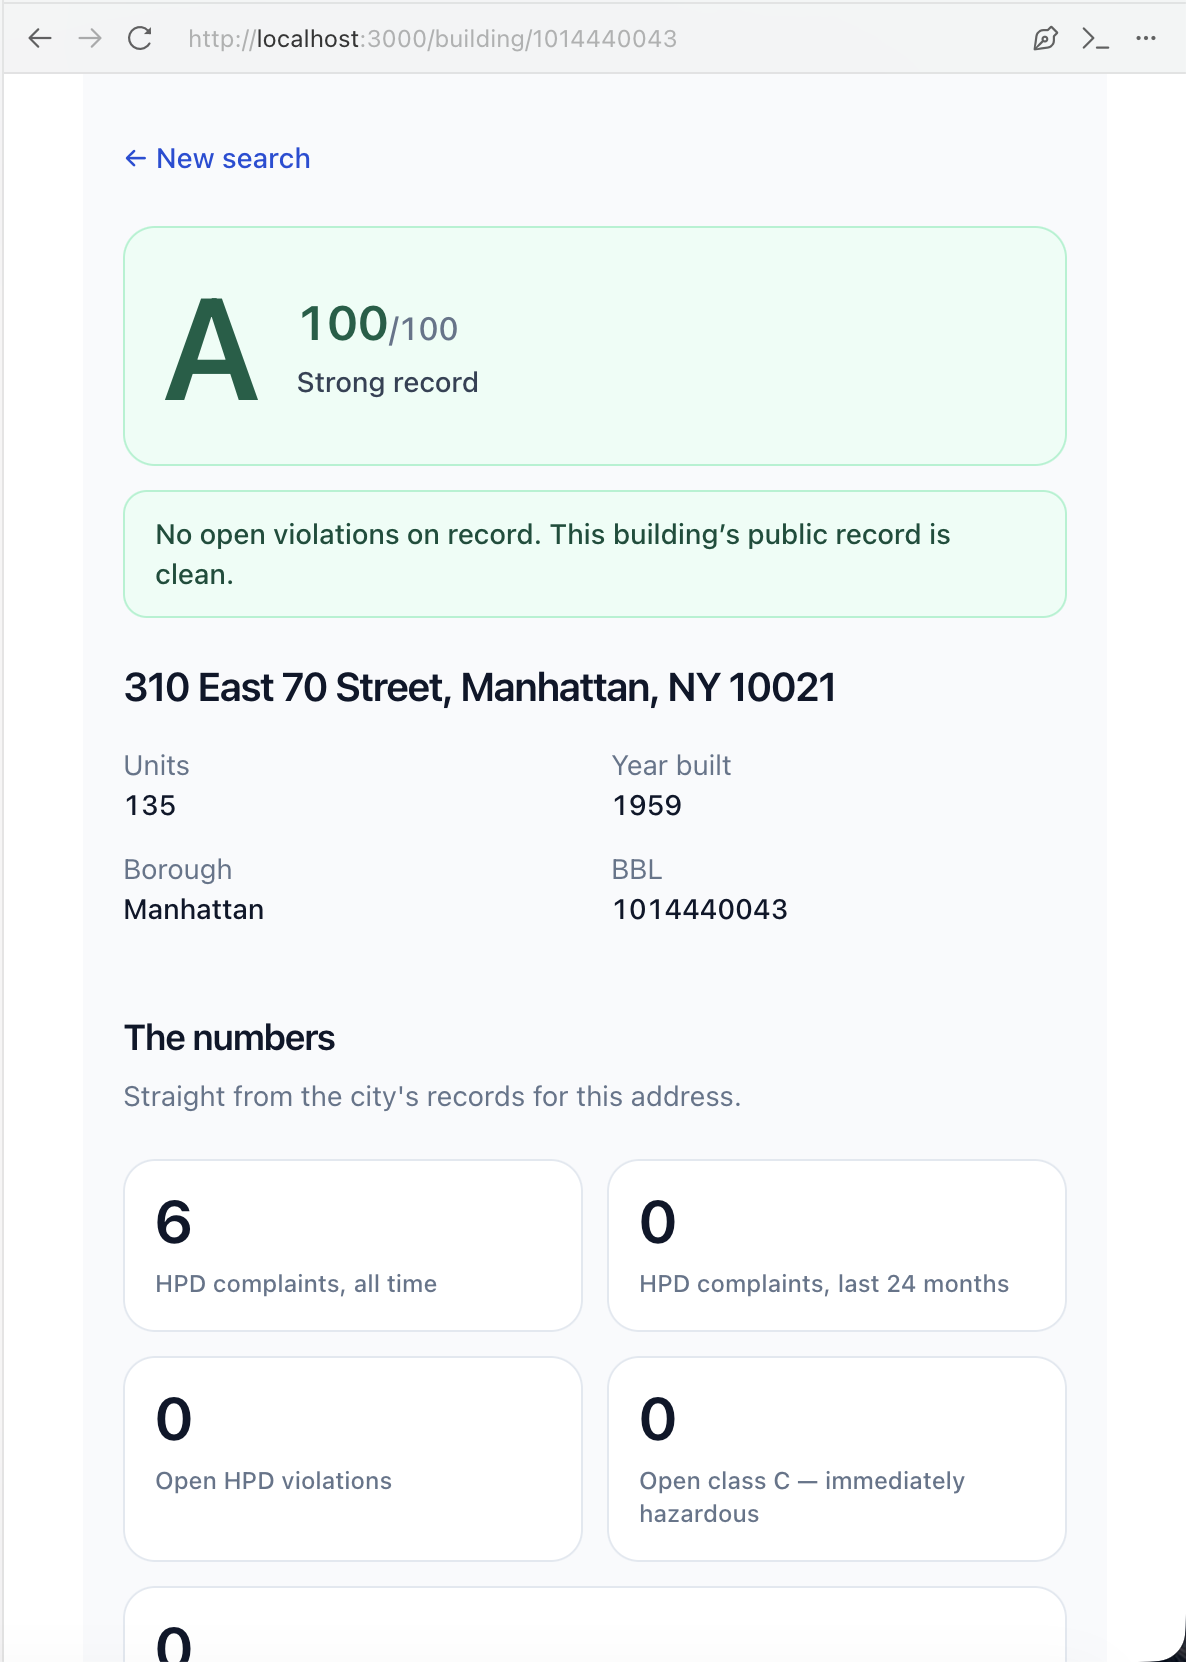
1510 Sheridan Avenue in the Bronx comes back an F: 36/100, 959 complaints, 122 open violations, 76 of them immediately hazardous. 310 East 70th Street comes back an A. Same pipeline, opposite verdicts.
How we built it
Next.js 14 App Router, TypeScript in strict mode, Tailwind. Three of us built in
parallel against a frozen type contract — a single lib/types.ts defining every
shape and route, agreed in the first hour and never edited after. That let the
frontend build against mock reports before a single city API call worked.
The data layer fans out to seven Socrata datasets in parallel with
Promise.allSettled, filtered server-side with $where/$select/$limit so we
pull tens of rows instead of thousands. Any single dataset failing degrades into
a visible warning on the report rather than a failed request.
Five guardrails sit in front of all of it, because a demo that depends on a live government API is a demo that breaks on stage:
- Committed fixtures for the demo buildings, checked first, zero network calls
- A file-backed cache keyed by BBL with a 24-hour TTL
- Retries on 429/5xx — three attempts at 500ms/1s/2s with jitter
- A circuit breaker that stops calling after 5 consecutive failures for 60s
- In-flight request deduplication, so ten people loading one building make one round of calls
The rule we would not break: an LLM never computes a number. Every statistic,
score, and grade is calculated in TypeScript. The narrative endpoint accepts
aggregates only — post a raw record array and it rejects with BAD_INPUT. The
model's output is then checked against the numbers we sent it, and any figure it
invented gets the whole narrative thrown away. On any failure it returns null and
the page renders completely without it.
Challenges we ran into
Two of the dataset IDs in the docs were dead. The documented HPD Complaints and Complaint Problems endpoints both returned 403. We searched the portal and found a single replacement dataset that covers both. Lesson learned early: curl every endpoint before writing a line of code against it.
The "unit count" dataset has no unit count. Housing Registrations doesn't
carry one, which broke the per-unit math that makes the whole report meaningful.
We added PLUTO for unitsres and yearbuilt — and when a lot genuinely has no
unit count, we show "Unit count unavailable" rather than inventing a denominator.
City data is not clean. DOB complaint dates are stored as text in MM/DD/YYYY, so they can't be compared as dates server-side — we filter roughly by year in the query and apply the exact cutoff in TypeScript. DOB violation block and lot numbers are inconsistently zero-padded, so we query every padding variant. Some buildings return placeholder "million BINs" that we normalize to null instead of trusting.
A number that looked impossible was correct. Our category counts summed to more than the building's total complaint count. We assumed a bug. It turned out a single HPD complaint can raise several problems at once — one filing legitimately appears under plumbing and pests and paint. Our mock data had encoded a false invariant that real data disproved, so we fixed the mocks and said so in the UI.
A rate limit was reporting itself as a missing building. Our error contract
had four codes but only three were ever emitted — a 429 came back as
UPSTREAM_DOWN. Threading it through properly surfaced a worse bug underneath:
one fetcher short-circuits when it can't resolve a BIN, which counted as a
success, which meant a total upstream failure fell through to
BuildingNotFound. A rate-limit storm was telling renters the building didn't
exist. Now "not found" is only claimed when the datasets carrying those records
actually answered.
Then NYC's geocoder went down mid-build. 503 on every request for about half an hour. Nothing we could do — and nothing we needed to do, because the demo buildings are committed fixtures that never touch the network. The guardrails earned themselves back that afternoon.
Accomplishments that we're proud of
The report is auditable. Every figure traces to a named, linked city dataset, and the score formula is fixed and published rather than a black box. That's the difference between a tool a renter can act on and a number they have to take on faith.
We were honest about uncertainty in a way that was often harder than faking confidence: showing "unit count unavailable" instead of a fabricated per-unit rate, surfacing dataset failures as warnings on the report, and stating plainly that this reflects complaints that were filed — a quiet record is not proof of a well-run building.
We built an adversarial smoke test that runs the live pipeline against nine deliberately awkward addresses — a commercial tower with no HPD registration, a Staten Island lot with no PLUTO unit count, a hyphenated Queens house number, a condo with unusual lot numbering, new construction with almost no history, and Central Park, which is not a building at all. All nine pass.
And three people shipped in parallel for twelve hours with essentially no integration pain, because we froze the contract before we wrote the code.
What we learned
Read the actual API response before writing the parser. Every single assumption we made from documentation was wrong somewhere — dead IDs, text-typed dates, inconsistent padding, missing columns.
Trust real data over your own test fixtures. Our mocks encoded an invariant that doesn't hold in reality, and only a live run against a messy Bronx building caught it.
Design for the upstream being down, not up. Two of the three external services we depend on failed at some point during the build. The fixtures and circuit breaker weren't paranoia; they were the difference between having a demo and not.
And the discipline that mattered most was the smallest: deciding up front that the model interprets numbers and never produces them. It made every downstream question easy to answer.
What's next for Walkthrough
Photo analysis at the viewing. Point your camera at a water stain and get back observations and questions — never diagnoses, because a confident wrong answer about mold is worse than none. The best moment is the cross-link: "You spotted possible water damage — this building has 7 open plumbing complaints." That connection between what you can see and what the city already recorded is the whole thesis of the product.
A shareable card, because nobody signs a lease alone. One screenshot with the grade, the top concerns, and the questions to ask, sized for a text message to a partner or parent.
Rent-stabilization and eviction-filing history, both public, both things a renter should see before signing.
Landlord-level view. BBLs roll up to owners. If the building you're seeing is clean but the same landlord's other eleven buildings are not, that is worth knowing.
Beyond NYC. The hard part isn't the code, it's that most cities don't publish this. Chicago and Boston do.
Built With
- anthropic-claude
- html
- json-schema
- next.js
- node.js
- nyc-open-data
- nyc-planning-labs-geosearch
- react
- rest-api
- socrata
- tailwindcss
- typescript


Log in or sign up for Devpost to join the conversation.