Inspiration
On October 28, 2019, a video of around ten police officers tackling and pulling guns on a black teen for evading the $2.75 subway fare in New York City went viral. A few months before, the MTA calculated they were losing millions annually to those who evade paying the transit fare. The MTA deployed 500 new officers to watch for turnstile hoppers, hoping to make up the lost money. Hence, this project explores how fare evasion enforcement in New York City has changed recently as well as the demographic trends for areas with outstanding rates of fare evasion enforcement.
What it does
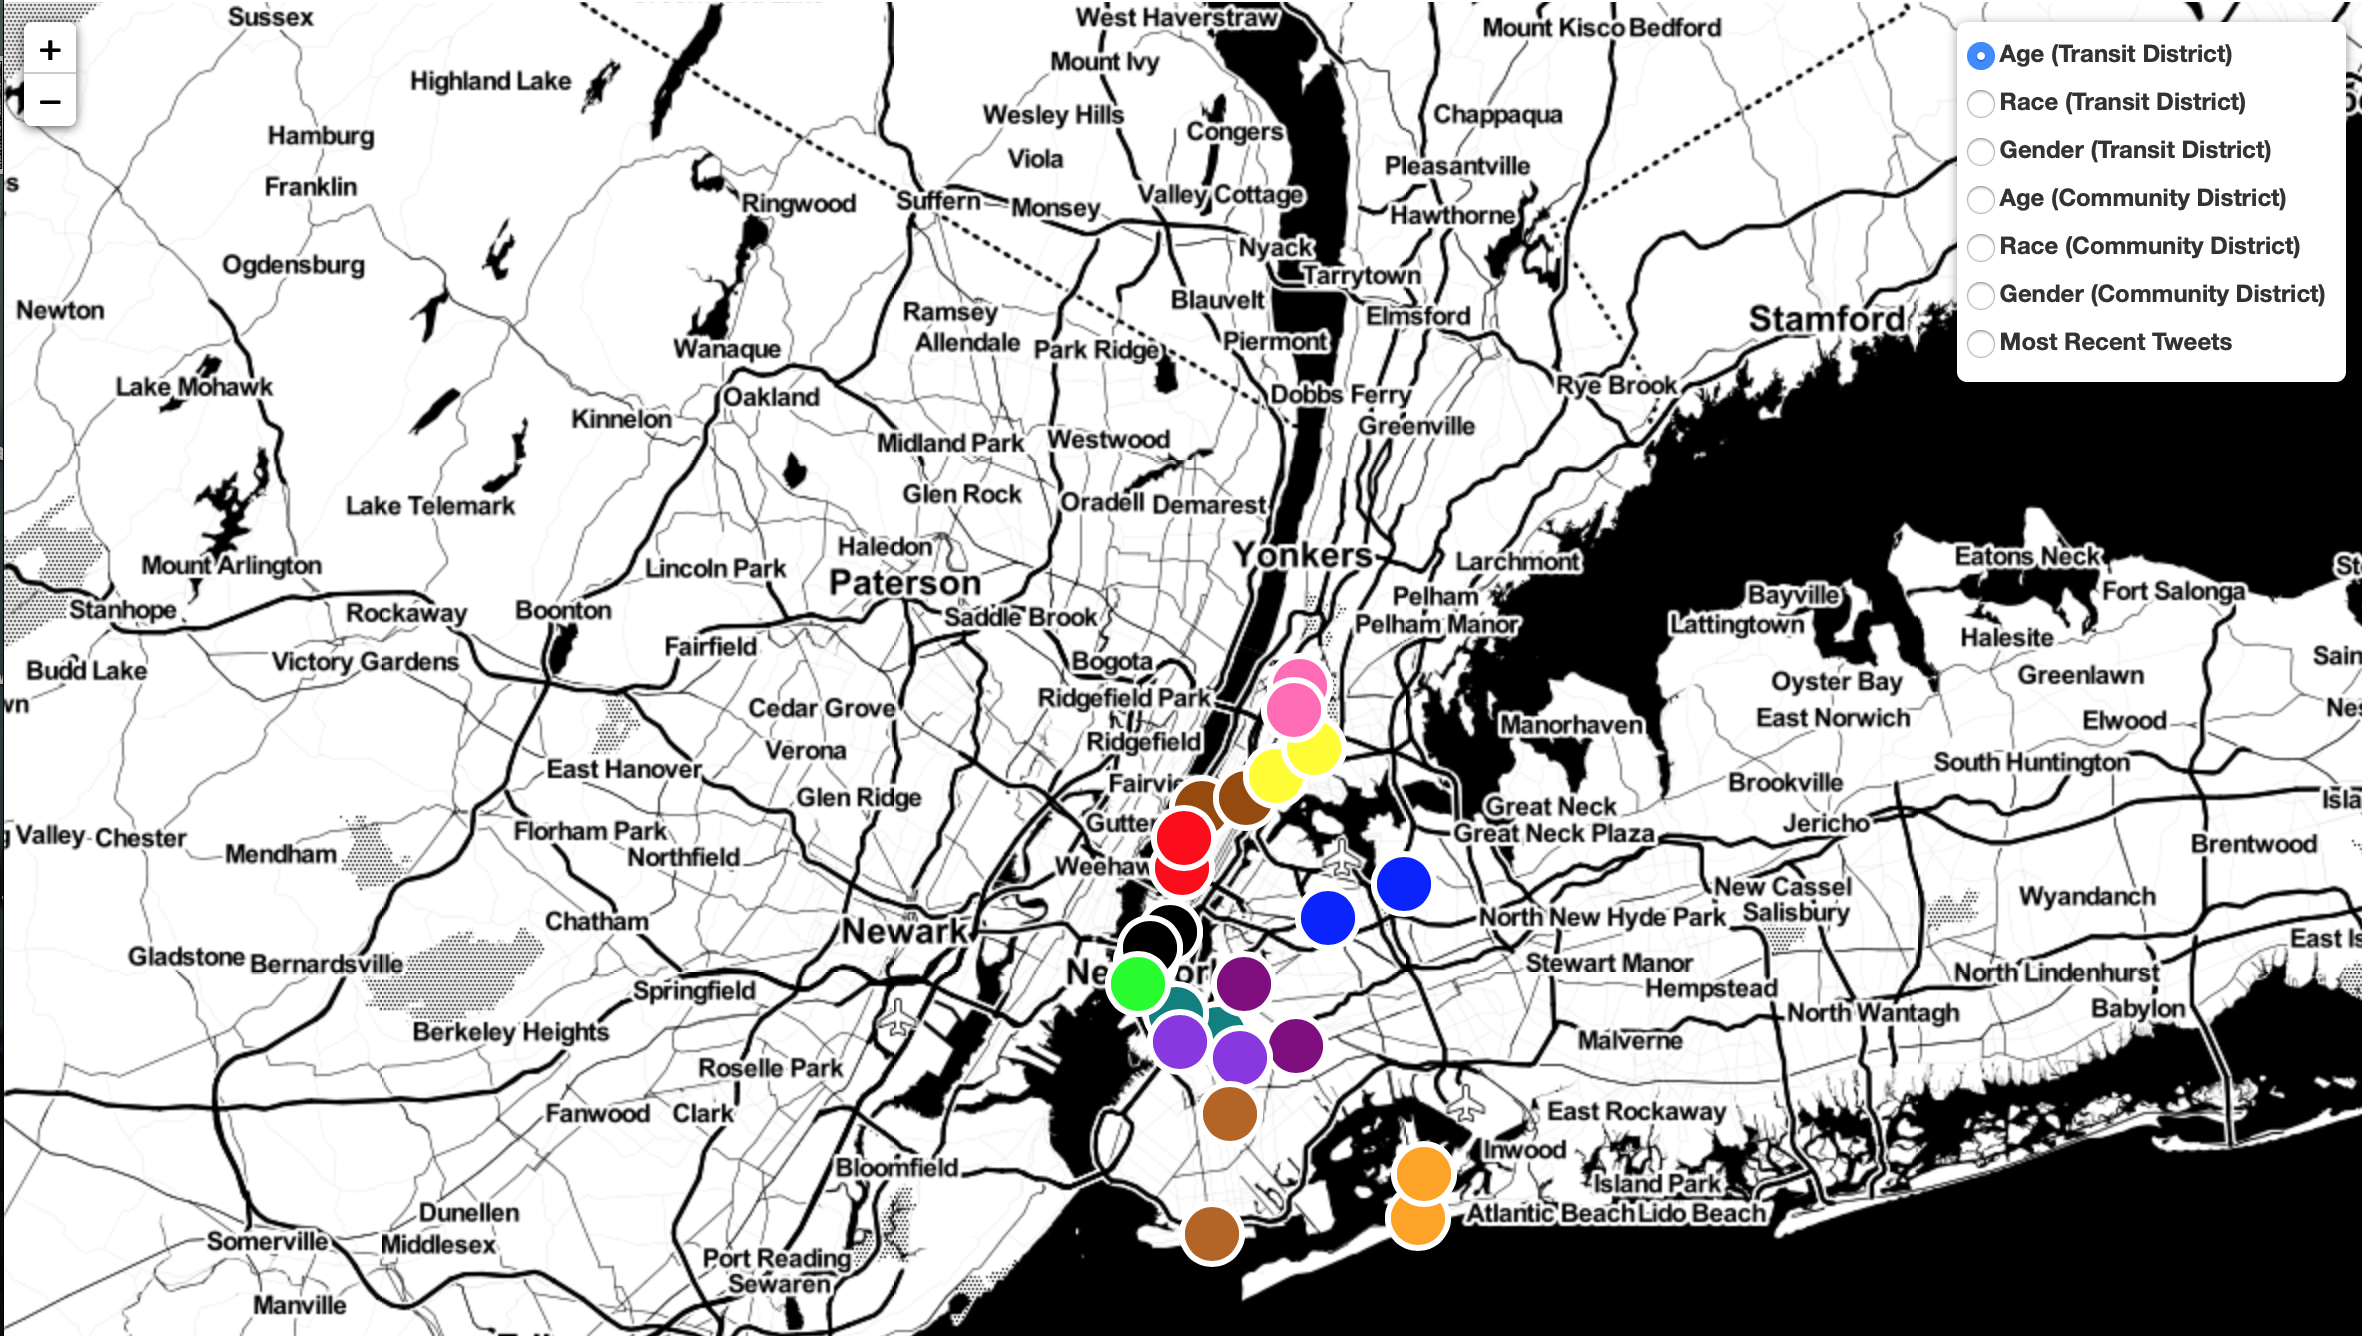
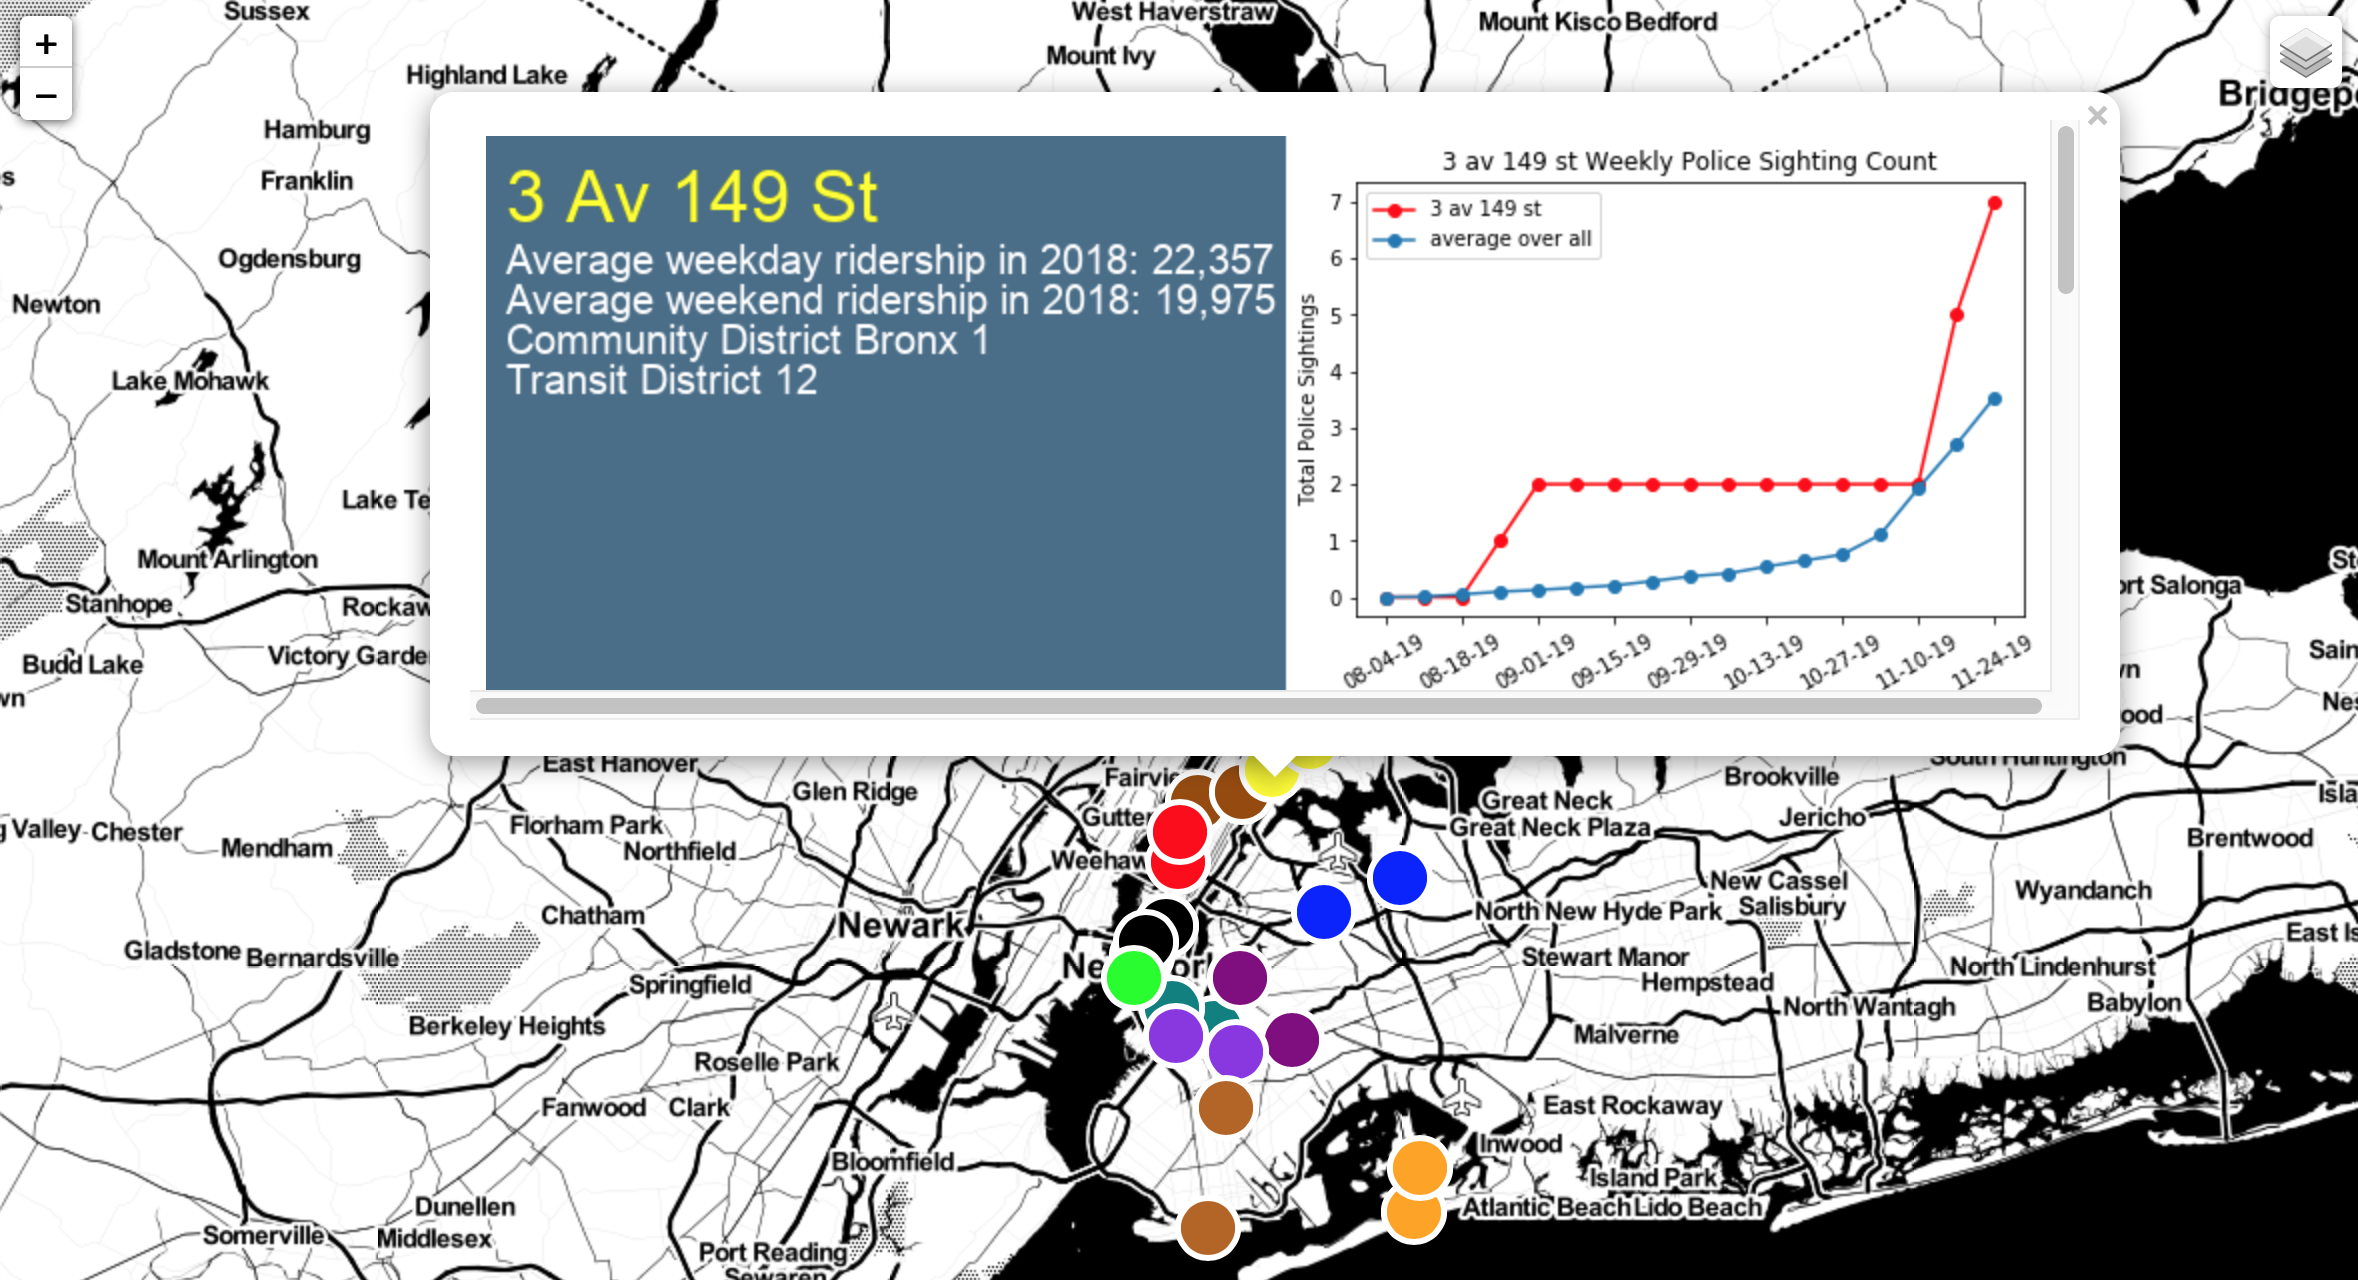
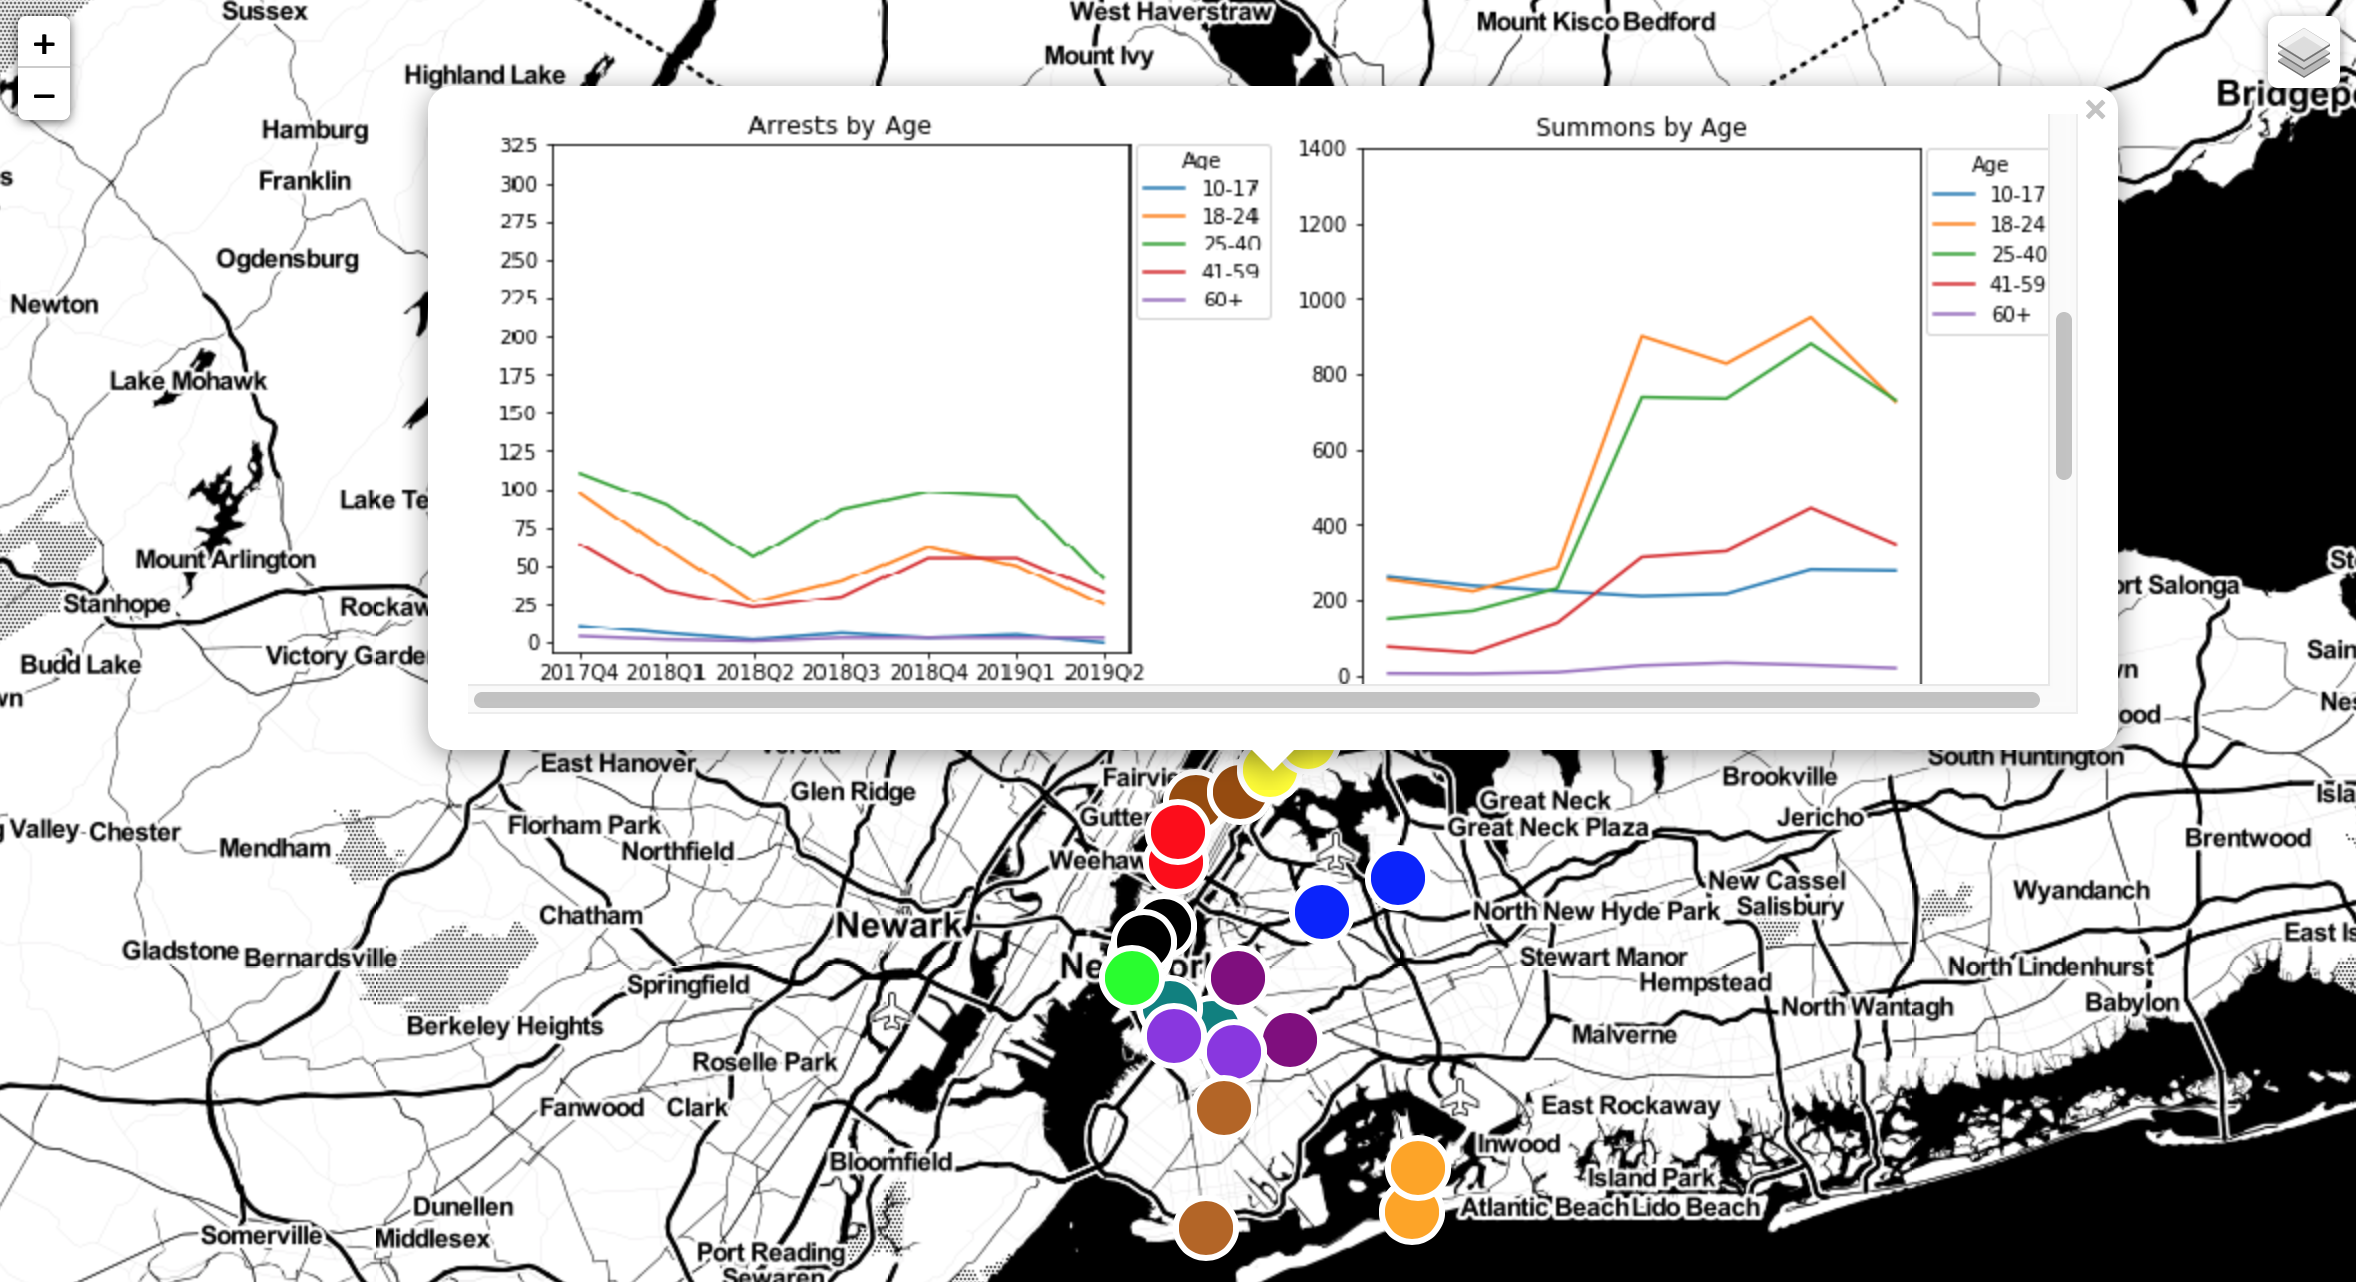
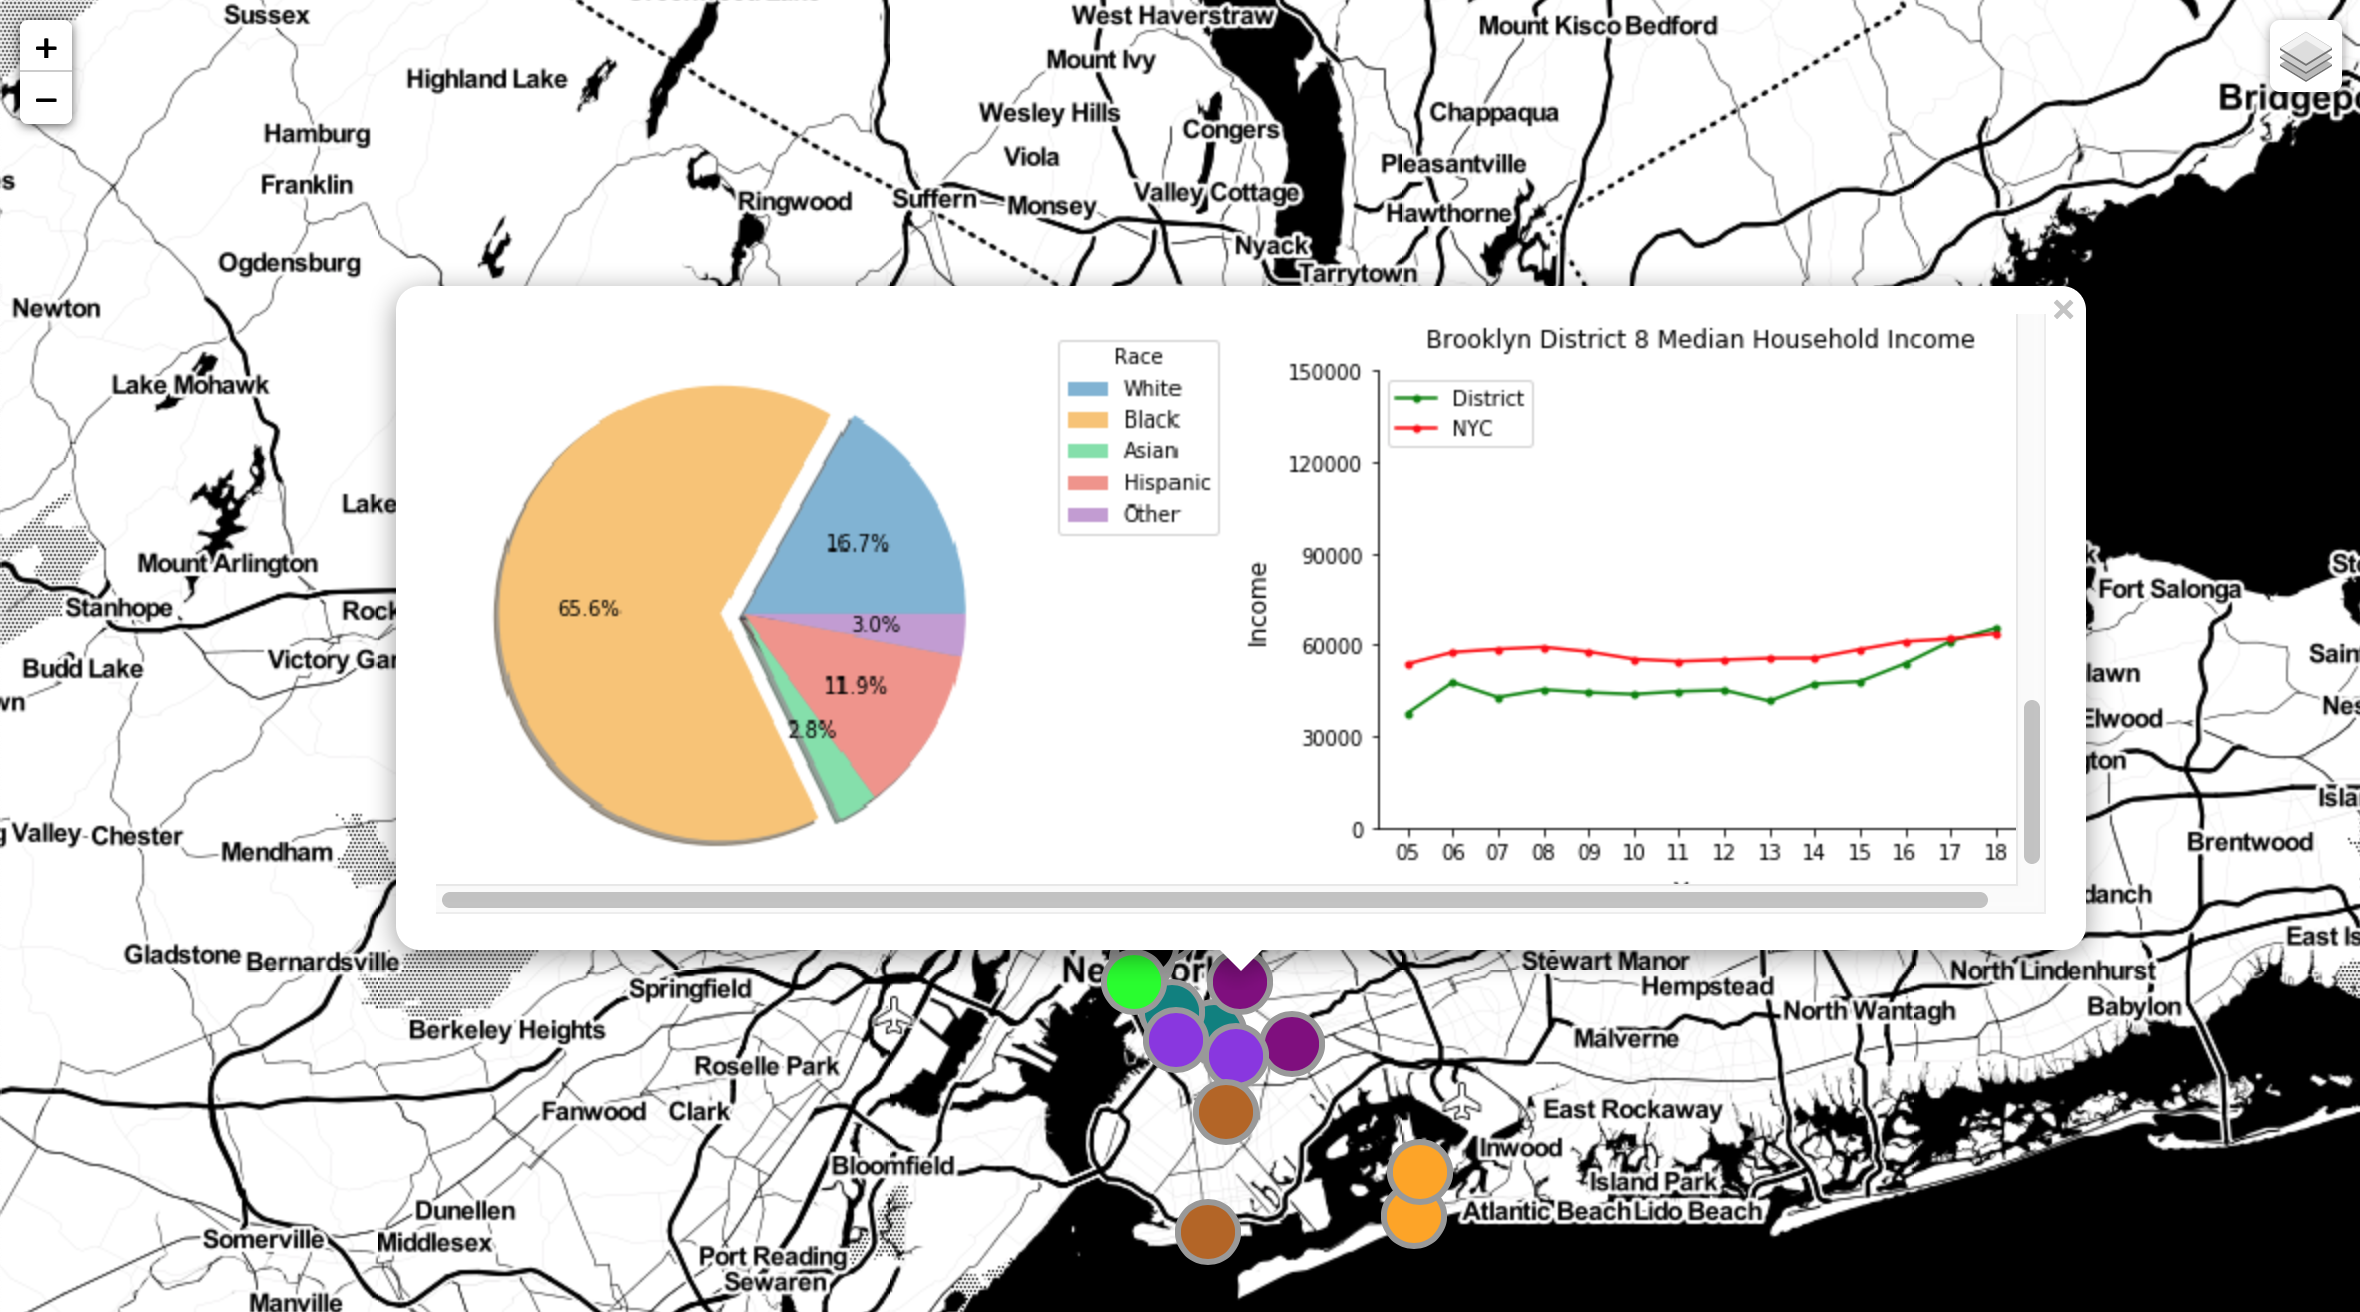
The visualizations of demographics and arrests data hosted on an interactive map of New York City demonstrate several key findings. Many stations have a trend of decreasing fare evasion arrests followed by an increase in summonses. No matter the community racial demographics, African Americans are almost always the top demographic for arrests. Ages 25-40 are often the top age for arrests while ages 18-24 are the top age for summonses.
How I built it
I wrangled census data for demographics and median income per NYC district to correlate with fare evasion arrests data per subway station. I created data frames and visualizations for the corresponding data using Python's pandas and matplotlib packages. To host my findings, I developed a webpage with an interactive map of New York City using HTML, CSS, and Python's folium package.
What I learned
By working on this project, I learned how to use Python's numpy, pandas, and matplotlib packages for data analytics and visualization.

Log in or sign up for Devpost to join the conversation.