-
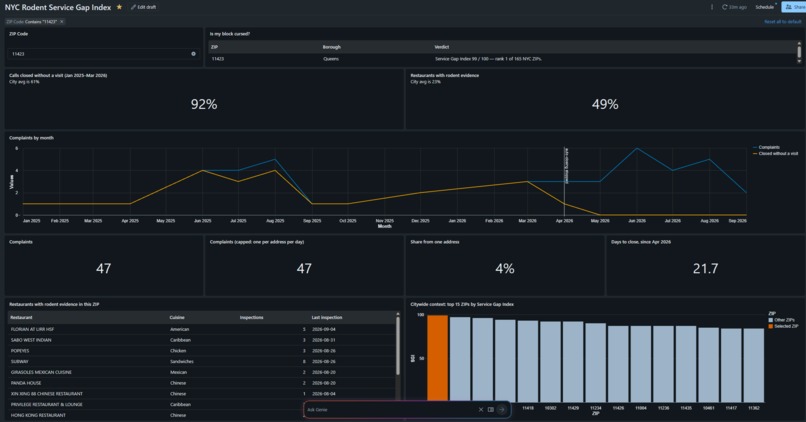
11423, Hollis
-
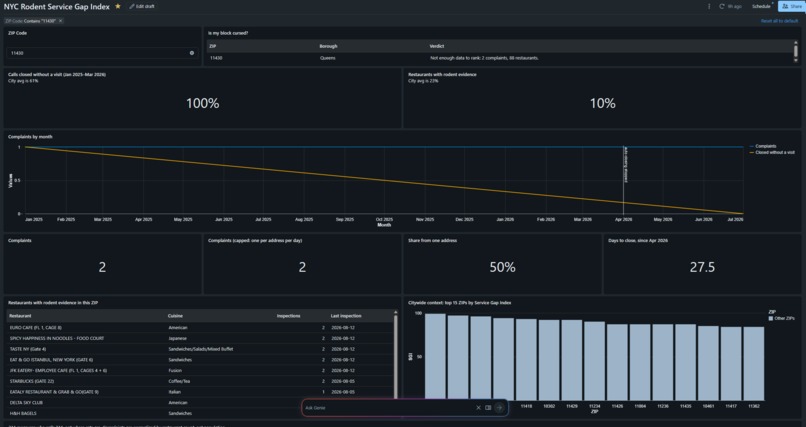
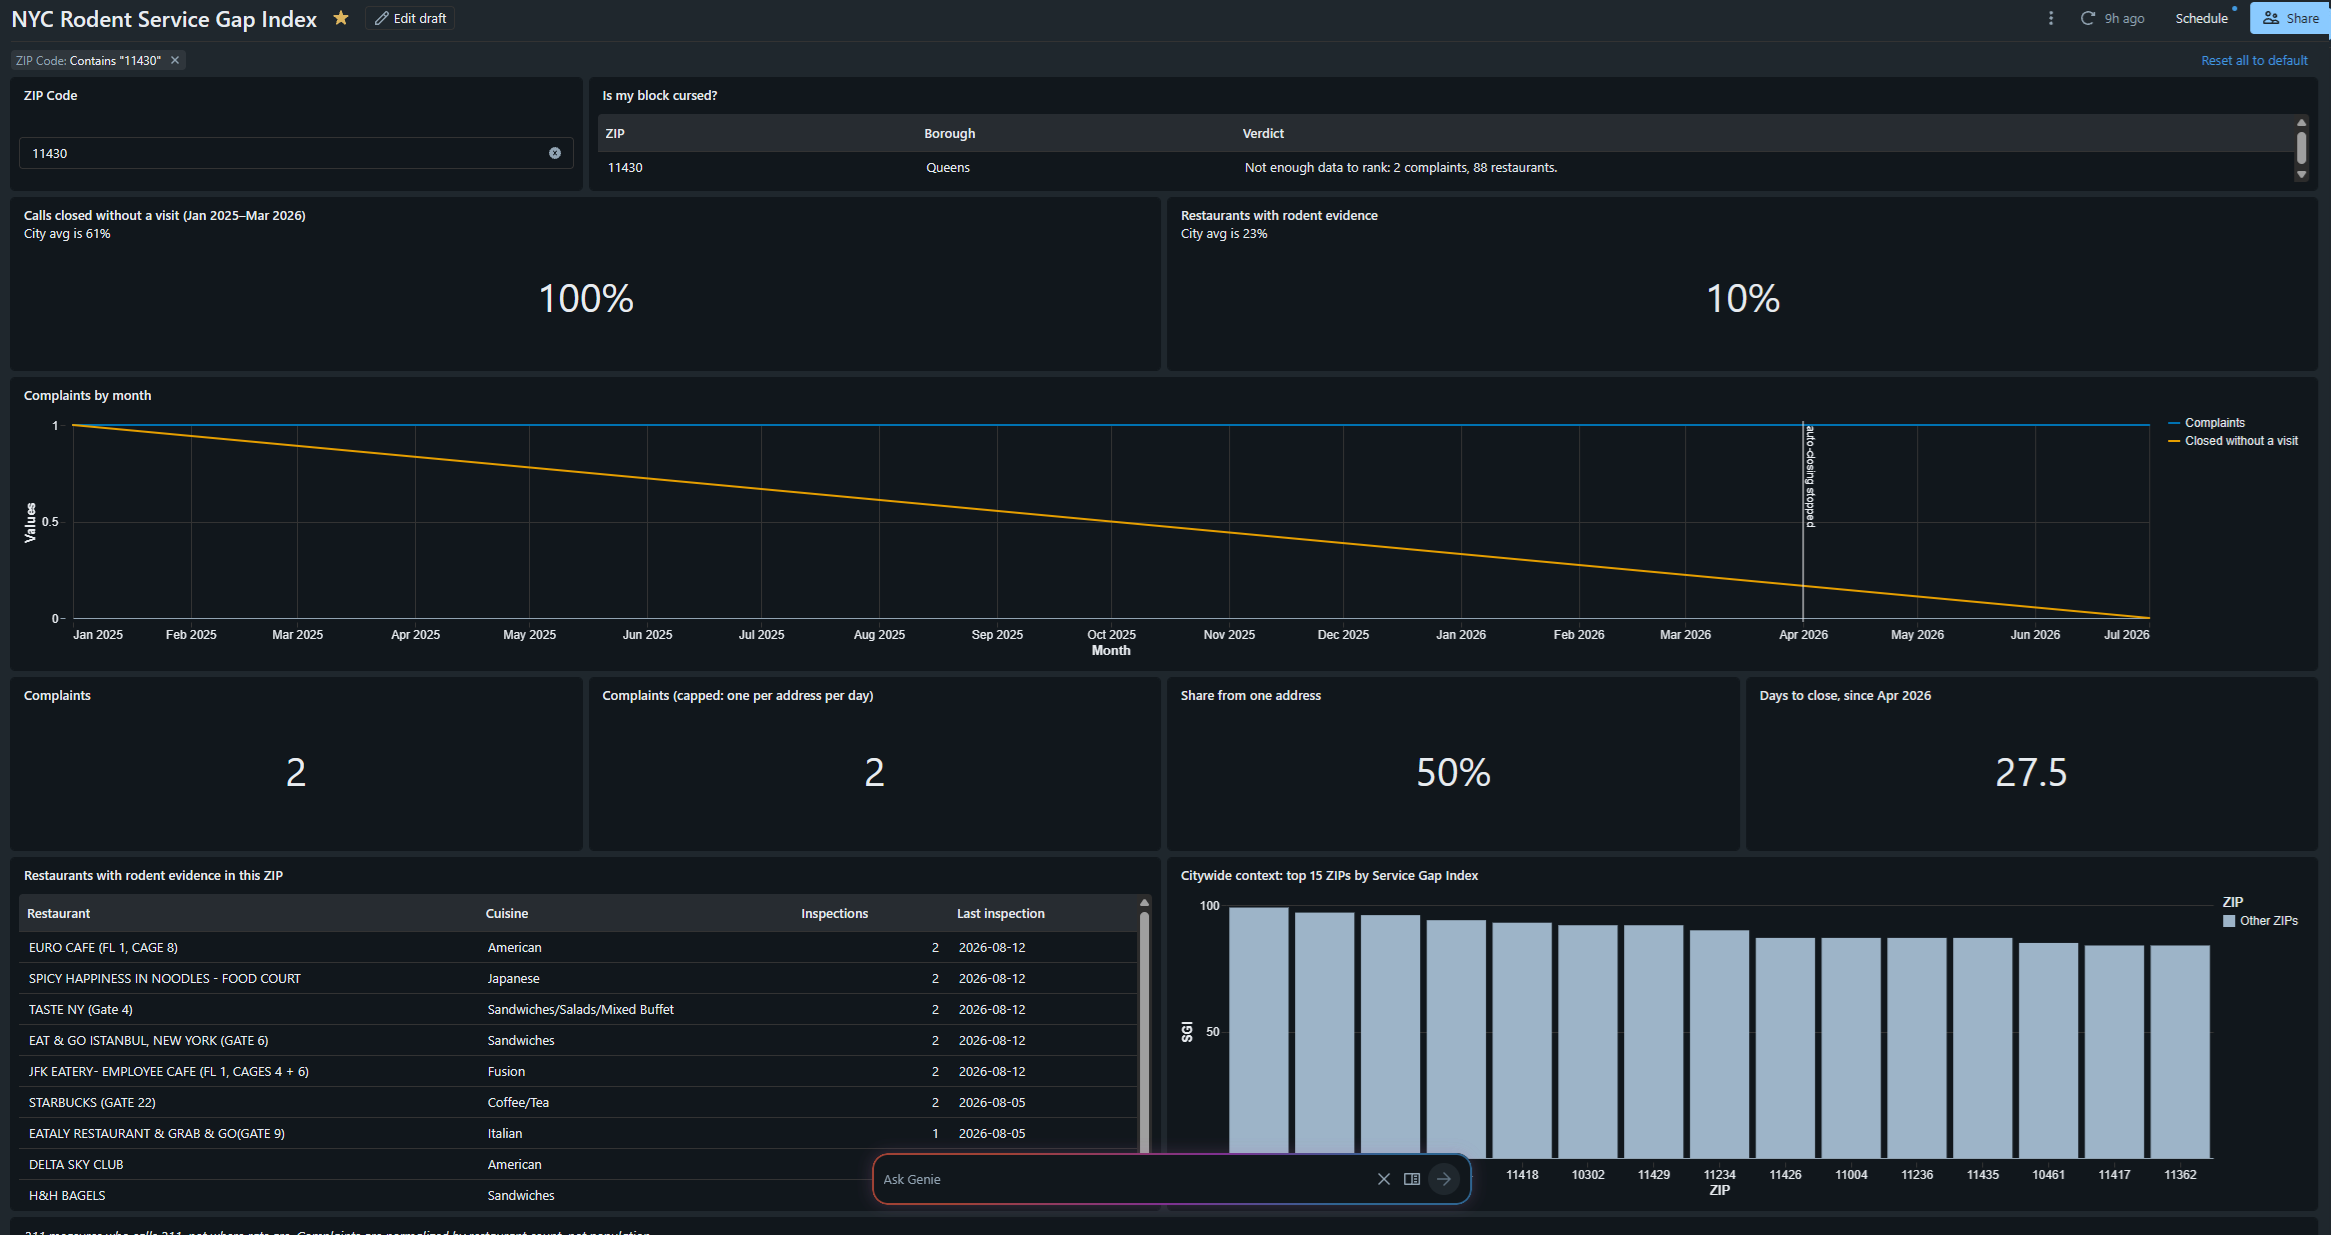
11430, JFK
-
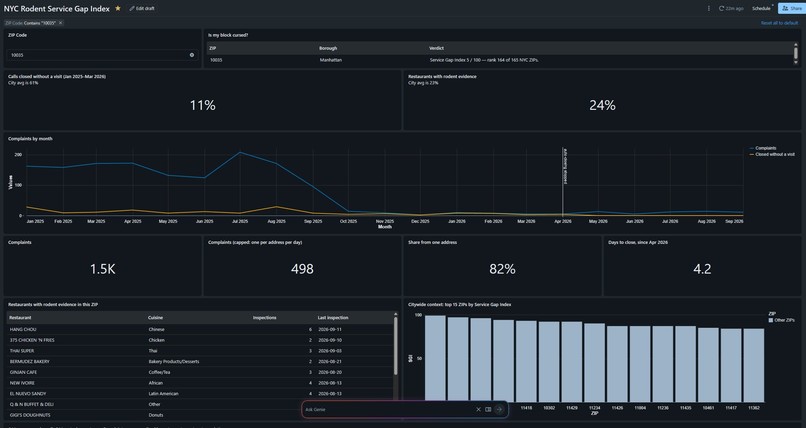
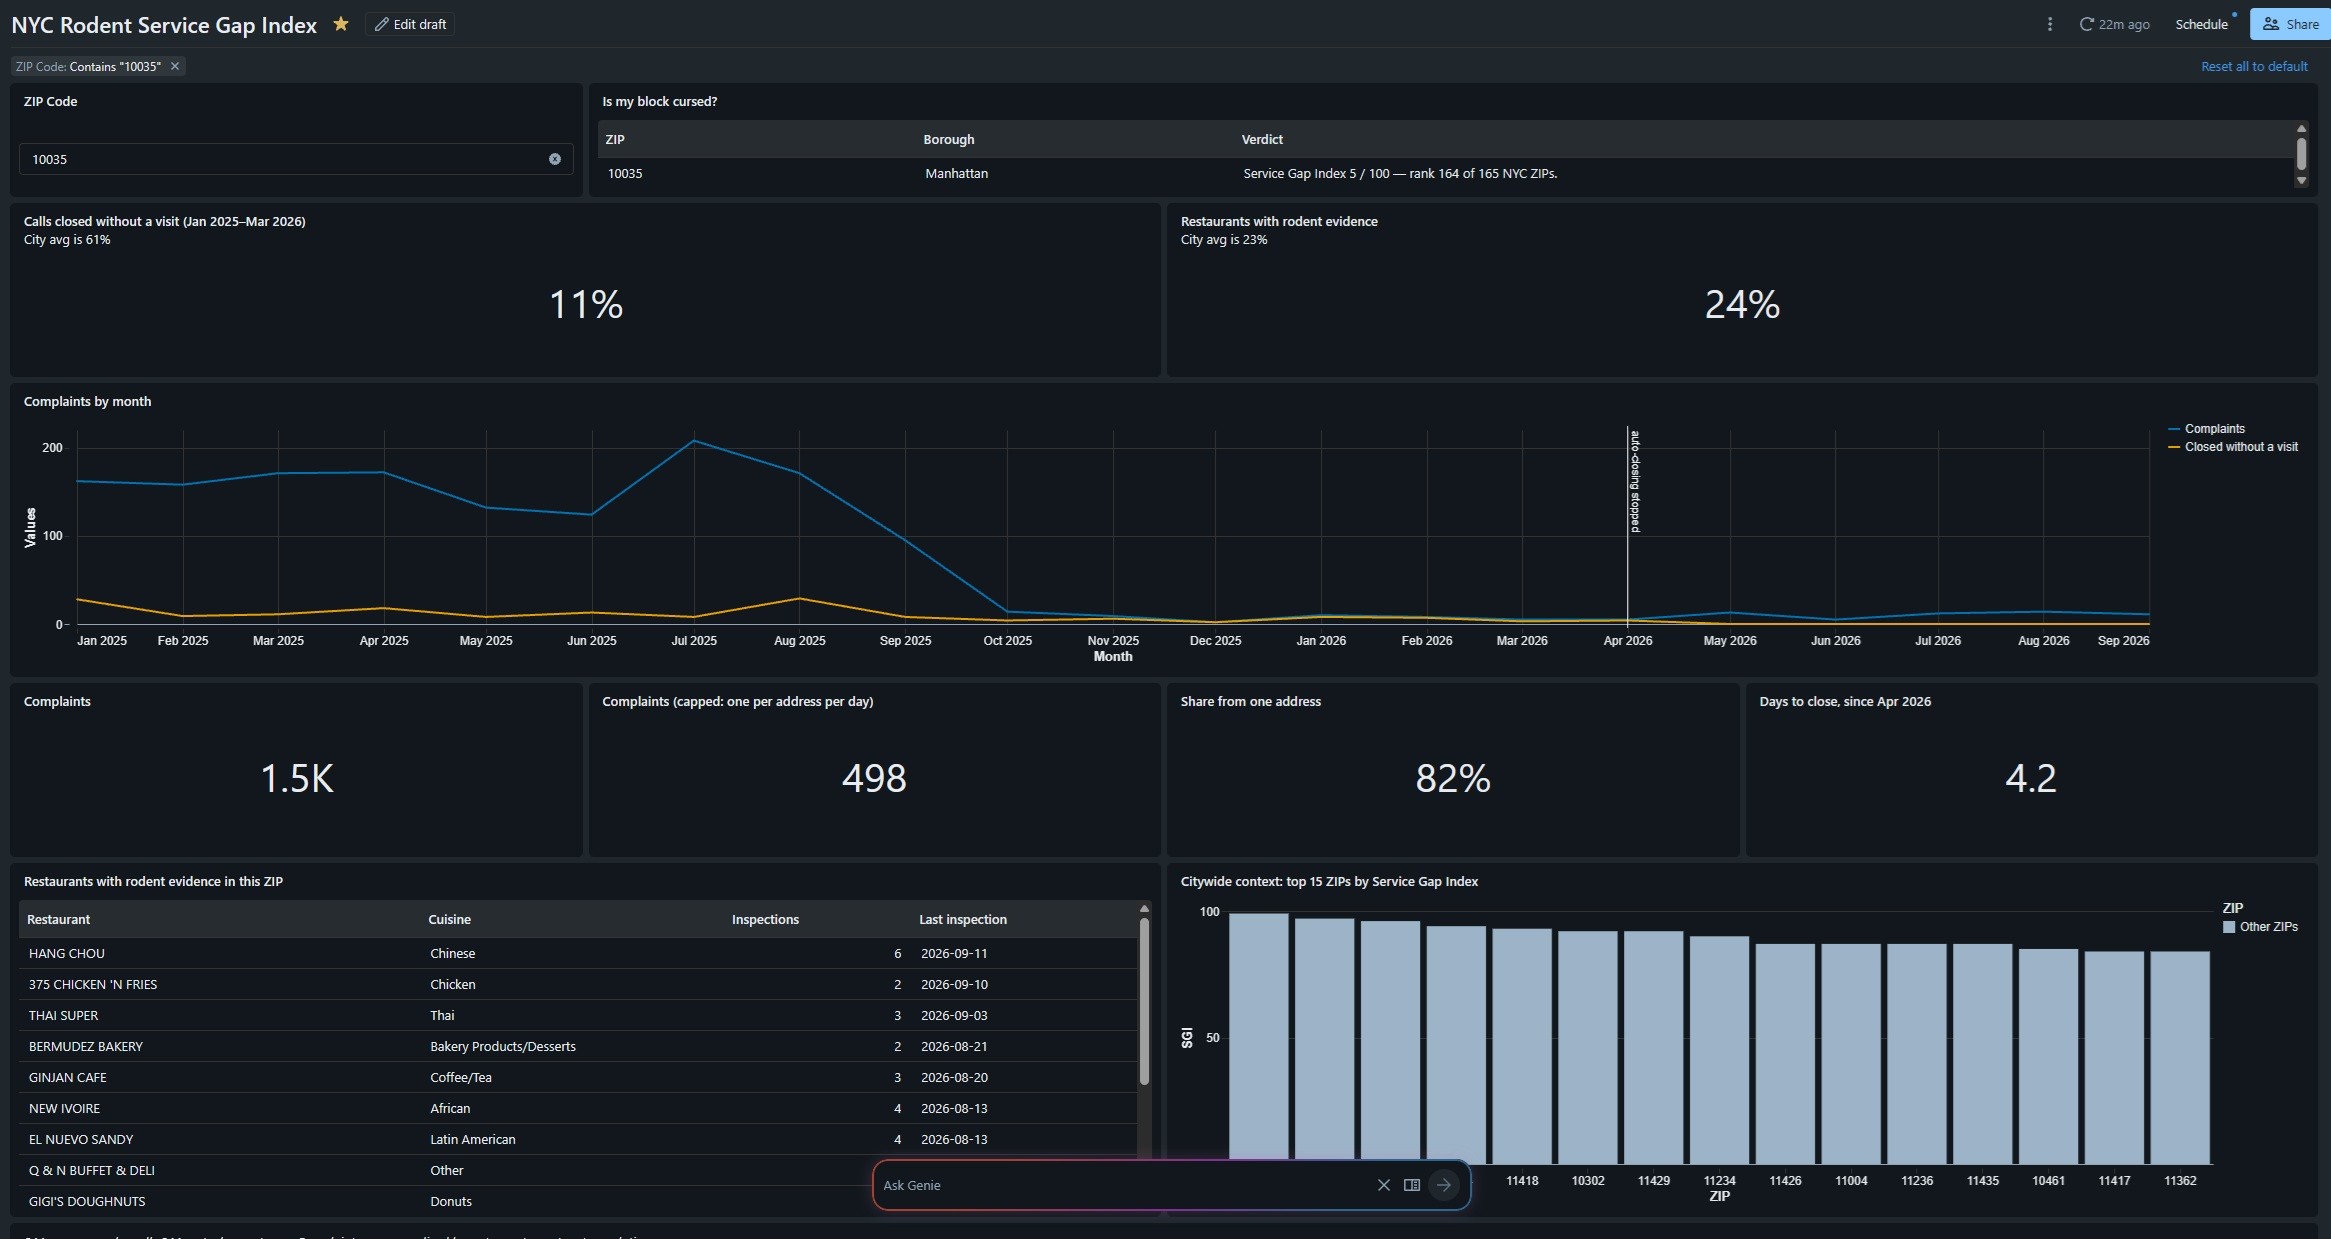
10035, East Harlem
Inspiration
The brief asked one question, and it was not "where are the rats?" It was: when a New Yorker calls for help, does the city show up?
We decided early not to build a rat map. 311 data records who picked up the phone, not where rodents live. People call more when they trust government, when they speak English, when they have lived somewhere long enough to know 311 exists. Shade a map by complaints and you have measured civic trust, mislabeled it, and sent help to the neighborhoods that were already getting it.
What it does
The Service Gap Index scores every New York City ZIP code from 0 to 100 on how well it is served, not on how many rats it has. It is built on Databricks from 50,953 rodent complaints to 311 and 156,300 restaurant violation records covering 25,772 restaurants, January 2025 to September 2026.
It asks two questions of each ZIP code. Both are shares, never raw counts.
- Of the calls made here, what share did the city close without going?
- Are people here calling at all, compared with what health inspectors find? Inspectors visit restaurants whether or not anyone complains, so they are our independent check.
Each ZIP code gets its place in line on both questions, and the index is the average of the two.
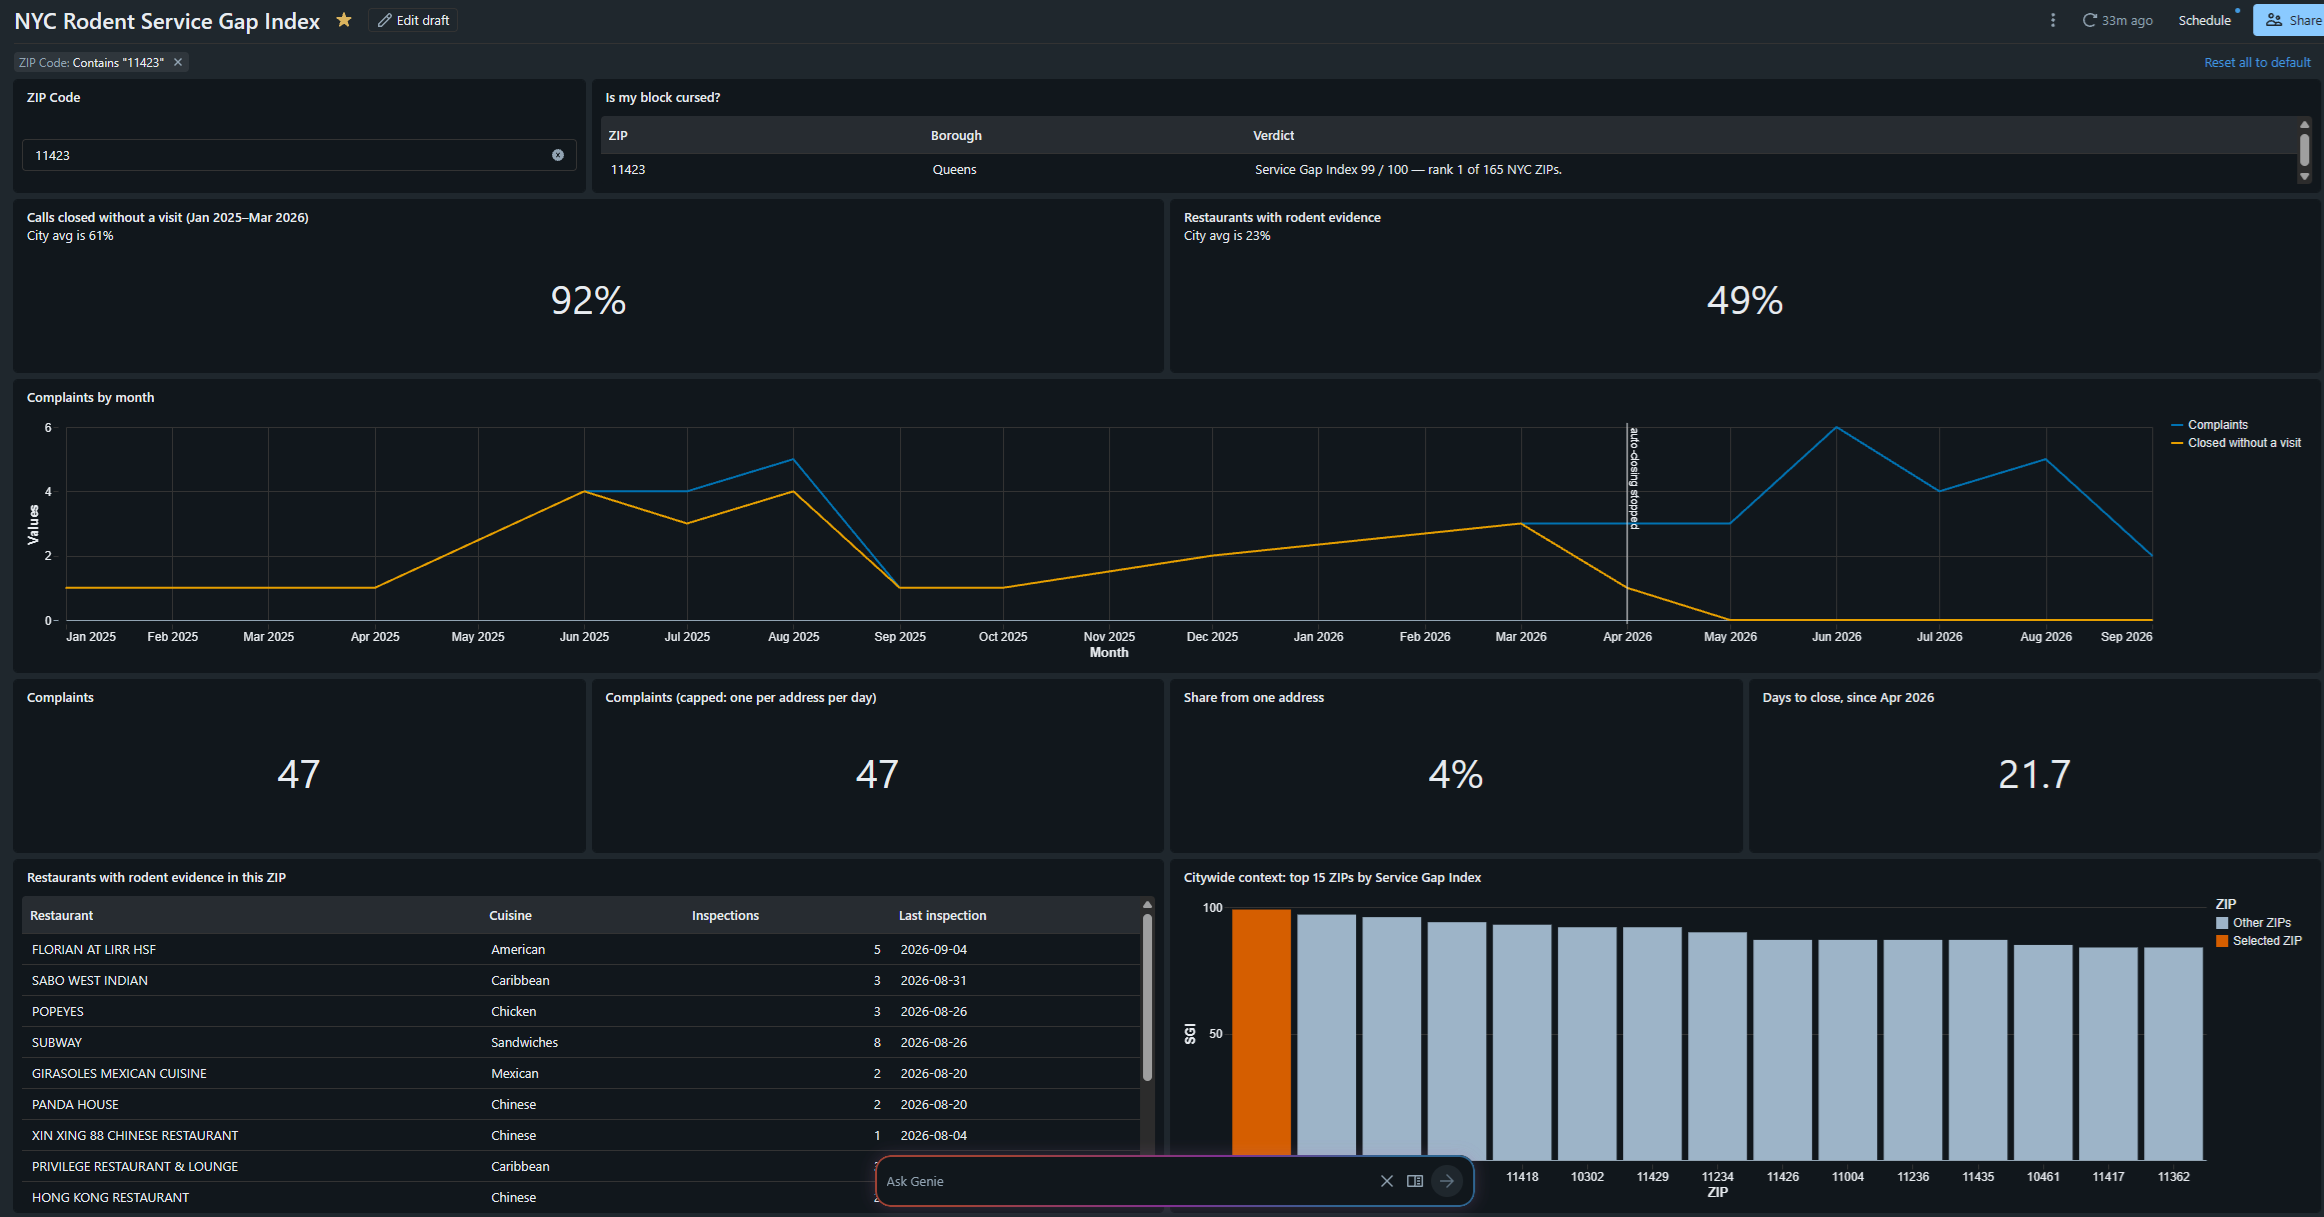
- A dashboard where anyone types a ZIP code and gets one of three true answers: a score and a rank out of 165, "Not enough data to rank" (56 ZIP codes, including JFK airport), or "Not an NYC ZIP code."
- A Genie space that answers questions in plain English, built only on the cleaned tables. Every table and every column in the project, 115 columns in all, carries a written description, because Genie reads them.
What we learned
The obvious analysis is backwards. We started by timing how long a complaint takes to close. The most common answer was zero seconds. 22,546 complaints, 44% of the file, were closed in the same second they were filed: about six in ten, every month, until it stopped on April 20, 2026. A closing-time chart makes 2025 look excellent and 2026 look like a collapse. The truth is the opposite. 2025 is when most callers were never visited. Fast did not mean good. Fast meant nobody came.
It was not even. Before April 2026 the city closed 47% of Manhattan's calls without a visit, but 74% of Queens' and 77% of Staten Island's. Nine of our twelve worst-scoring ZIP codes are in Queens. And it is not just history: of the calls made May to July 2026, 2% were still open in Manhattan in mid-September, against 14% in Queens and 25% in Staten Island.
One building can drown out a neighborhood. By raw count, East Harlem (10035) is the worst ZIP code in the city. One apartment building filed 1,227 of its 1,501 complaints. Counting each address once per day moves it from 1st to 23rd.
One row is not one restaurant. The inspection file has 158,083 rows and 26,114 restaurants. Count rows and every number that follows is wrong.
Complaints do not tell you where rodents are. How often a ZIP code calls and how often inspectors find rats or mice there barely agree (correlation 0.21).
The lesson under all of them: ask what a column means, not just what it contains. The closing date was filled in, well formed, and wrong about the one thing everyone would use it for.
What our data doesn't do
- It doesn't count people. We had no population data, so complaint rates are per restaurant, not per resident. A quiet residential ZIP code can look louder than it is.
- It doesn't prove anyone came. A ticket closed in zero seconds proves nobody went. A ticket closed after three days does not prove somebody did. Our "closed without a visit" share is a floor.
- It doesn't tell you where the rats are. A low score means the city answered the calls it got. It does not mean fewer rats. Harlem scores low, and inspectors still find rodents in about a quarter of East Harlem's restaurants.
- It doesn't turn small numbers into big ones. Our top-ranked ZIP code, Hollis (11423), rests on 22 of 24 calls. The borough pattern, built on thousands of calls, is firmer than any single rank. 56 ZIP codes have too little data, and we give them no score at all.
- It doesn't explain why. We can see that tickets were closed the second they were opened. We cannot see inside the agency to say who decided that, or why it stopped.
Conclusion
"If I worked for the city, I would go back to the 22,546 rodent complaints that were closed the same second they were filed, starting in Queens and Staten Island, because our data shows three out of four calls there were closed without a visit, and those are the same neighborhoods still waiting longest for help today."
Built With
- databricks


Log in or sign up for Devpost to join the conversation.