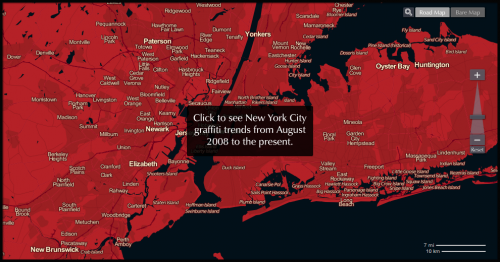
This application helps users explore graffiti trends in New York City. It animates the growth of graffiti incidents over time on custom maps of New York City.
The application is primarily focused on visualizing graffiti data. We employ traditional charts that simultaneously animate with the geographic animation.
We were very concerned with performance. One major problem involves working with very large amounts of data. To keep the application lean, we first compress the raw data in Binary. However, displaying large amounts of data on the map becomes the next problem. For each zoom level on the map, we calculate a level of detail for the data. We are able to remain faithful to the data visualization; at the same time, we are not overloading the user's browser with too display objects.


Log in or sign up for Devpost to join the conversation.