-
Front page
-
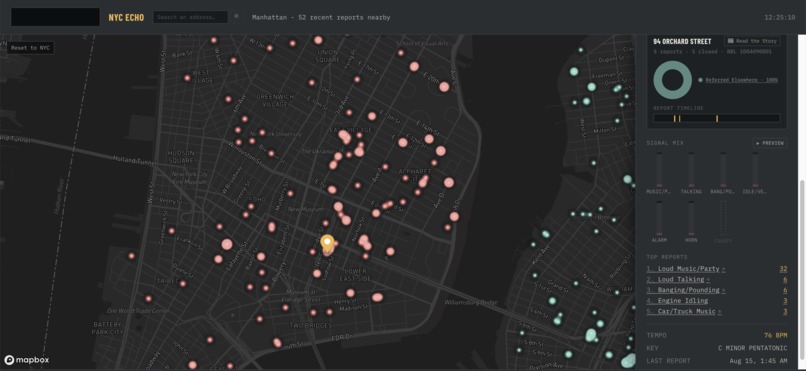
Signal Mix & Top Reports
-
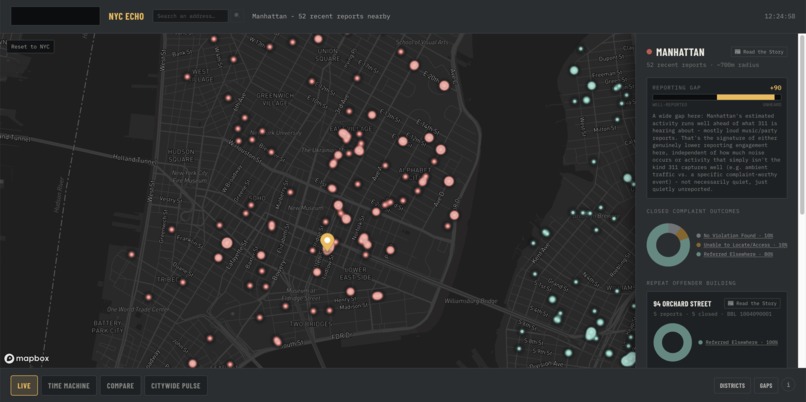
Manhattan channel strip
-
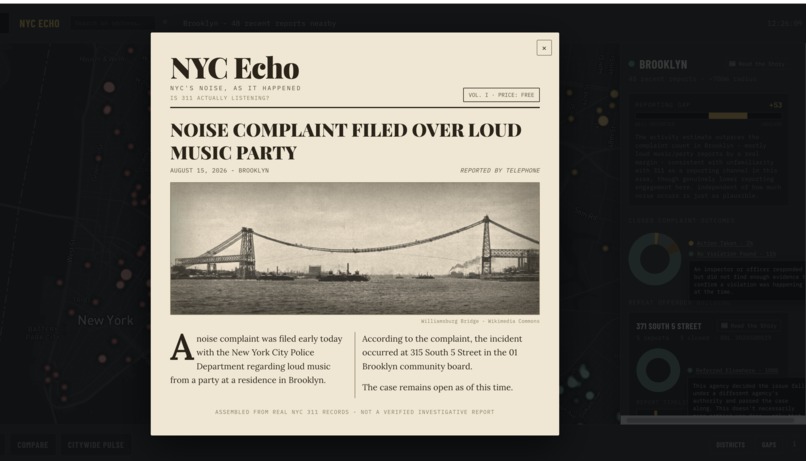
Generating report from a complaint
-
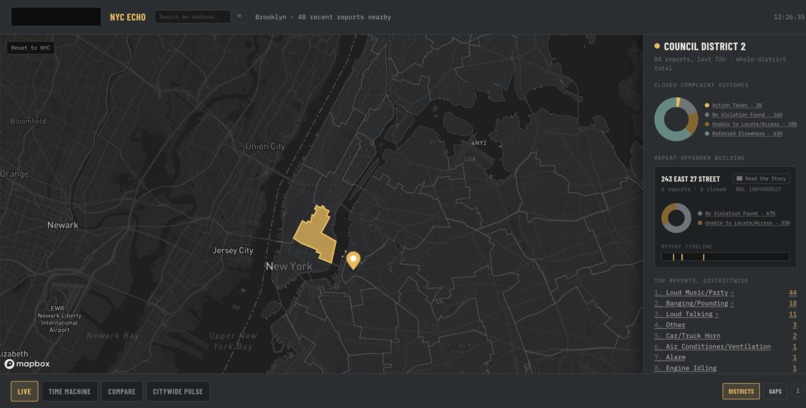
District view
-
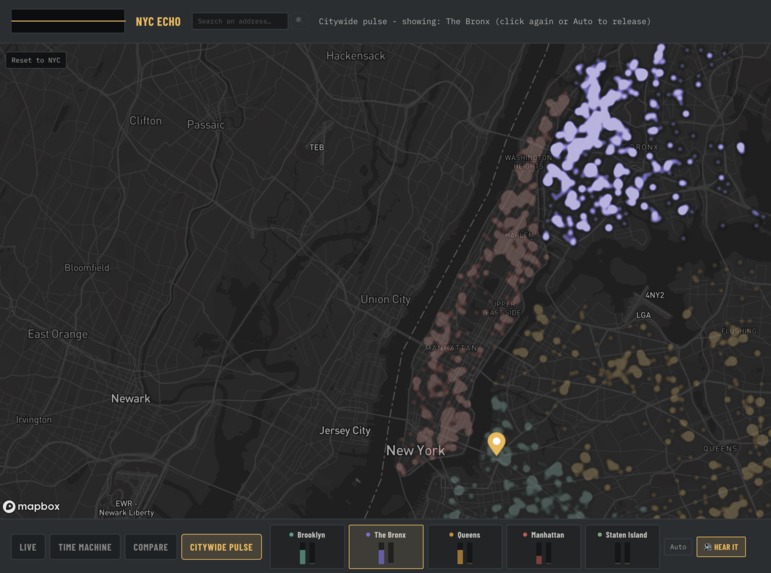
Citywide Pulse
-
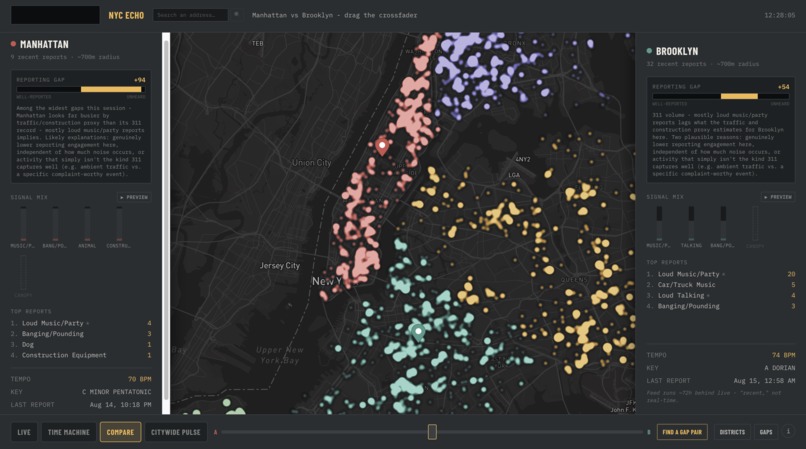
Compare mode
-
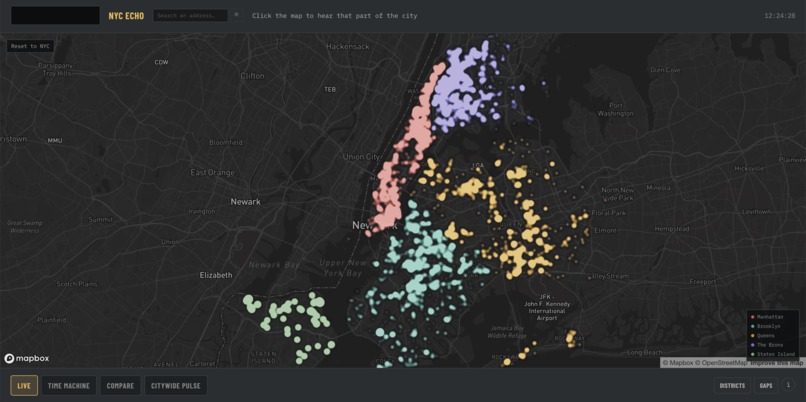
Heatmap of Noise complaints across NYC
Inspiration
NYC's 311 system logs roughly 22 million service requests. Almost every civic-data project built on top of it stops at the same question: where are complaints happening. I wanted to ask the one nobody answers, when a complaint gets closed, did anything actually happen? "Closed" and "resolved" are not the same word, and the city's own data proves it if you look at the right field.
What it does
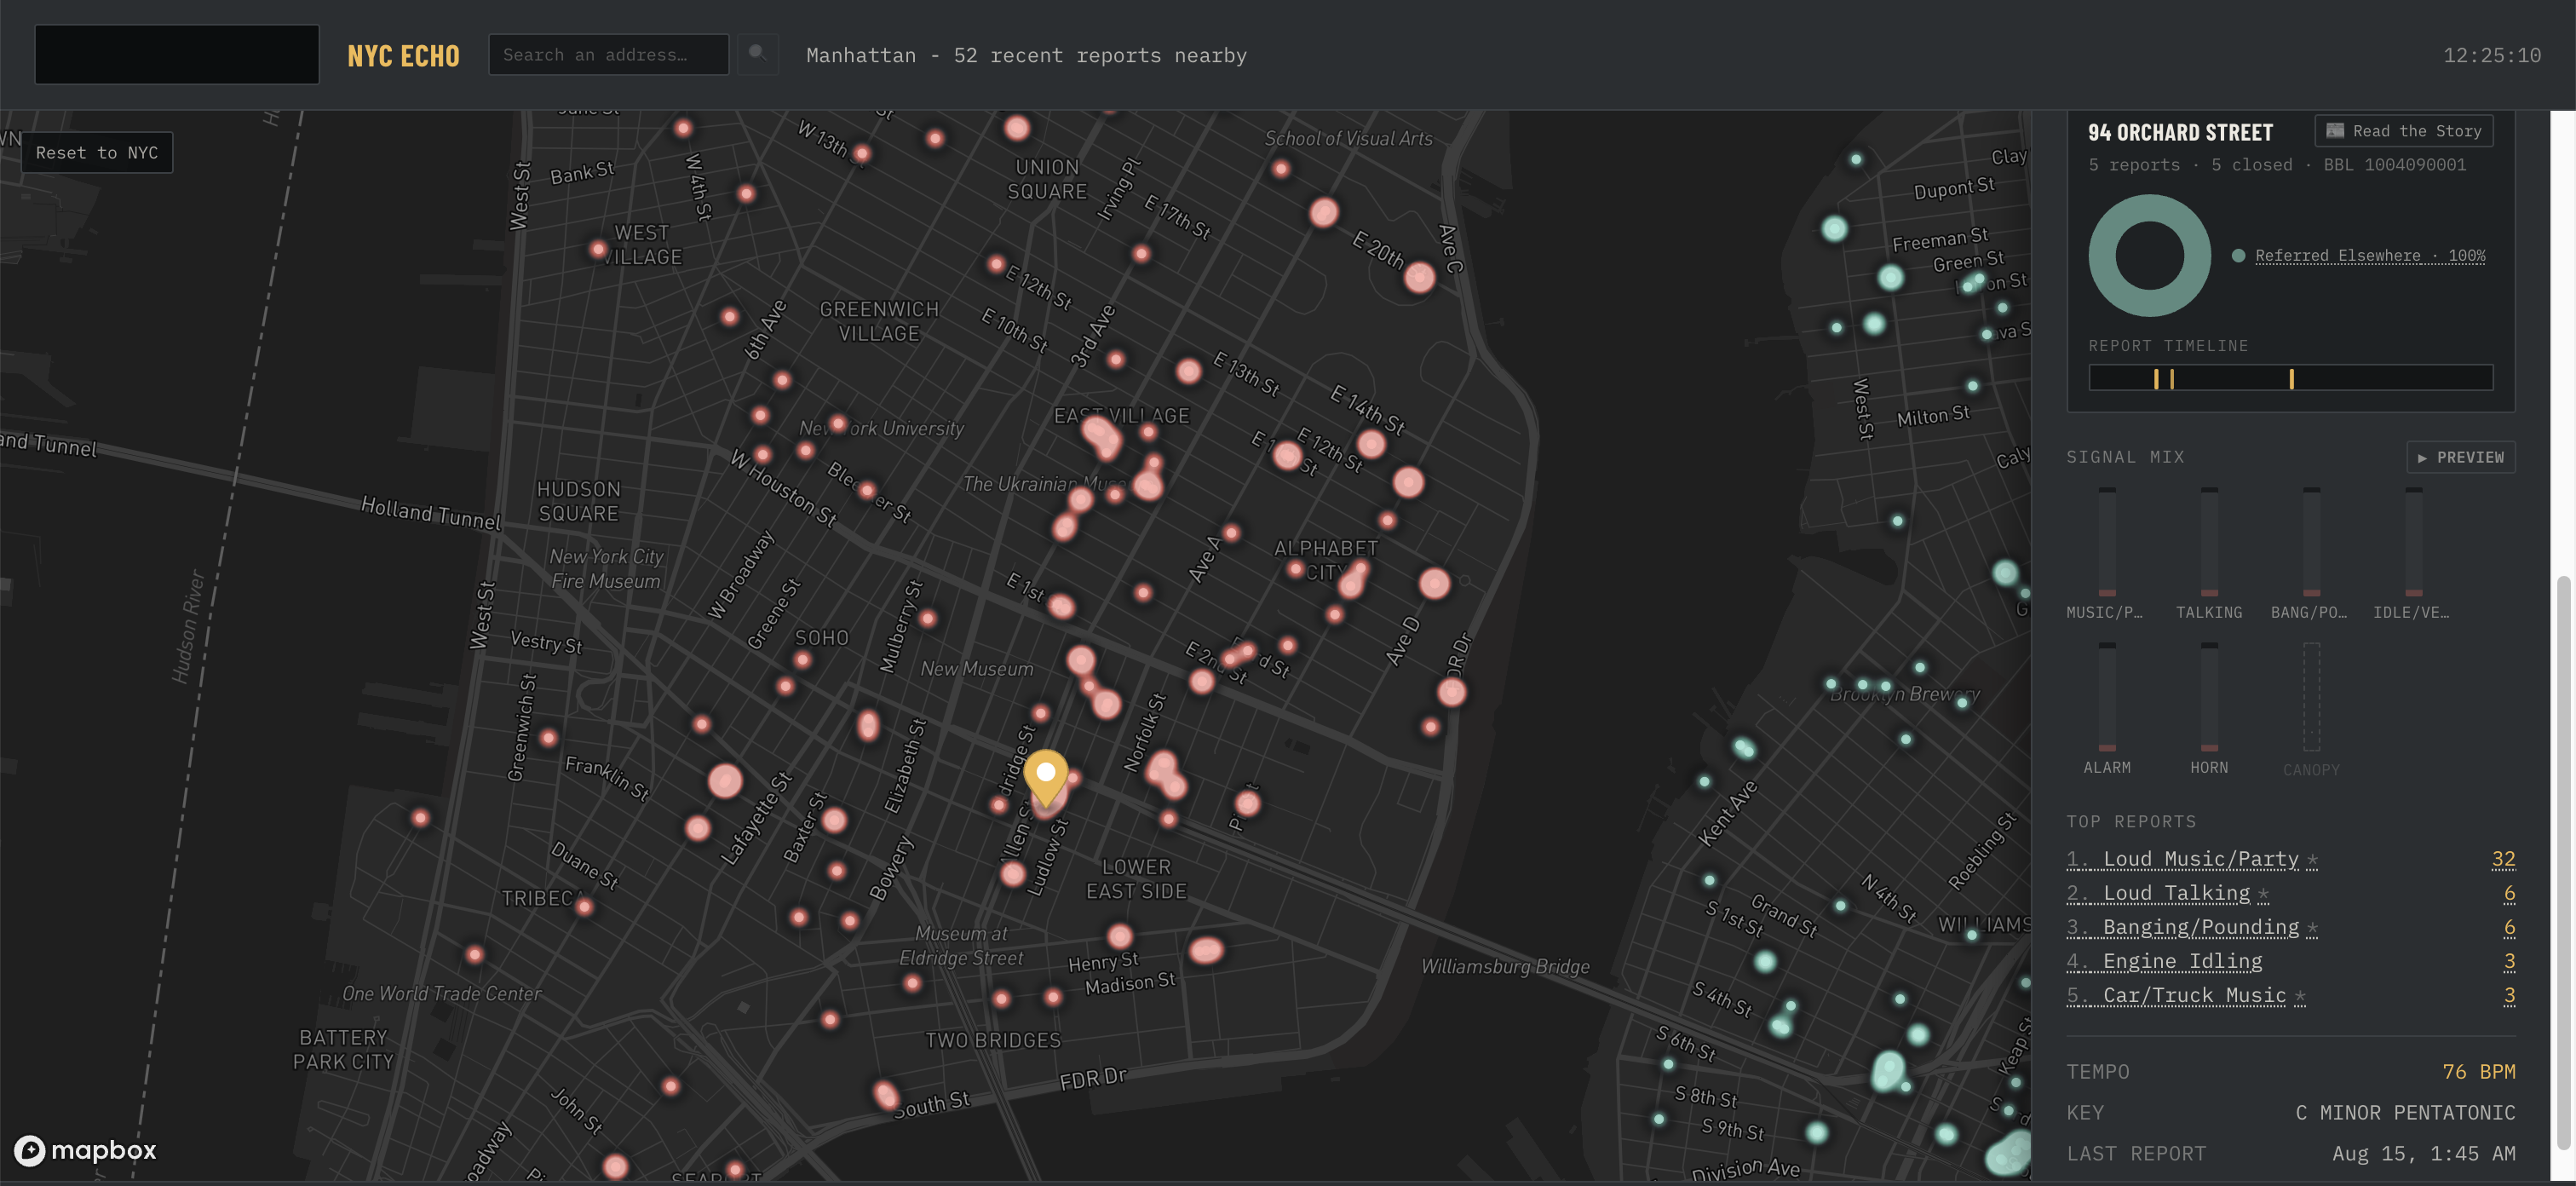
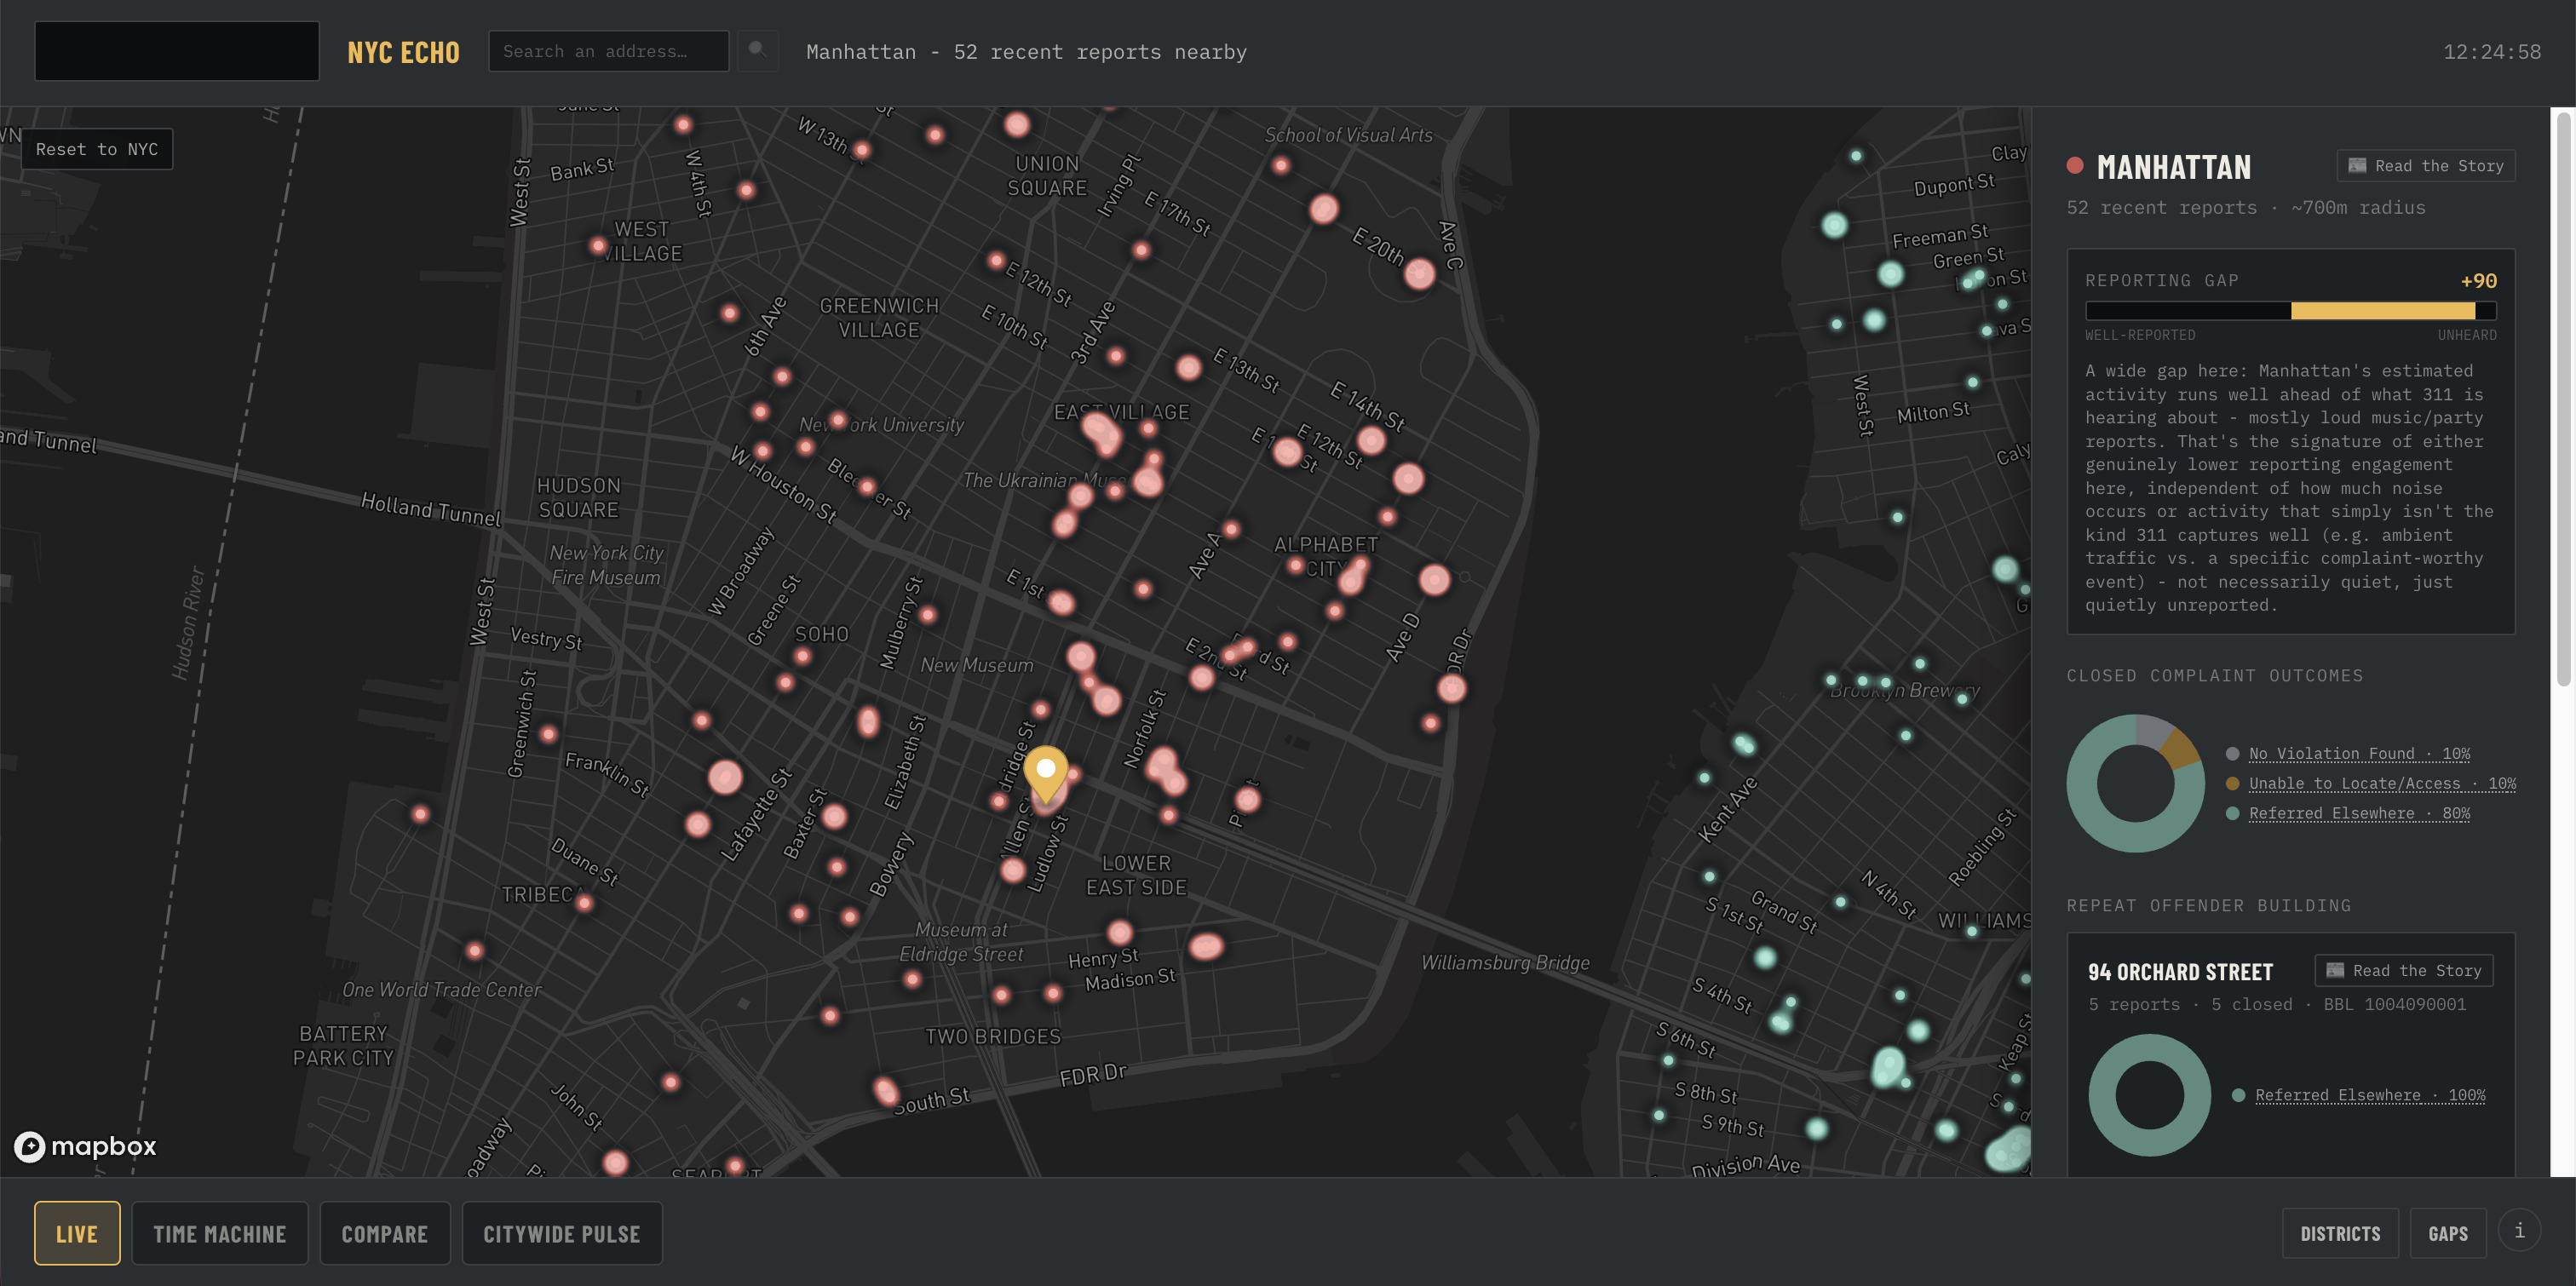
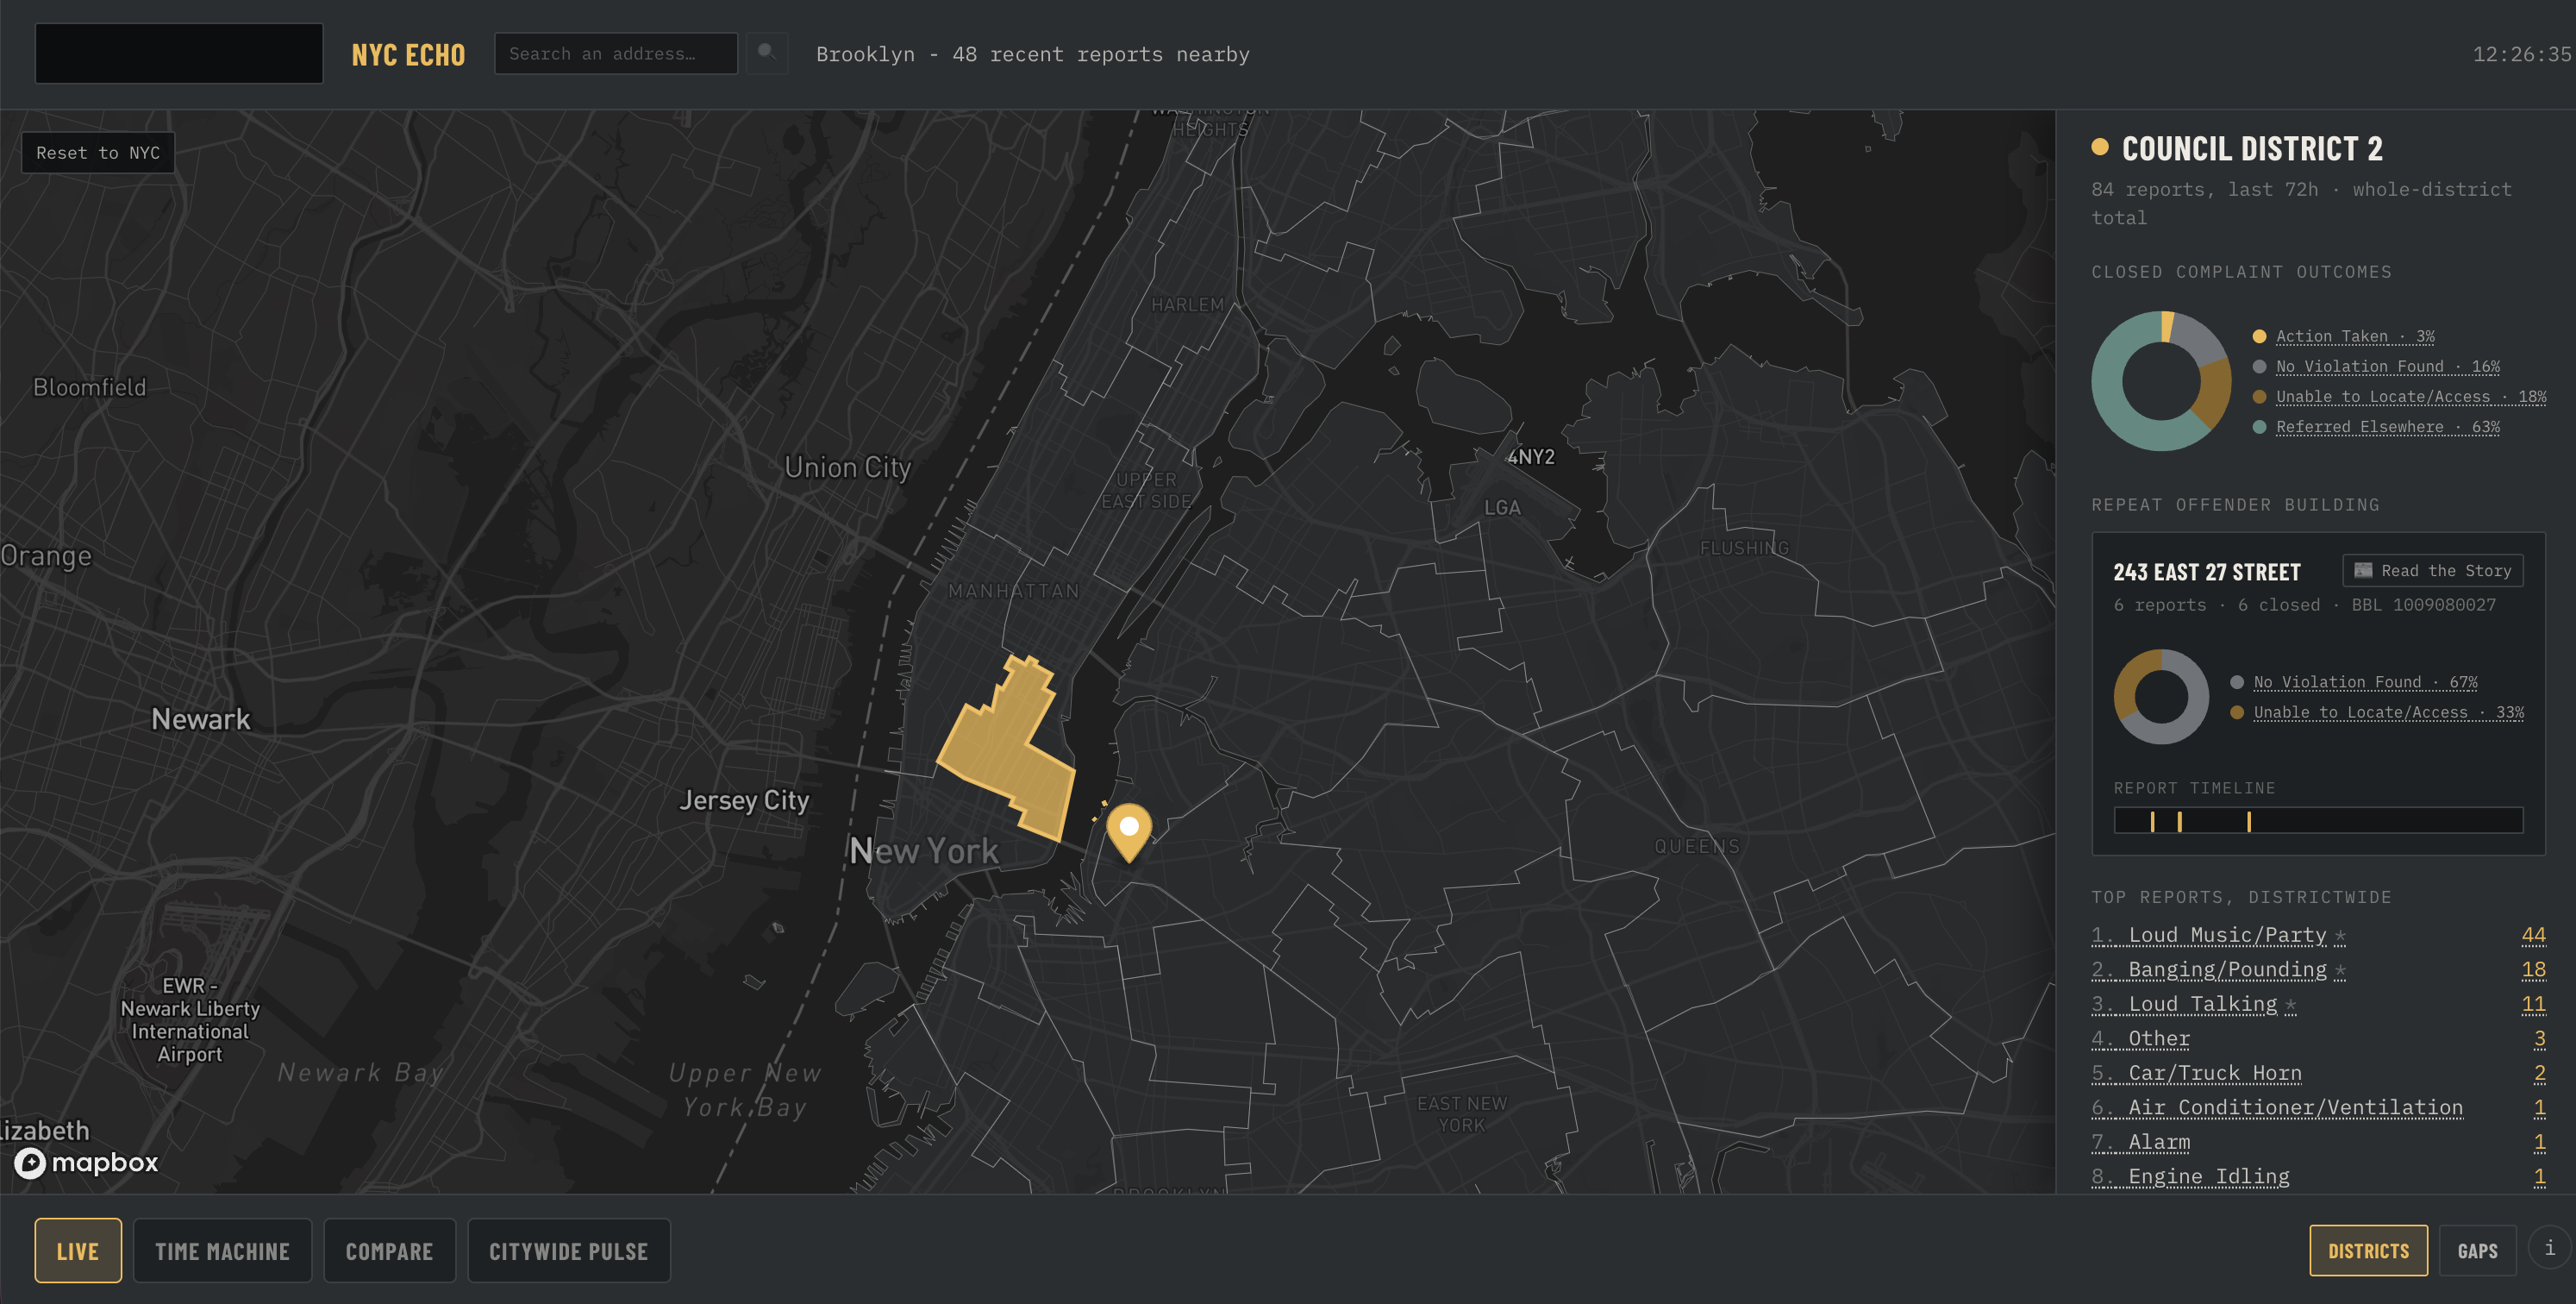
You click anywhere on the map, or search an address, and it pulls real 311 noise complaints for that spot straight from the city's own API. The interesting part isn't the count, it's what happened after. A lot of complaints close out without anyone doing anything, so I classify each one based on the agency's own resolution notes: action taken, no violation found, referred elsewhere, or unclassified when the text just doesn't say clearly.
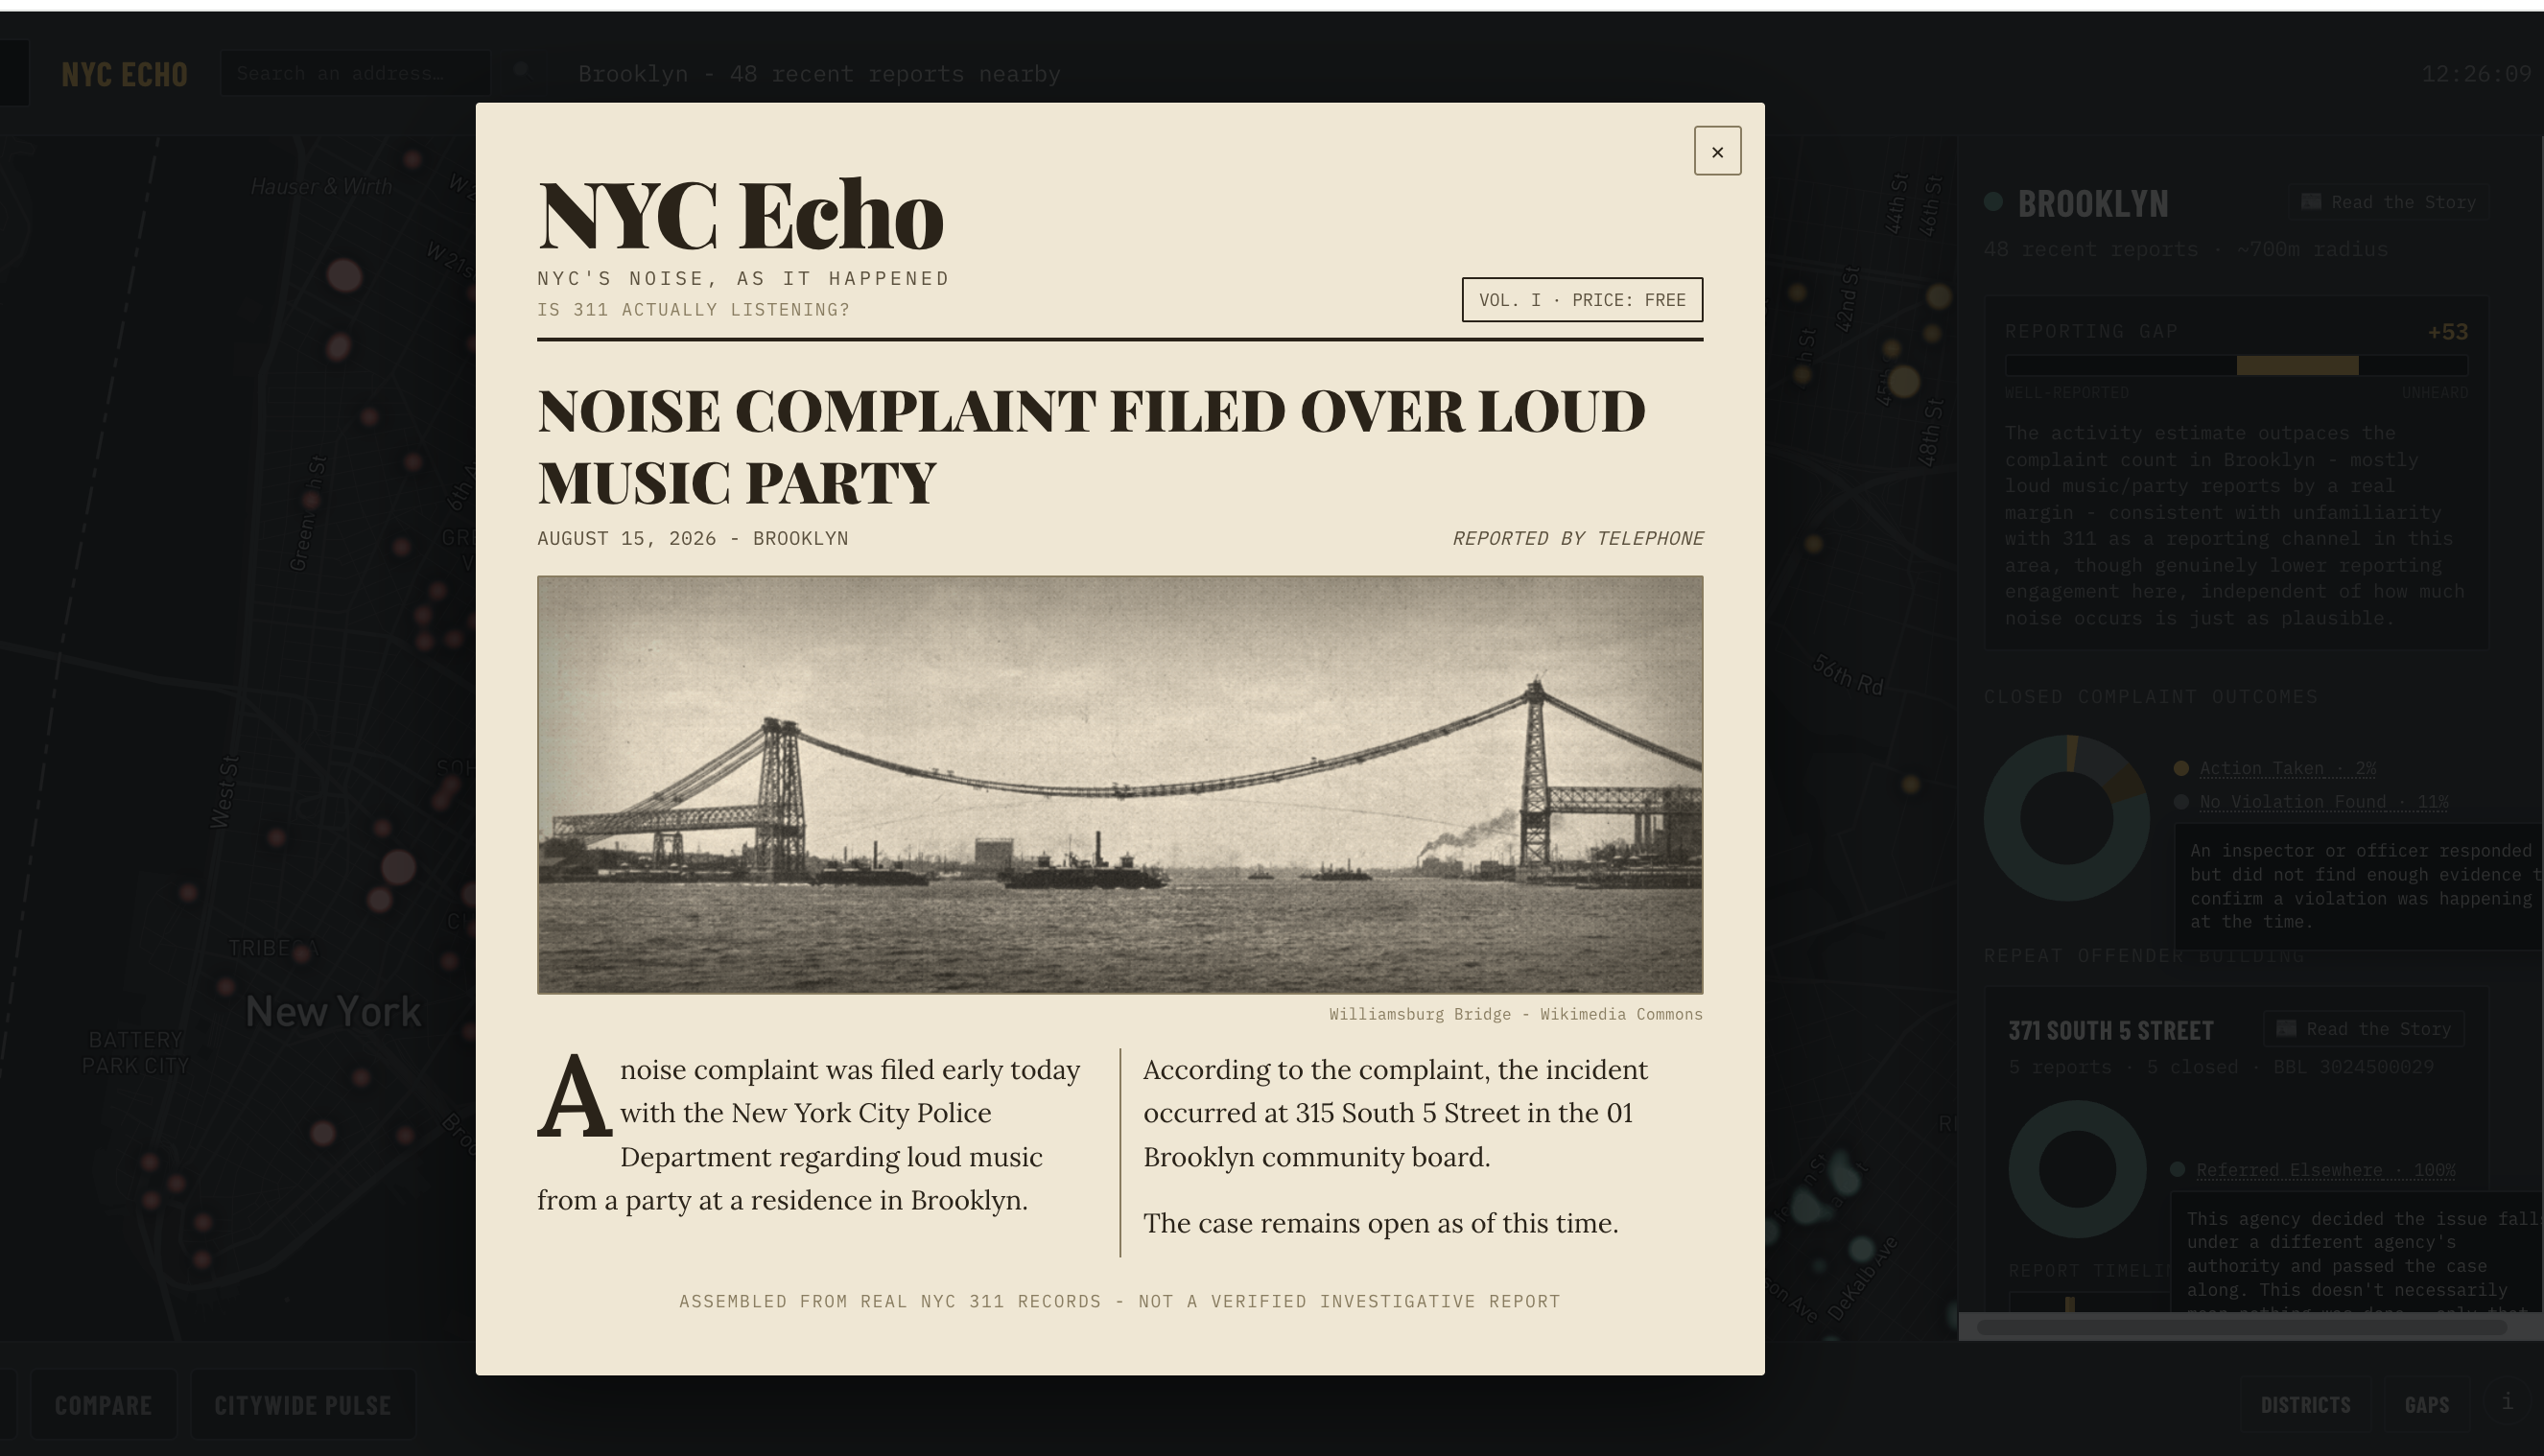
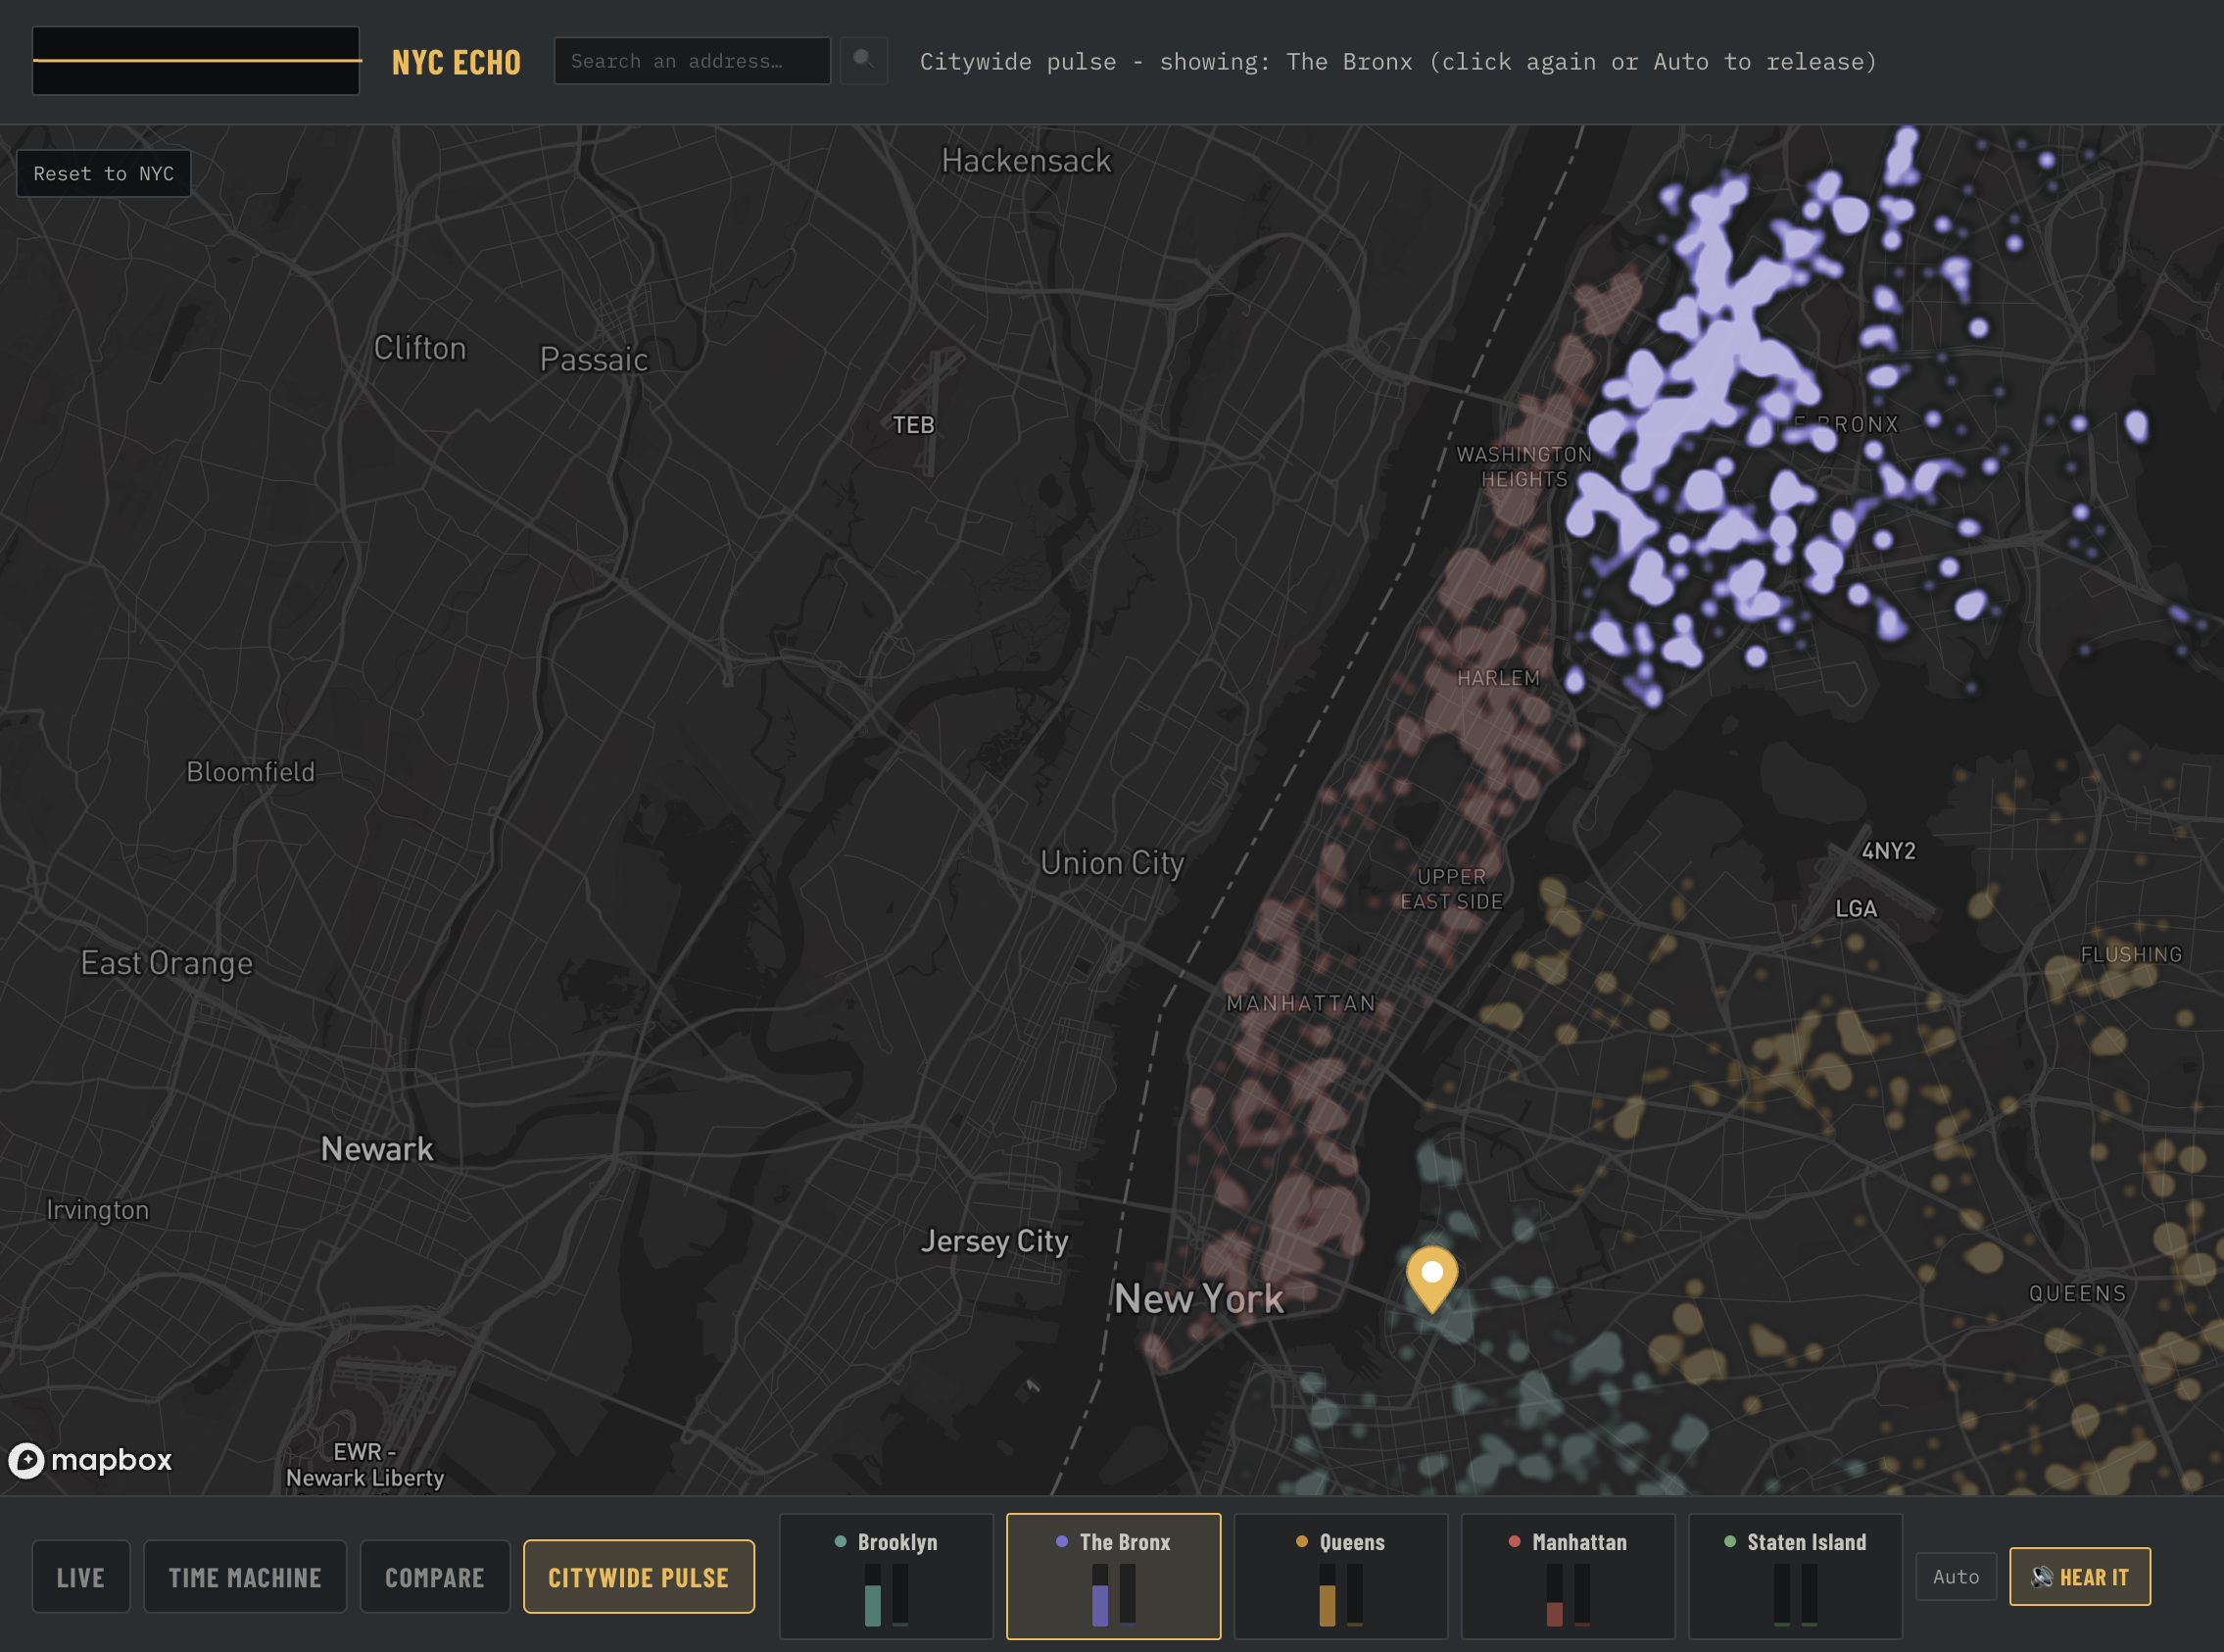
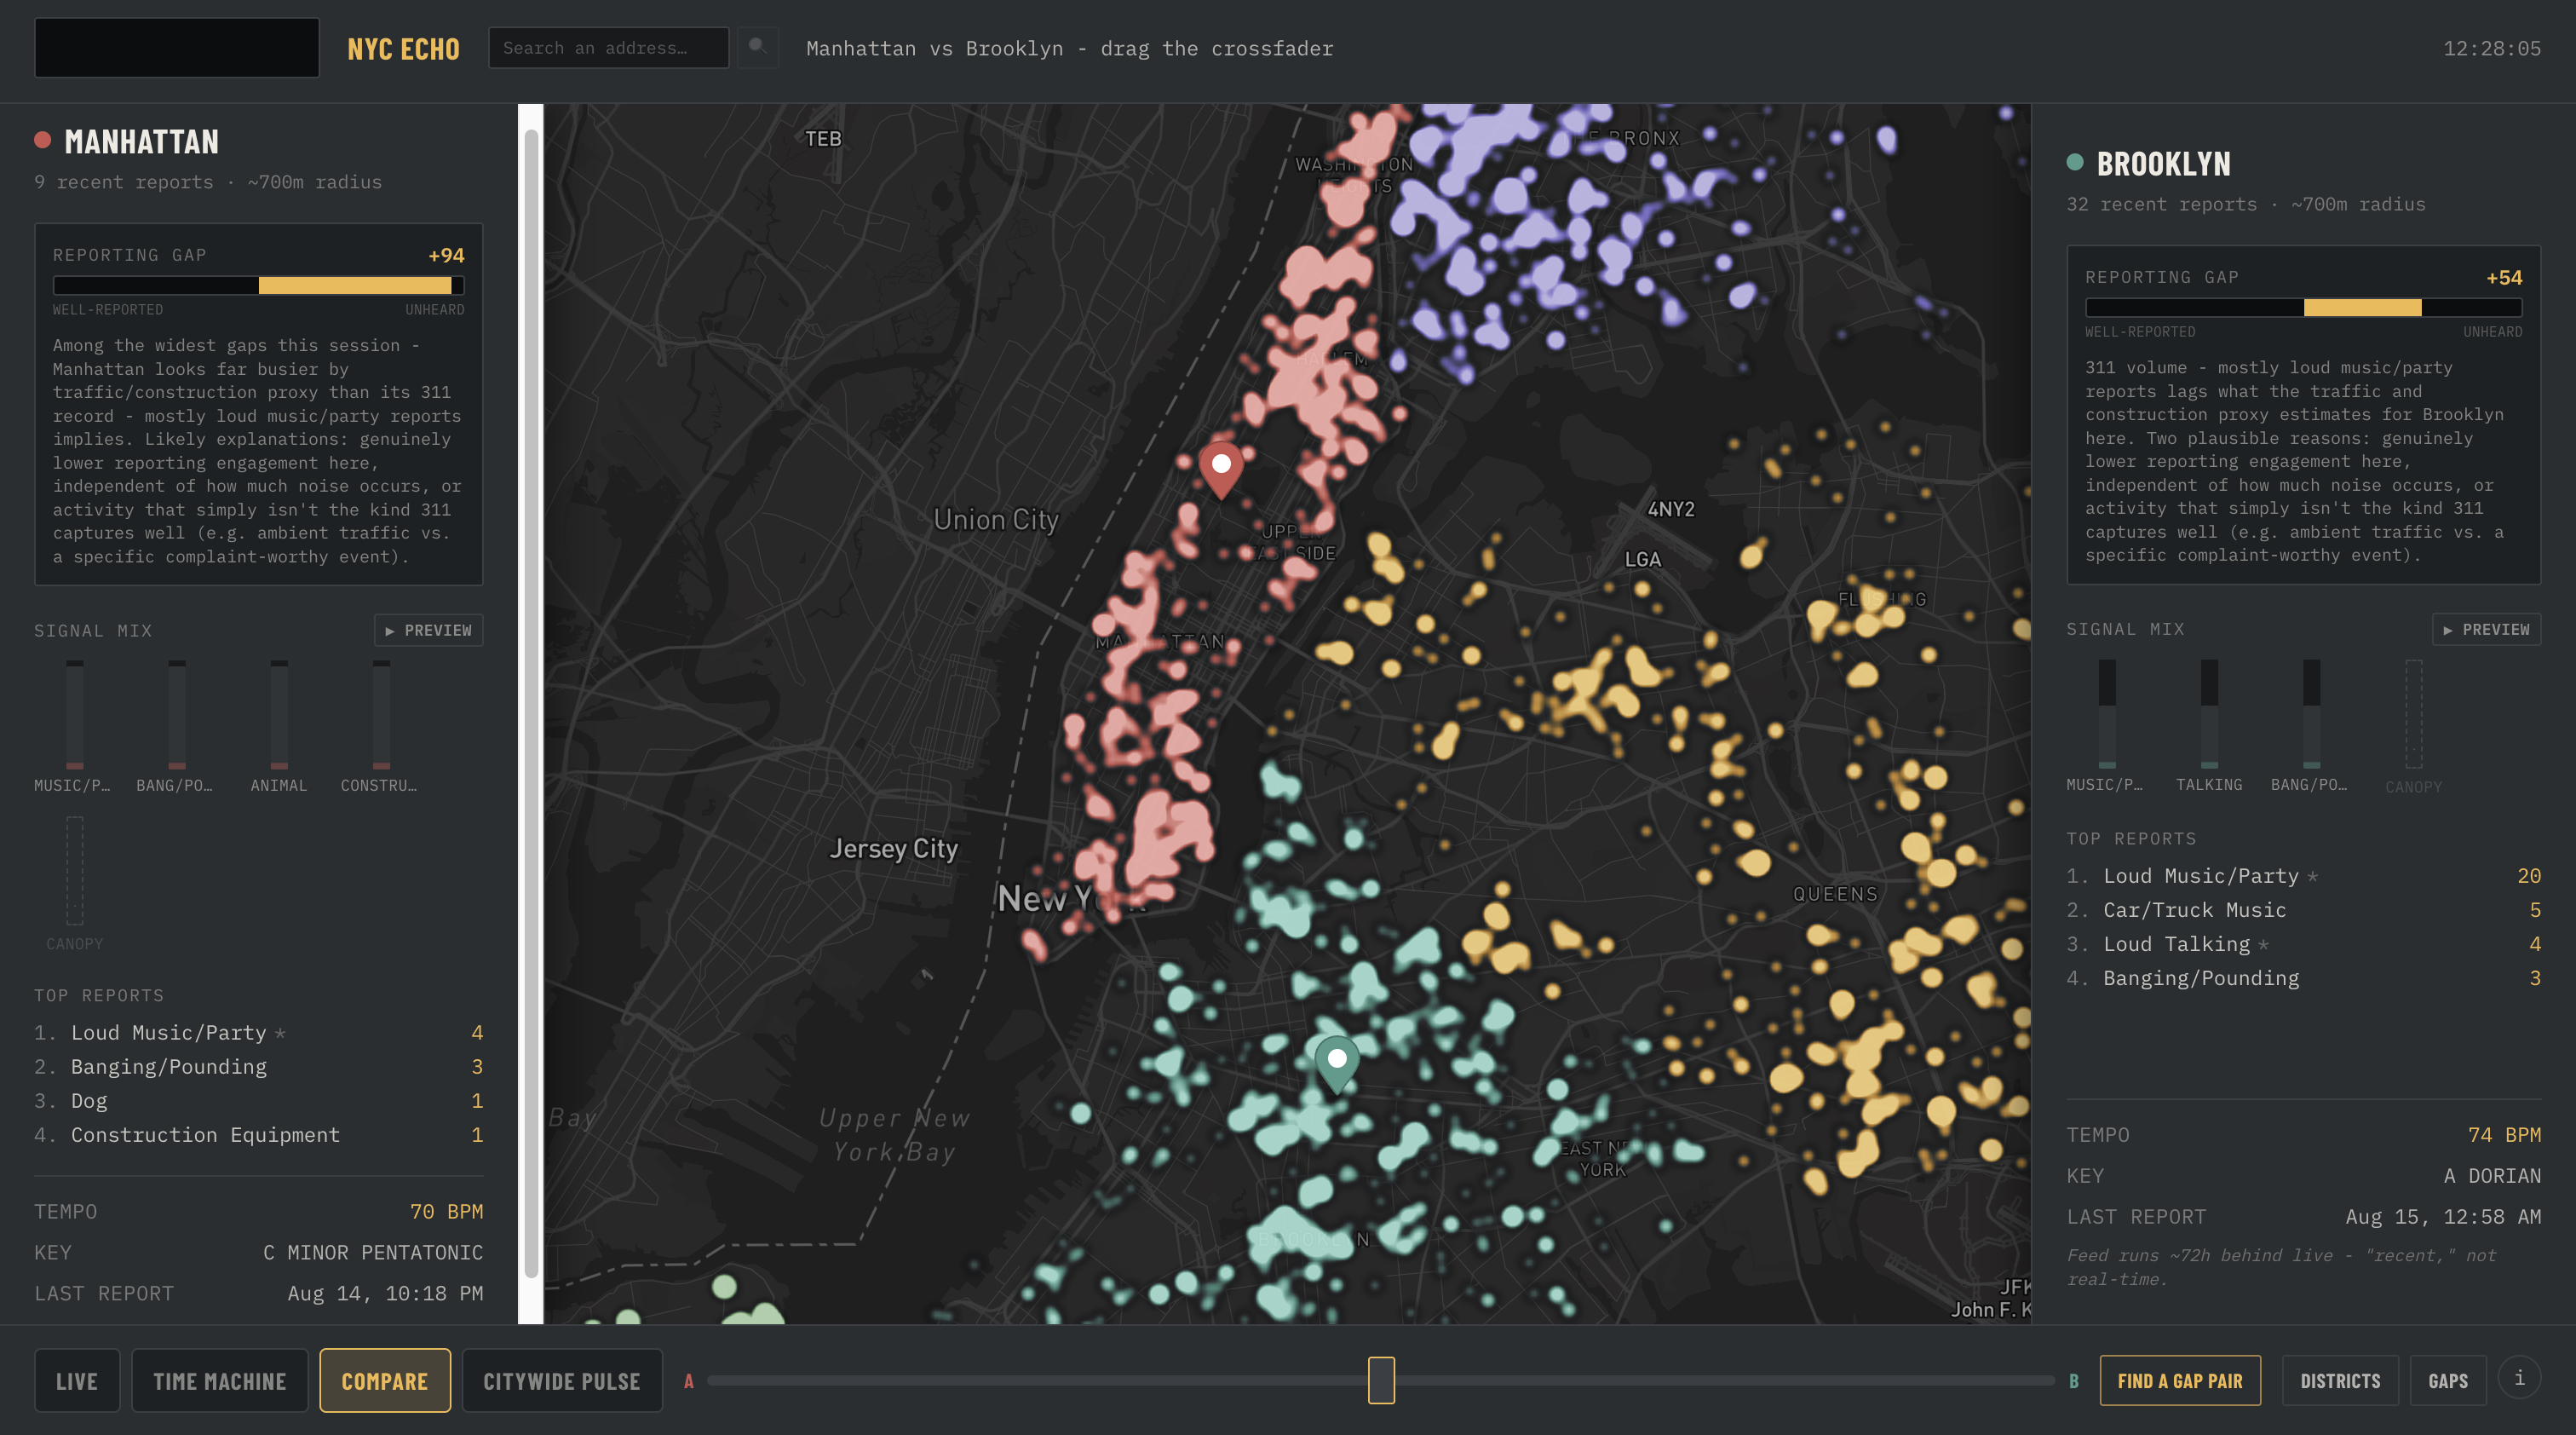
It also finds the single worst repeat offender building near wherever you're looking (matched by BBL, the city's own building ID), and you can turn any one complaint into a little vintage newspaper article about it, real address, real photo, real outcome. There's a Time Machine that replays a week of complaints as a growing heatmap, a Compare mode with a crossfader between two spots, and a Districts view built off the real NYC Council District shapes rather than an arbitrary circle around a click. There's also a Reporting Gap thing that uses traffic and construction data to flag areas where a lot seems to be going on but almost nobody's calling 311 about it, a different and honestly sadder question than the resolution one.
Two of the modes let you hear the data as generated sound if you want. I kept that separate on purpose so it doesn't distract from the actual point.
How we built it
Next.js, TypeScript, Tailwind, Mapbox for the map, Tone.js for the sound layer. Everything runs live against NYC Open Data's Socrata API. The backbone is 311 Service Requests (dataset erm2-nwe9), and I layered in DOT traffic speed data, construction permits, and tree canopy counts for the Reporting Gap piece. For Districts I pulled the actual city council district polygons and matched them straight to 311's own council_district field, which saved me a whole separate geocoding step. The newspaper feature is a template engine first, real fields filled into real sentences, and then upgraded by Llama 3.1 8b through Groq's free API.
Challenges we ran into
311's feed says "recent" but it actually runs about three days behind live. My "last 24 hours" filter came back completely empty the first time I tested it, and it took a minute to realize that was the data, not a bug.
I almost added NYC's Traffic Volume Counts dataset as a fourth input to the activity estimate, but its coordinates are stored in some projected format instead of plain lat and long. Wasn't worth the risk of getting that wrong this weekend, so I used traffic speed instead and left it out.
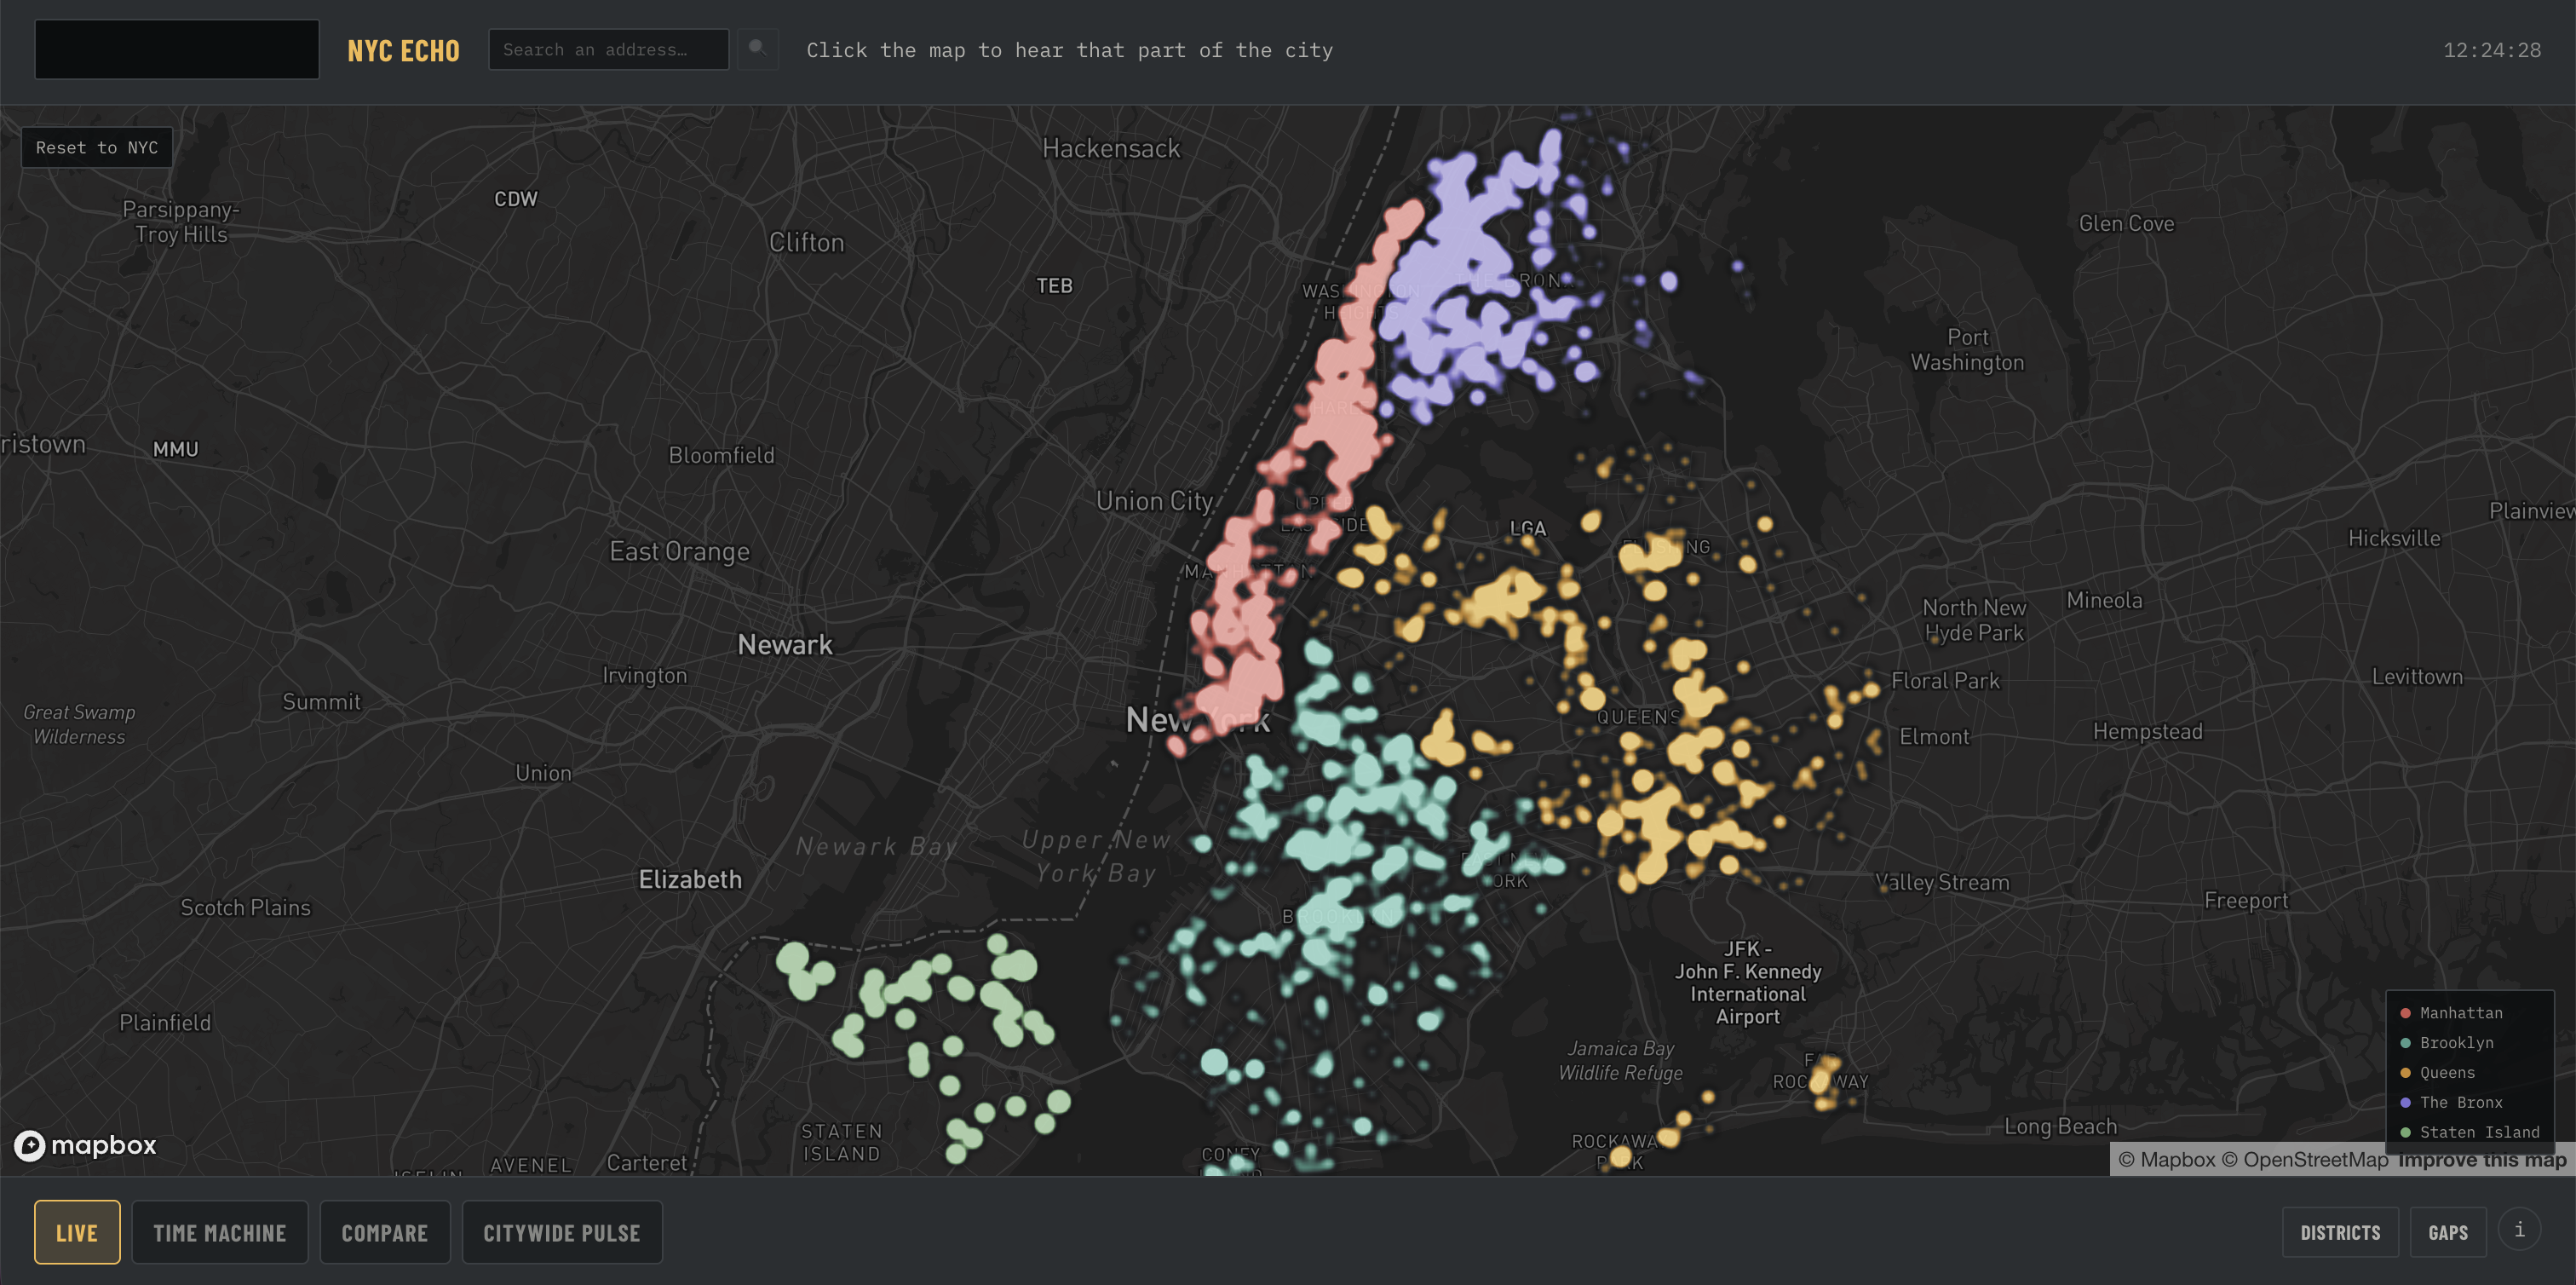
Keeping five boroughs visually balanced on one map took more work than I expected. Manhattan and Brooklyn have so much more raw volume that Staten Island basically disappears if you don't correct for it.
Figuring out what "closed" actually means in this data took a while. It doesn't mean fixed. Sometimes it just means the agency looked, found nothing, and moved on.
Accomplishments that we're proud of
Every number in this app traces back to a real field in a real dataset, nothing invented to look more dramatic. The methodology panel says plainly what the Reporting Gap Index is and isn't, a heuristic, not a validated study. And the AI part is built so it literally cannot break the demo.
What we learned
The most interesting fields in a big dataset are usually the ones nobody looks at first. resolution_description and bbl don't show up in any default 311 dashboard, but that's where the actual story was.
What's next for NYC Echo: Is 311 listening?
Cross referencing the worst buildings against DOB and HPD violation records would round this out a lot. I'd also like to let people save specific addresses and get notified if something changes. And I still want to go back and properly parse that Traffic Volume Counts geometry I skipped this time.
Built With
- groq
- llama
- mapbox-gl
- nextjs
- nyc-open-data
- python
- react
- socrata-api
- tailwindcss
- tonejs
- vercel


Log in or sign up for Devpost to join the conversation.