

Motivation
The NYPD has released a dataset of crimes organized by month, year, crime type, and location. Though this dataset must be scraped manually and isn't very detailed, proper data exploration and re-organizing allow for a pleasing and interesting visualization of all the crimes. Hopefully, such visualizations will promote the need for greater transparency by the NYPD, and will encourage the release of more detailed data, possibly through NYC's Freedom of Information Law requests.
Features
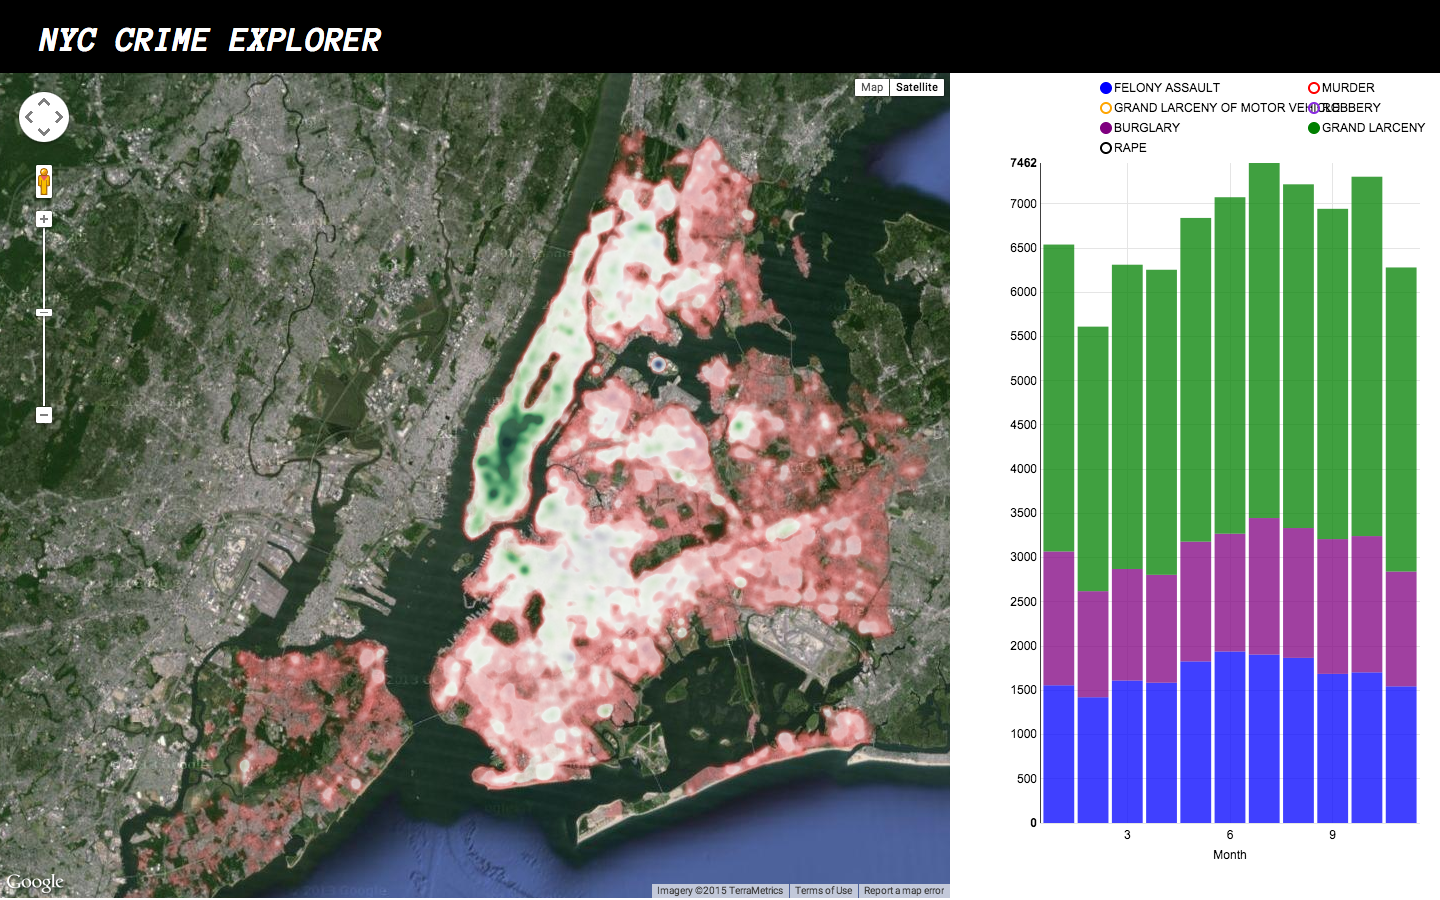
Anyone can browse the datasets by panning around the Google map on the left and toggling different layers of crimes by clicking the circles in the legend on the right. Month-by-month stacked summary statistics of selected crimes update on the bar graphs in real time.
Specs
- Backend built on Flask, using pandas for data analysis.
- Frontend built on AngularJS, using d3.js and nvd3 for plots.
- A Beaker notebook was used to dig through and clean the data and test different data formats before copying helper functions over to Flask for deployment.
Built With
- angular.js
- beaker
- d3.js
- flask
- nvd3
- pandas
- python

Log in or sign up for Devpost to join the conversation.