-
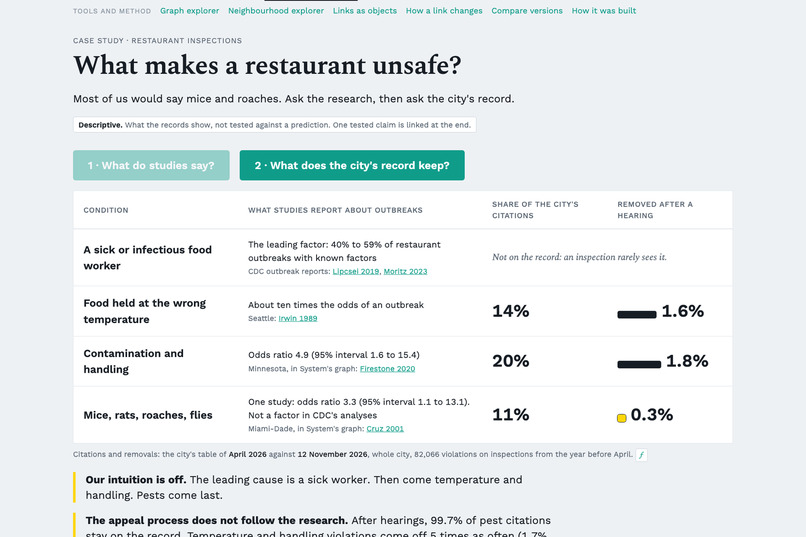
What makes a restaurant unsafe?
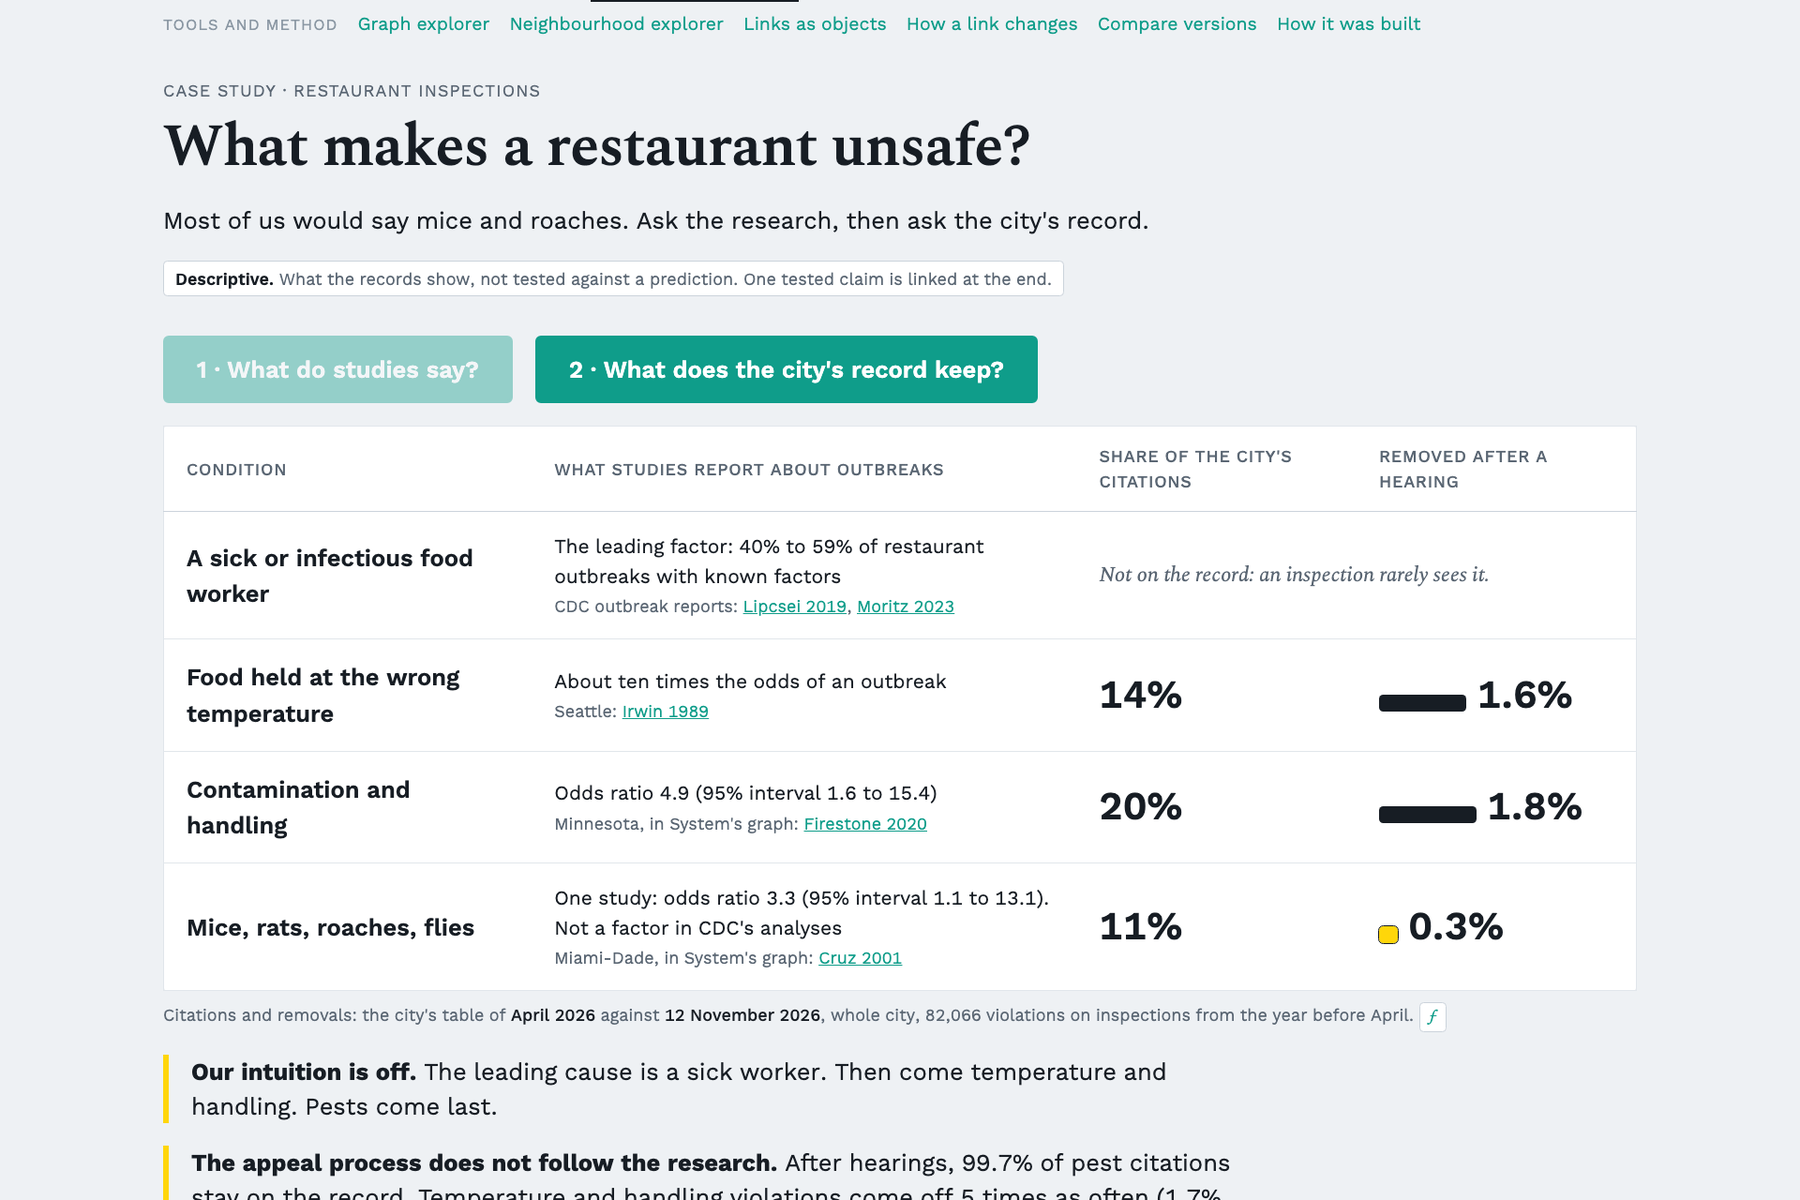
The challenge
Build 4: what published research and New York City's open data confirm, contest and connect.
What inspired us
Past and research on systems of inquiry
What it does
NYC Concordance sets what studies report beside what a city's own records hold, and shows what changed between versions of those records.
The demo asks one question: what makes a restaurant unsafe? Most people would say mice and roaches. Studies say otherwise. The leading factor in restaurant outbreaks is a sick food worker (40% to 59% of outbreaks with known factors in CDC's reports), followed by food held at the wrong temperature and by contamination. Pests are tied to outbreaks in one study and are not a factor in CDC's analyses.
Then we asked the city's record. A restaurant can contest its violations at a hearing. Across eleven dated copies of the inspection table, 15,678 scores changed for the better afterward and 298 for the worse. Temperature and handling violations are removed about five times as often as pest evidence (1.7% against 0.3%). The leading cause, a sick worker, is not on the record at all. Removals are rare either way, and we see the changes, not the hearings.
How we built it
- The graph. Two of the four rows in the comparison come from studies in System's public graph (contamination violations, odds ratio 4.9; vermin, odds ratio 3.3). The graph's findings on inspection scores and outbreaks disagree, which is what led us to look at the record itself.
- Fixed versions. The city rewrites its inspection table every day and keeps no history. We compared two versions held on the Underlay (June and November 2026) and nine yearly copies from the Internet Archive, inspection by inspection.
- Live queries. The page reads both Underlay versions when a button is pressed. A visitor can type any Manhattan restaurant: the page asks the city's data portal for its inspections today, fetches the same inspections from the June version, and lists which violations were removed. A question box answers typed questions from the page's tables.
- Registered tests. Behind this are 98 predictions written down before the data were read, each checked by a referee, published as a versioned collection on the Underlay (v1.2.0). One of them tests inspection scores against food-poisoning complaints, and its verdict is unsettled.
Challenges
The Underlay has no query by field, so listing one inspection's violations takes 157 requests. The graph does not record which variable is the exposure. System's variable search returned errors during the event, so the research column is fixed text with links to each study.
What we learned
The result came from comparison: research against record, and one version of a record against another. A city's table that keeps no history cannot be checked, and a finding should say which version of its data it rests on.
Limits
The research comes from several cities and decades and was read from abstracts. The inspection analysis is from 14 November, exploratory and not refereed.
What was built when
The claim register, its test scripts and the link explorer were built on 12 and 13 November. Built on 14 November: the inspections comparison and its page, the live lookup, the question box, the version comparison of our claims, the strips, two Underlay versions and four registered tests. The README states this.
AI tools
The code, tests and write-ups were produced with Claude Code (Anthropic) under the team's direction. Referee reports were written by separate agents that did
Built With
- claude
- internet-archive
- javascript
- nyc-open-data
- pandas
- python
- socrata
- statsmodels
- svg
- system-public-graph
- underlay
