-
-
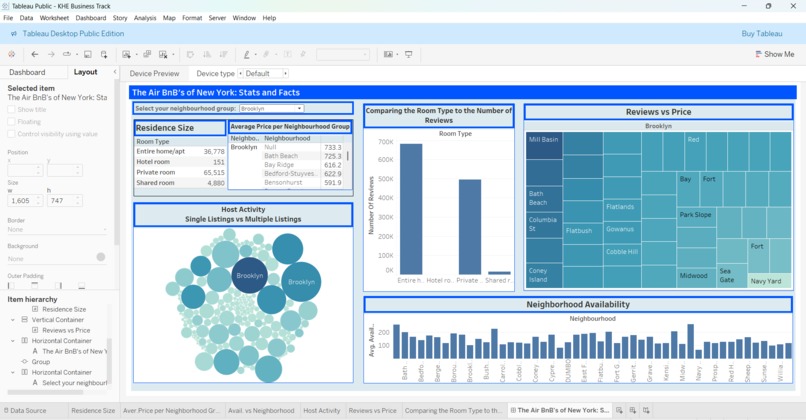
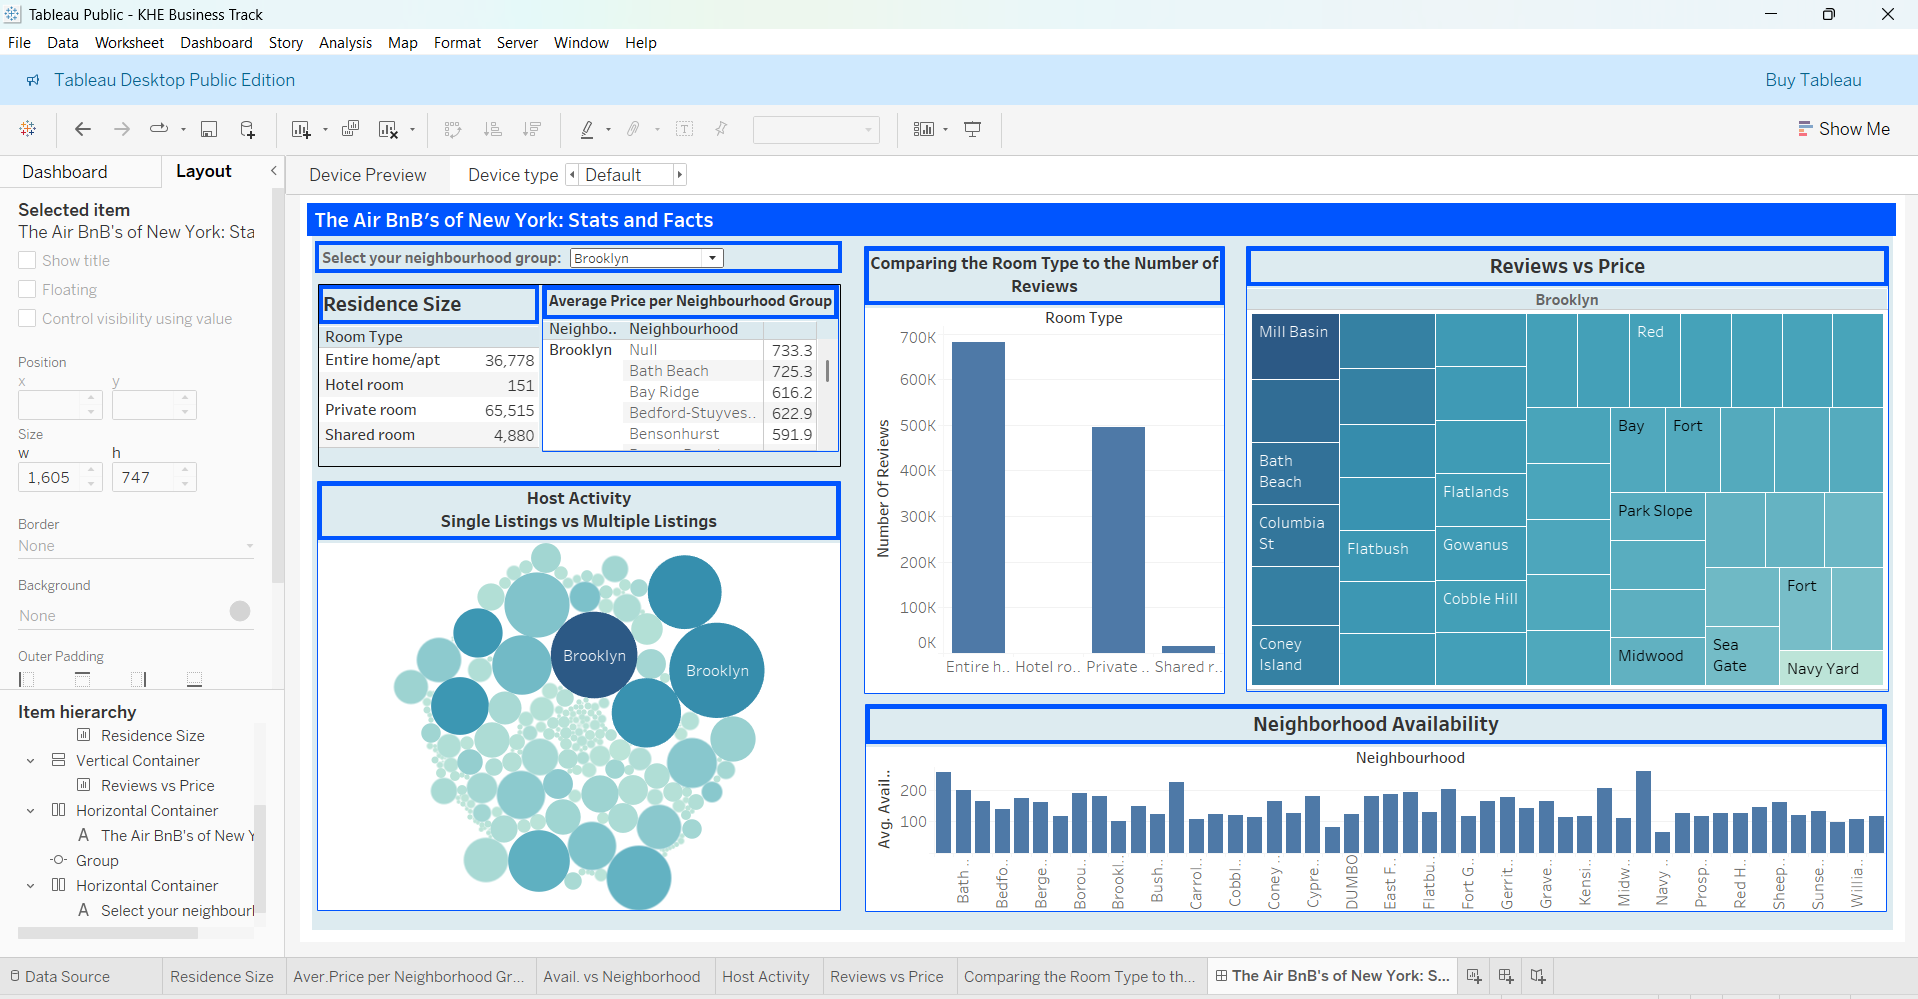
A display of the workbook and the end result
-
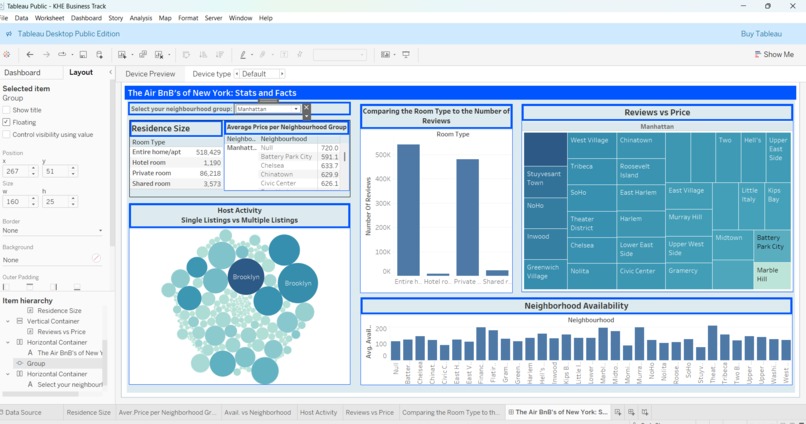
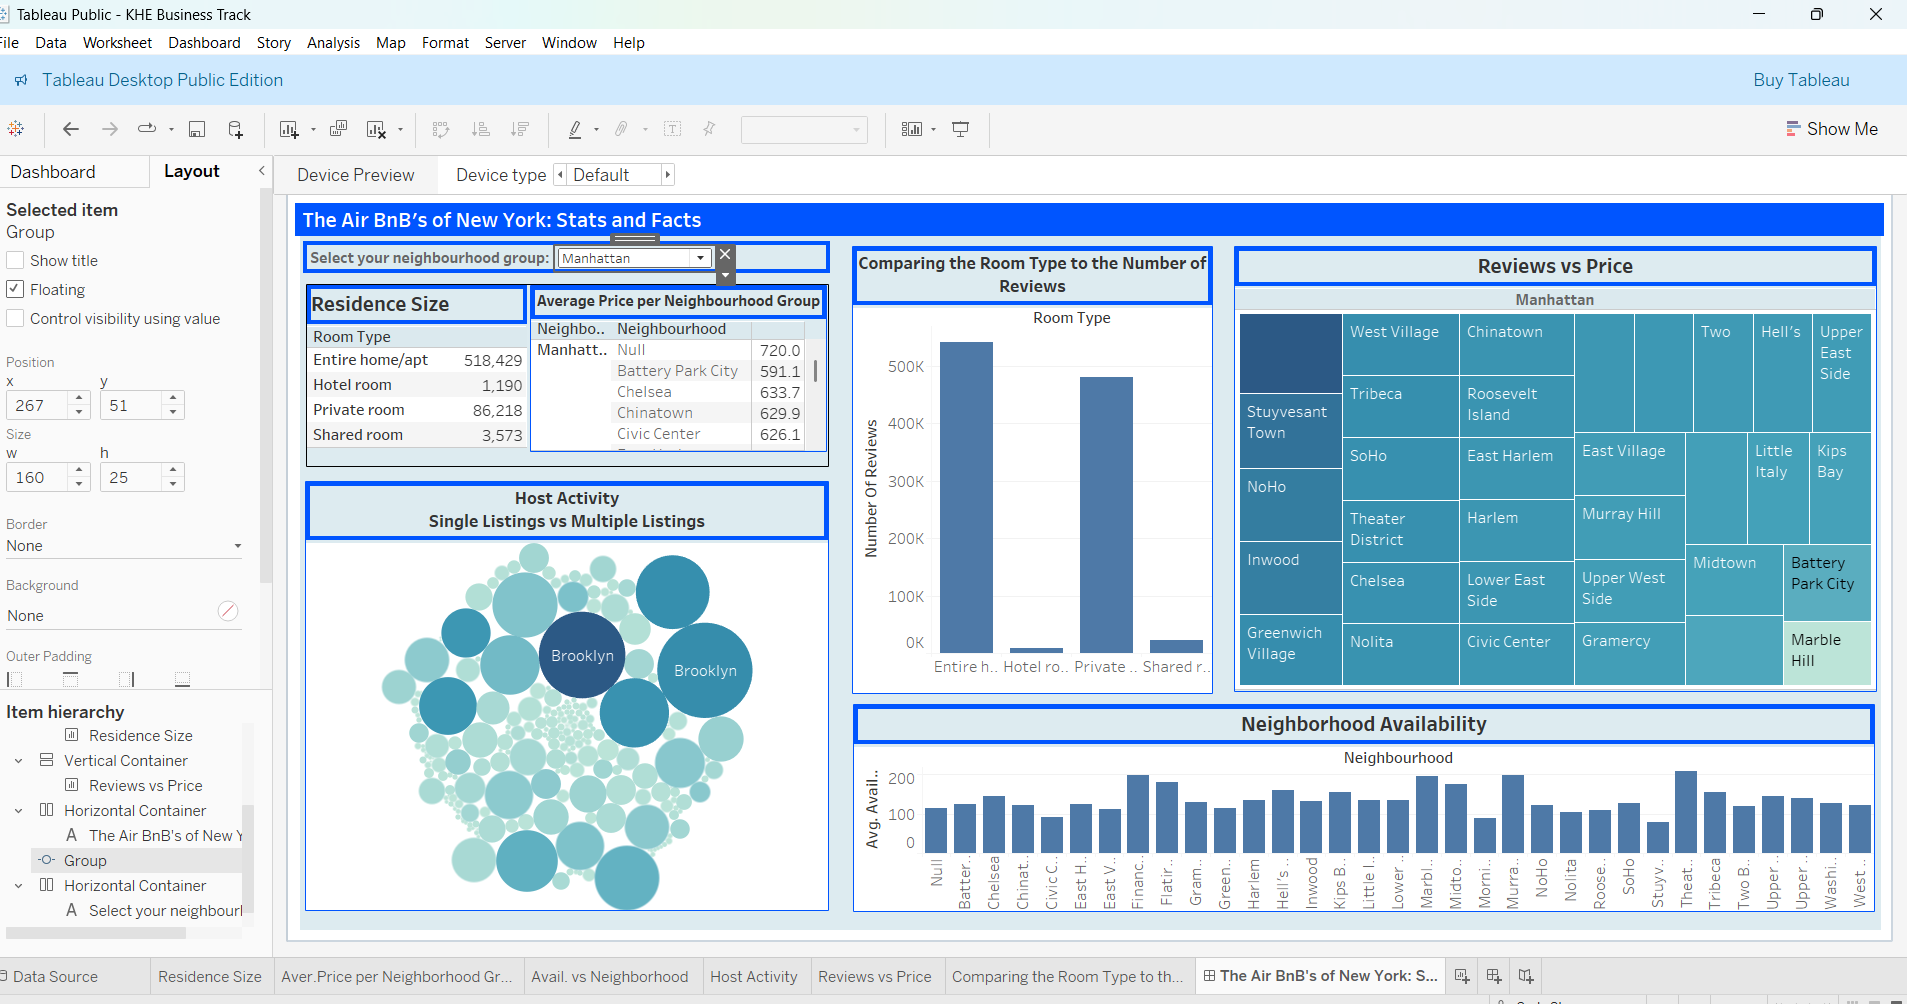
A display of the interactive visuals-switching the group in the upper left changes the majority of the graphs/charts
Inspiration
I wanted to take the opportunity to learn a new tool used in Data Science. I have a previous degree in Business Administration, so working in the Business Track seemed like a good way to merge that with the Computer Science degree I'm currently pursuing.
What it does
Its an interactive dashboard that showcases several statistics regarding Air BnB's from New York. You'll be able to draw a comparison between different neighborhoods and determine your preference based on price, availability, and more.
How we built it
I used Kaggle ( link) to get the dataset, Tableau (link) to create the visual dashboard, and Microsoft Excel to help transfer the data set from Kaggle to Tableau.
Challenges we ran into
I had to learn how to use Tableau-until today, I've never even heard of it! I only have a small amount of knowledge in regards to databases, data science, and related fields, so I had to go through a few tutorials to give myself a crash course.
Accomplishments that we're proud of
I actually managed to churn out something I'm proud of. I had points where I wanted to abandon the project and choose something else, but I managed to stick with it, and I'm glad I did.
What we learned
Tableau is an interesting tool-I hope I get the opportunity to use it again in the future! Being able to create an interactive dashboard and help companies and individuals with the data it provides has encouraged me to put more effort into the data aspect of computer science.
What's next for NY AirBnB Tableau Dashboard
Honestly, I'm not sure. Maybe some future maintenance and renovations? Perhaps I'll dive further into Data Science and Engineering and come back with some improvements.

Log in or sign up for Devpost to join the conversation.