NuclearTruth
Inspiration
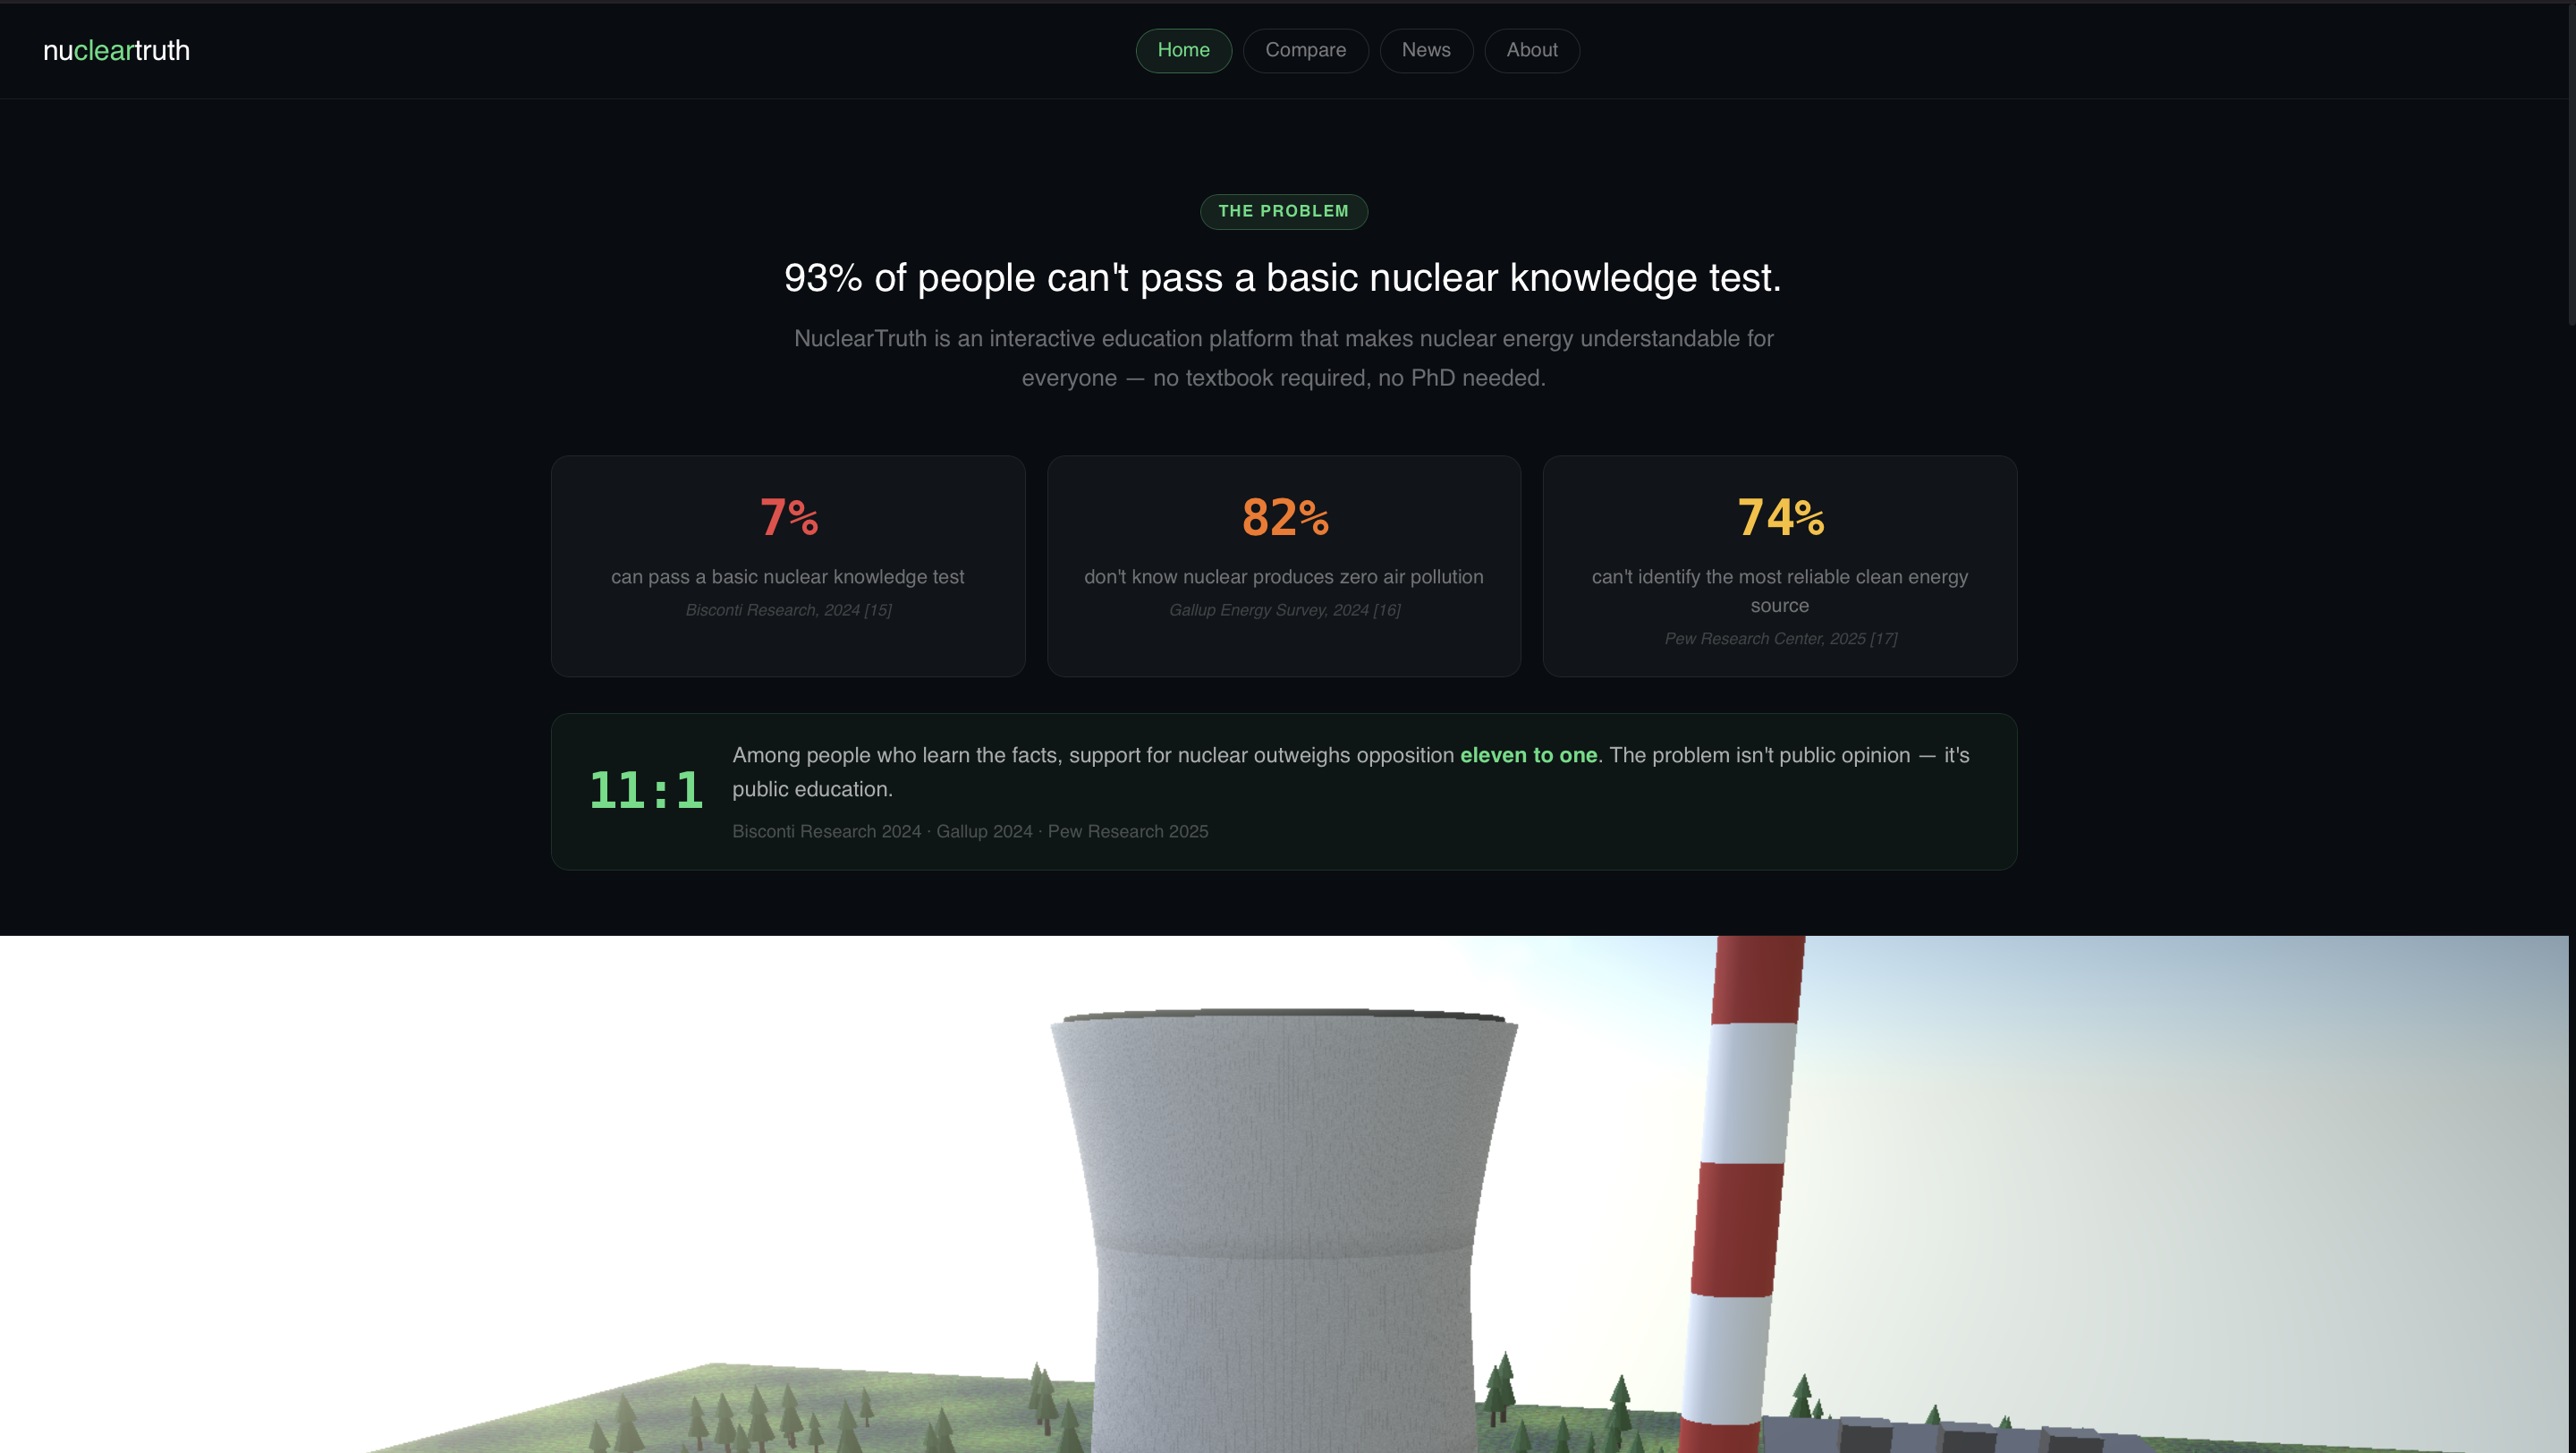
93% of people can't pass a basic nuclear knowledge test. 82% don't know that nuclear power produces zero air pollution during operation. 74% can't name the most reliable clean energy source. Yet among people who actually learn the facts, support for nuclear outweighs opposition eleven to one (Bisconti Research 2024).
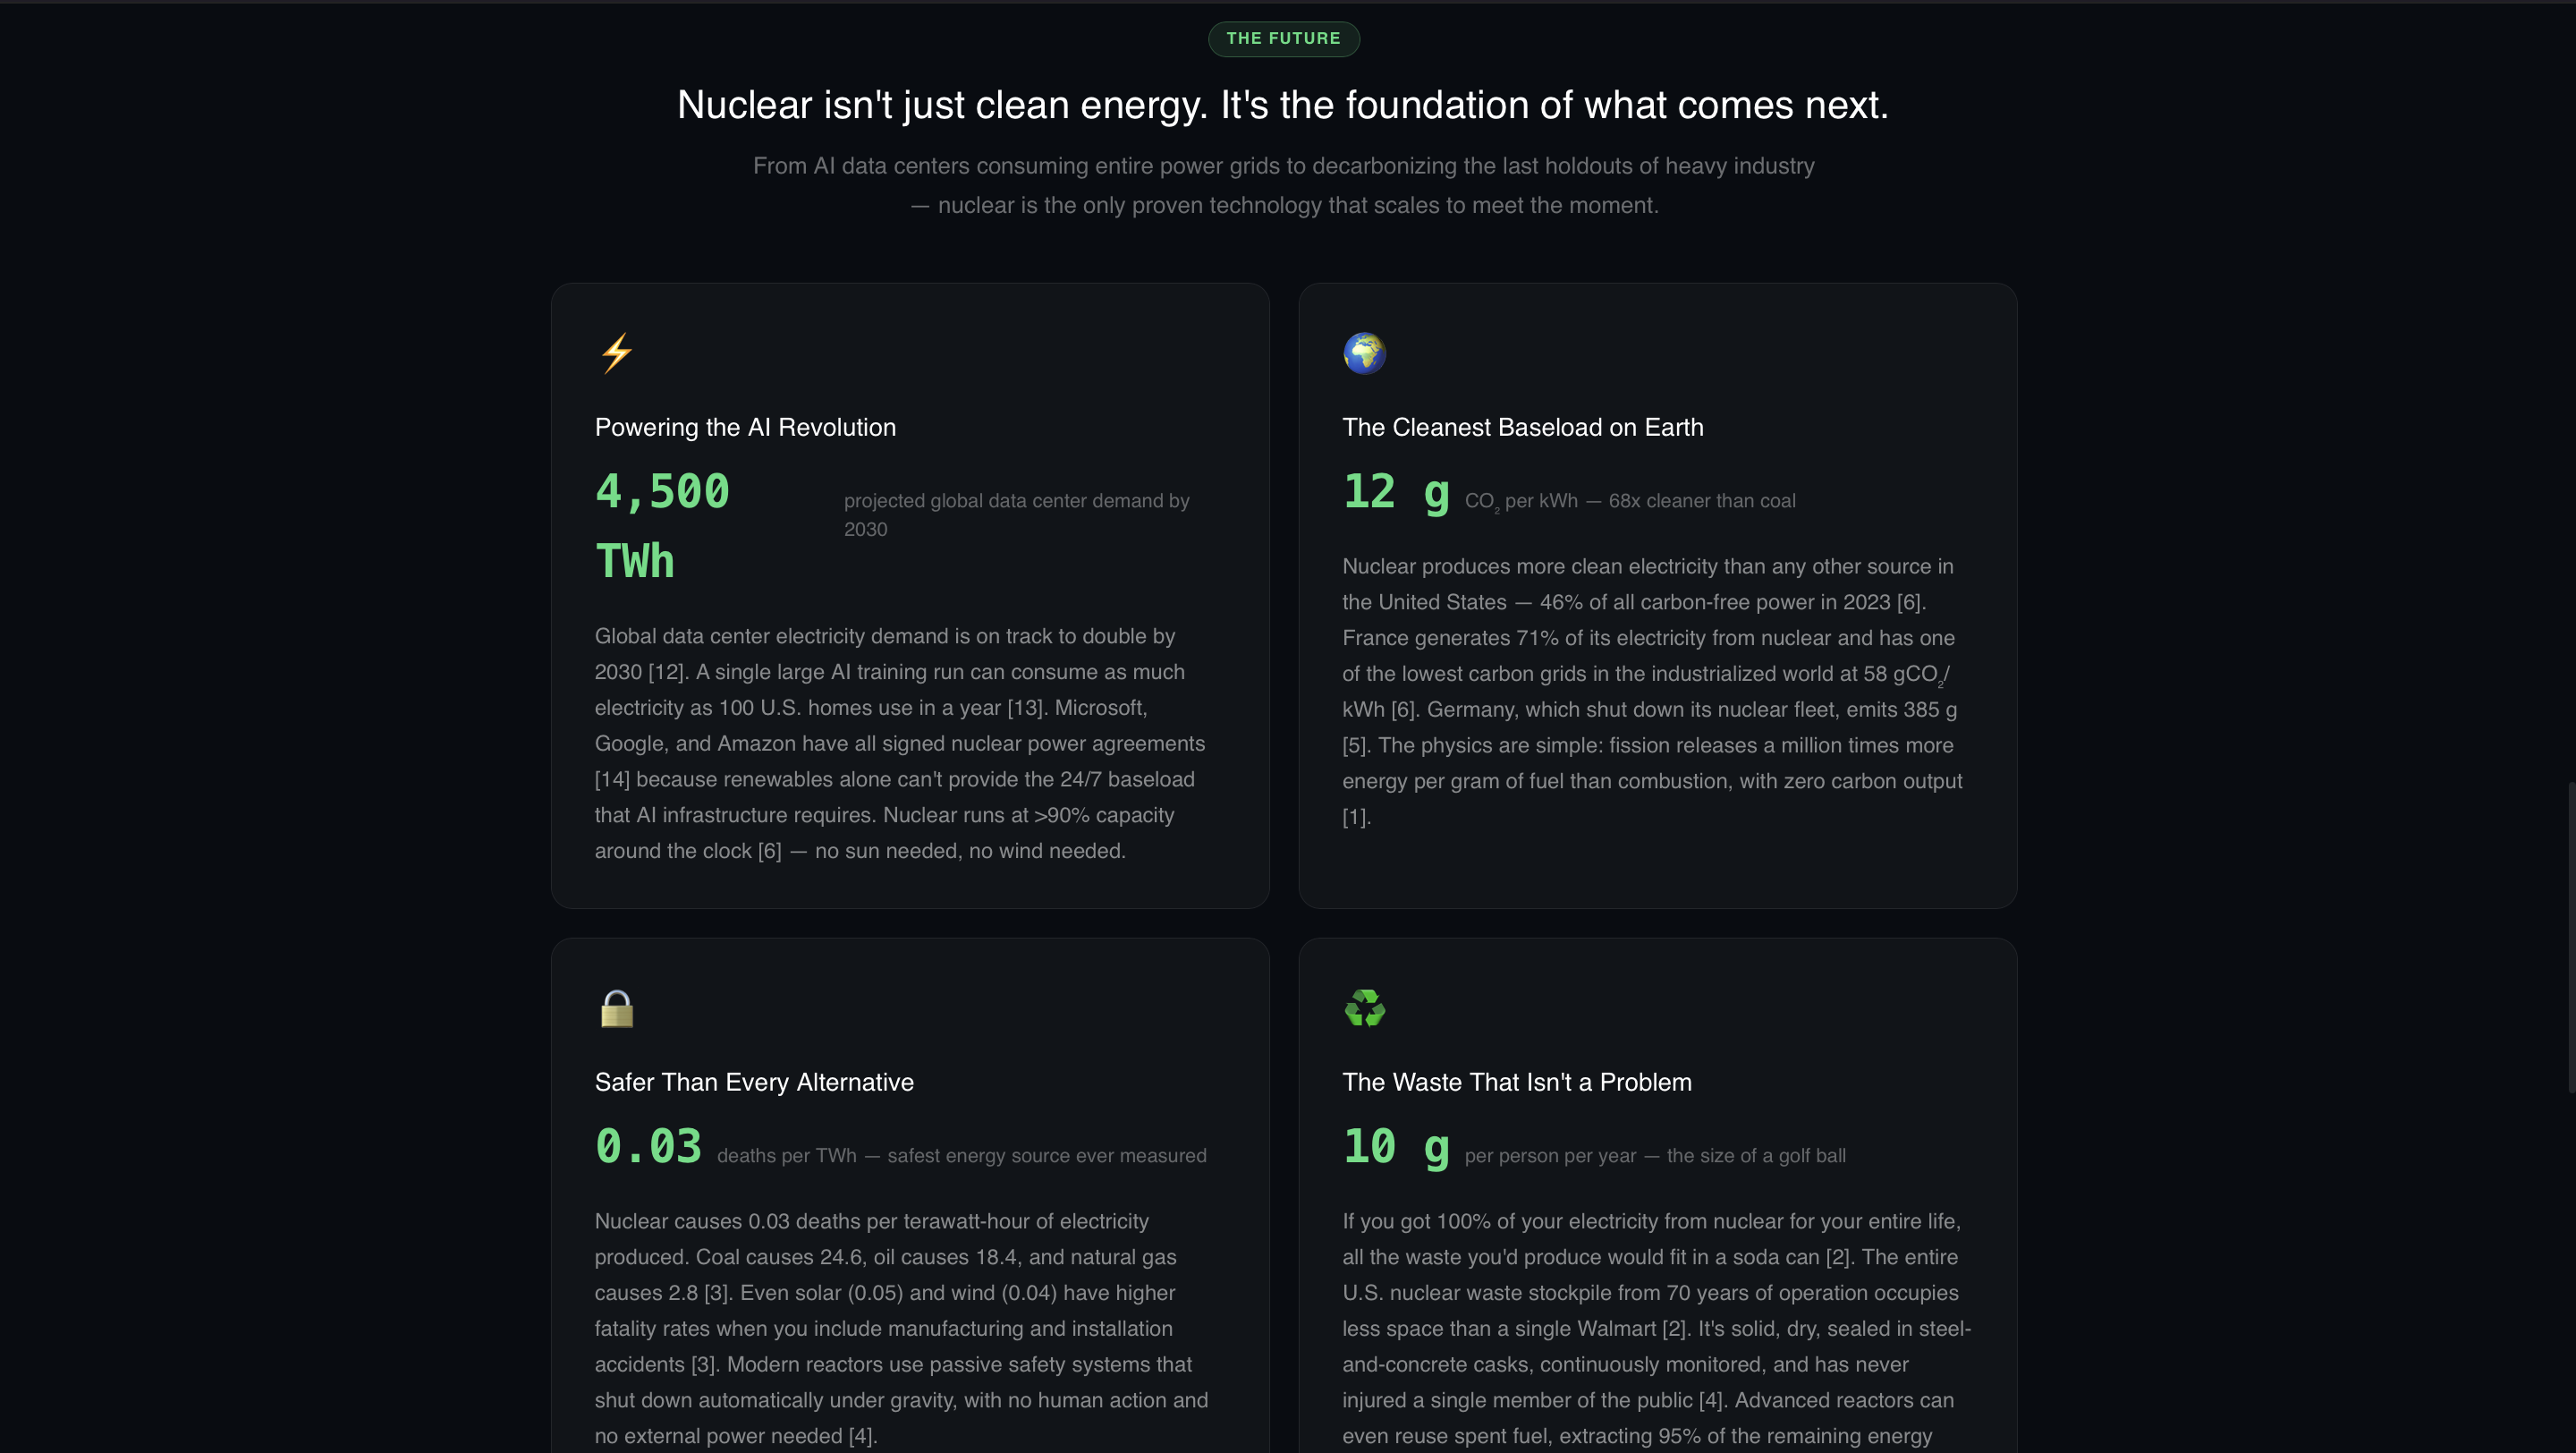
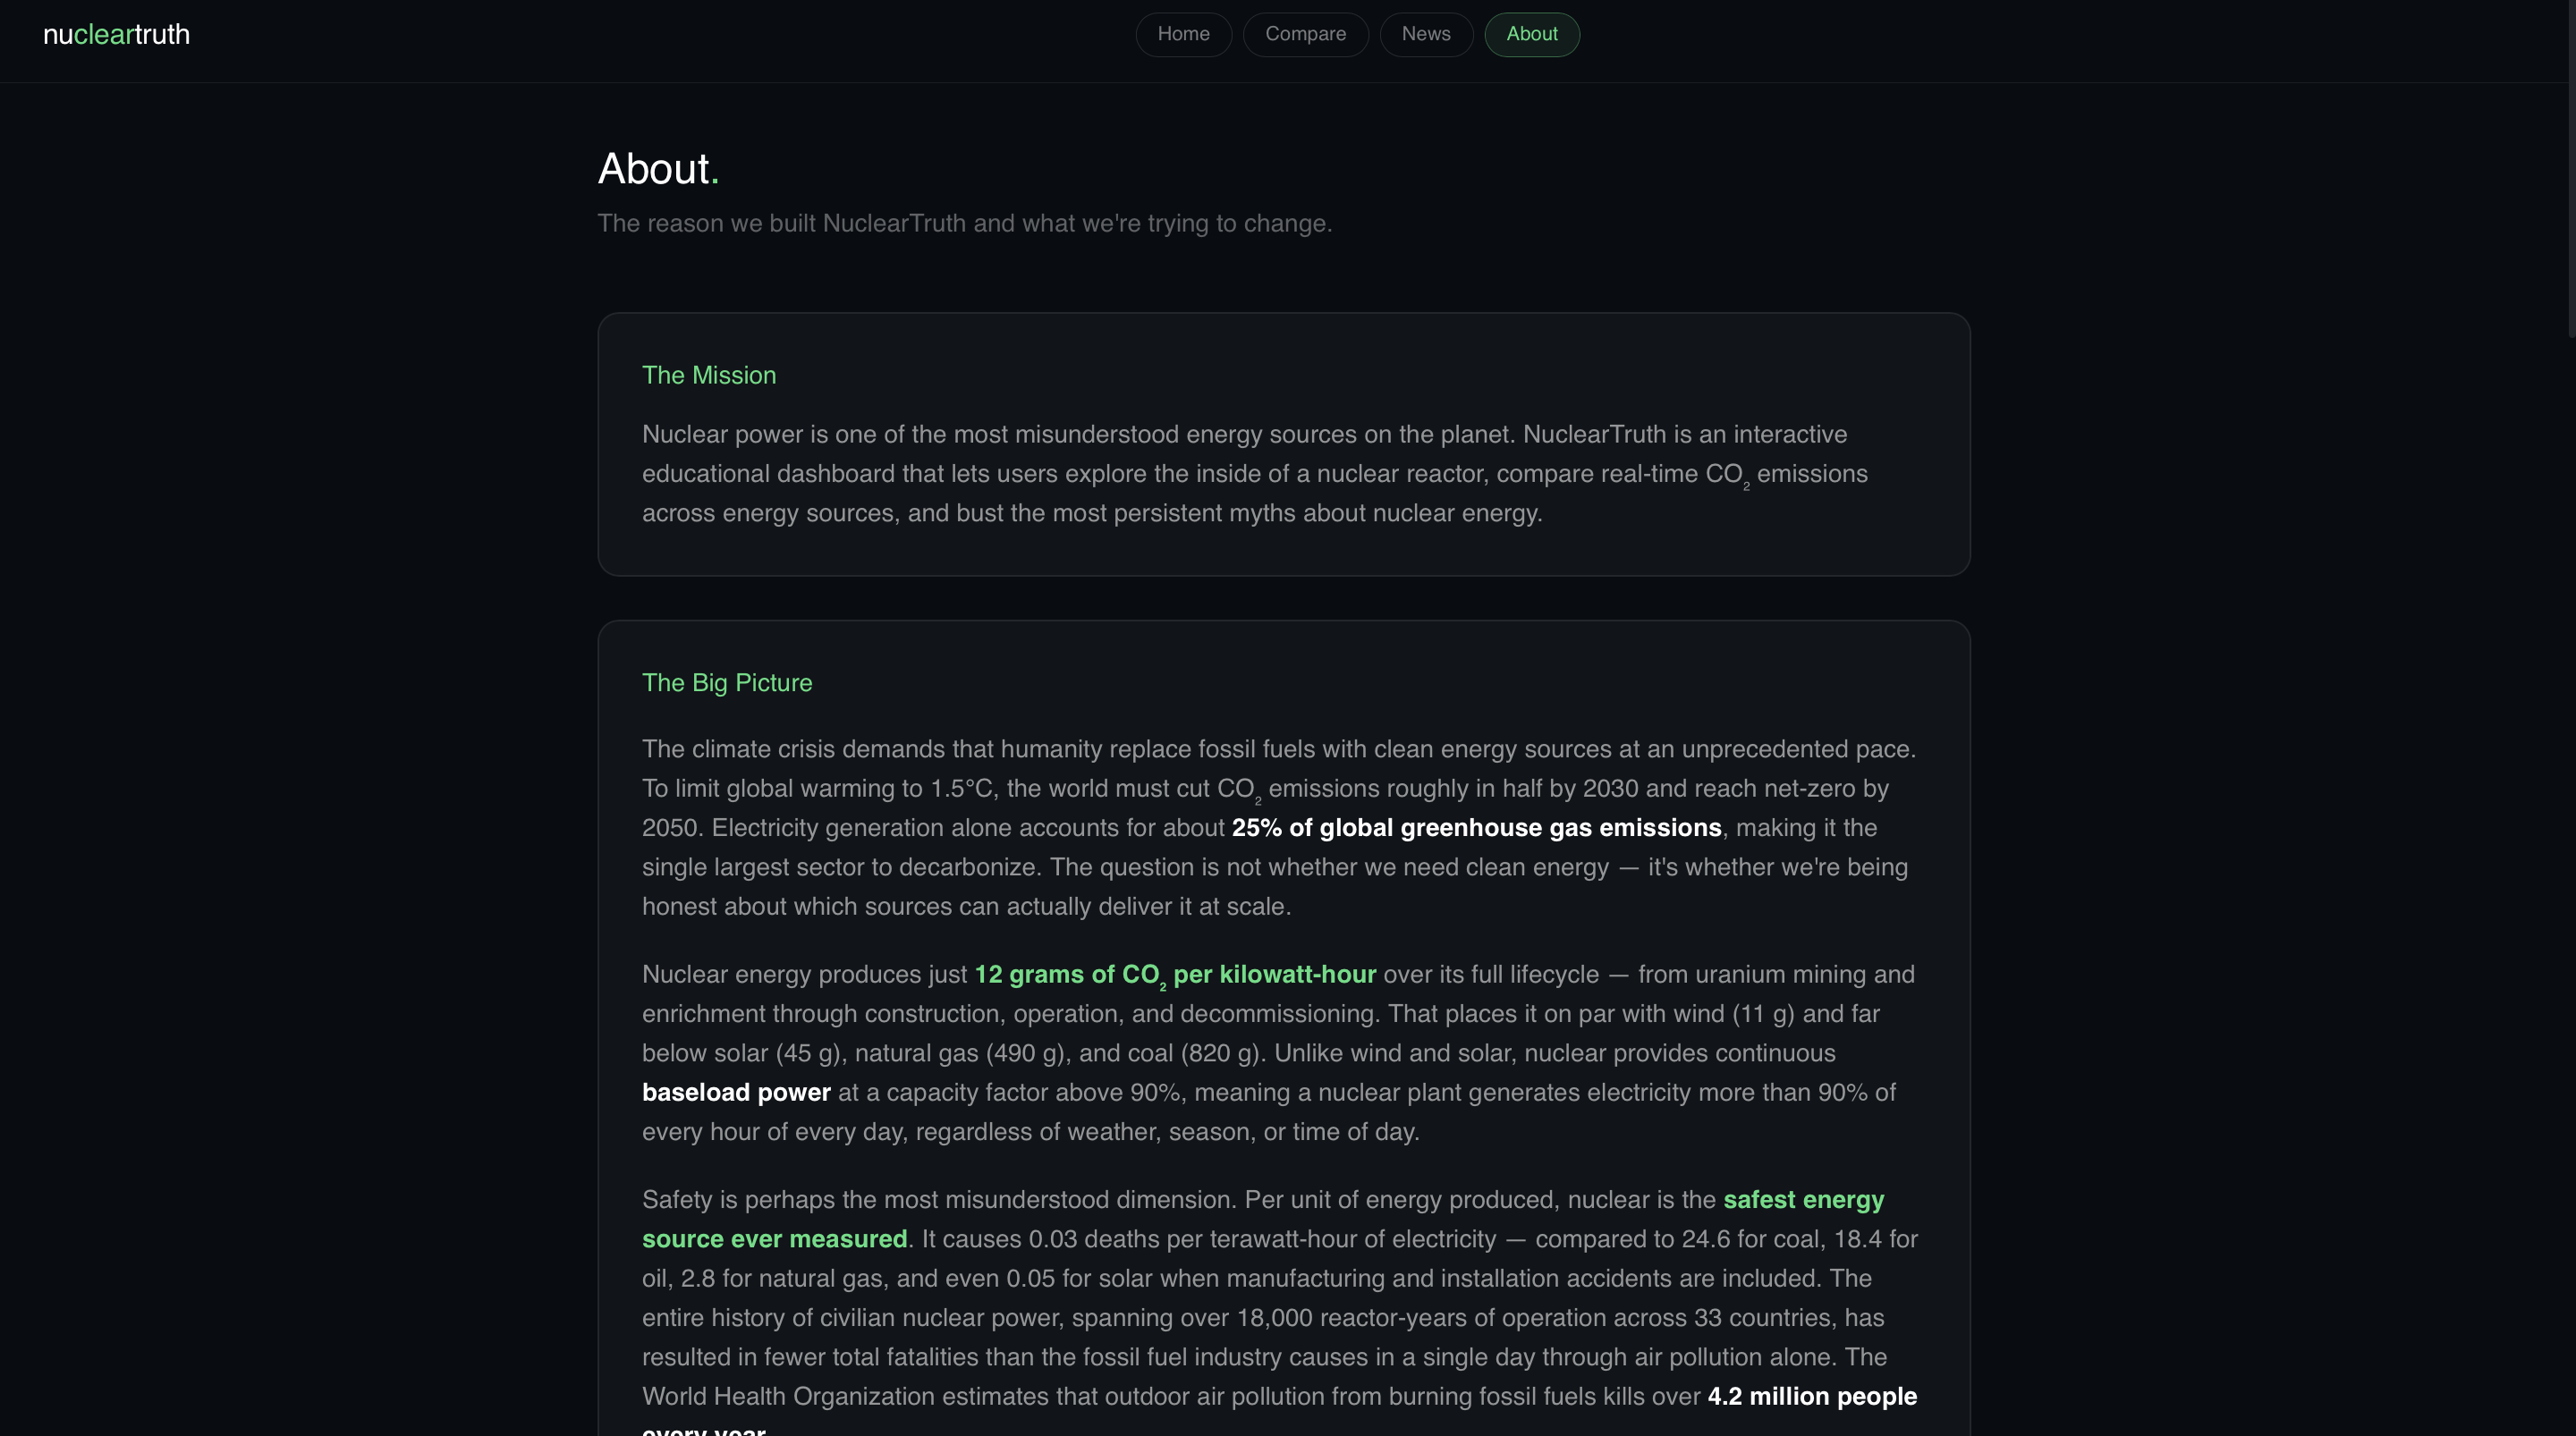
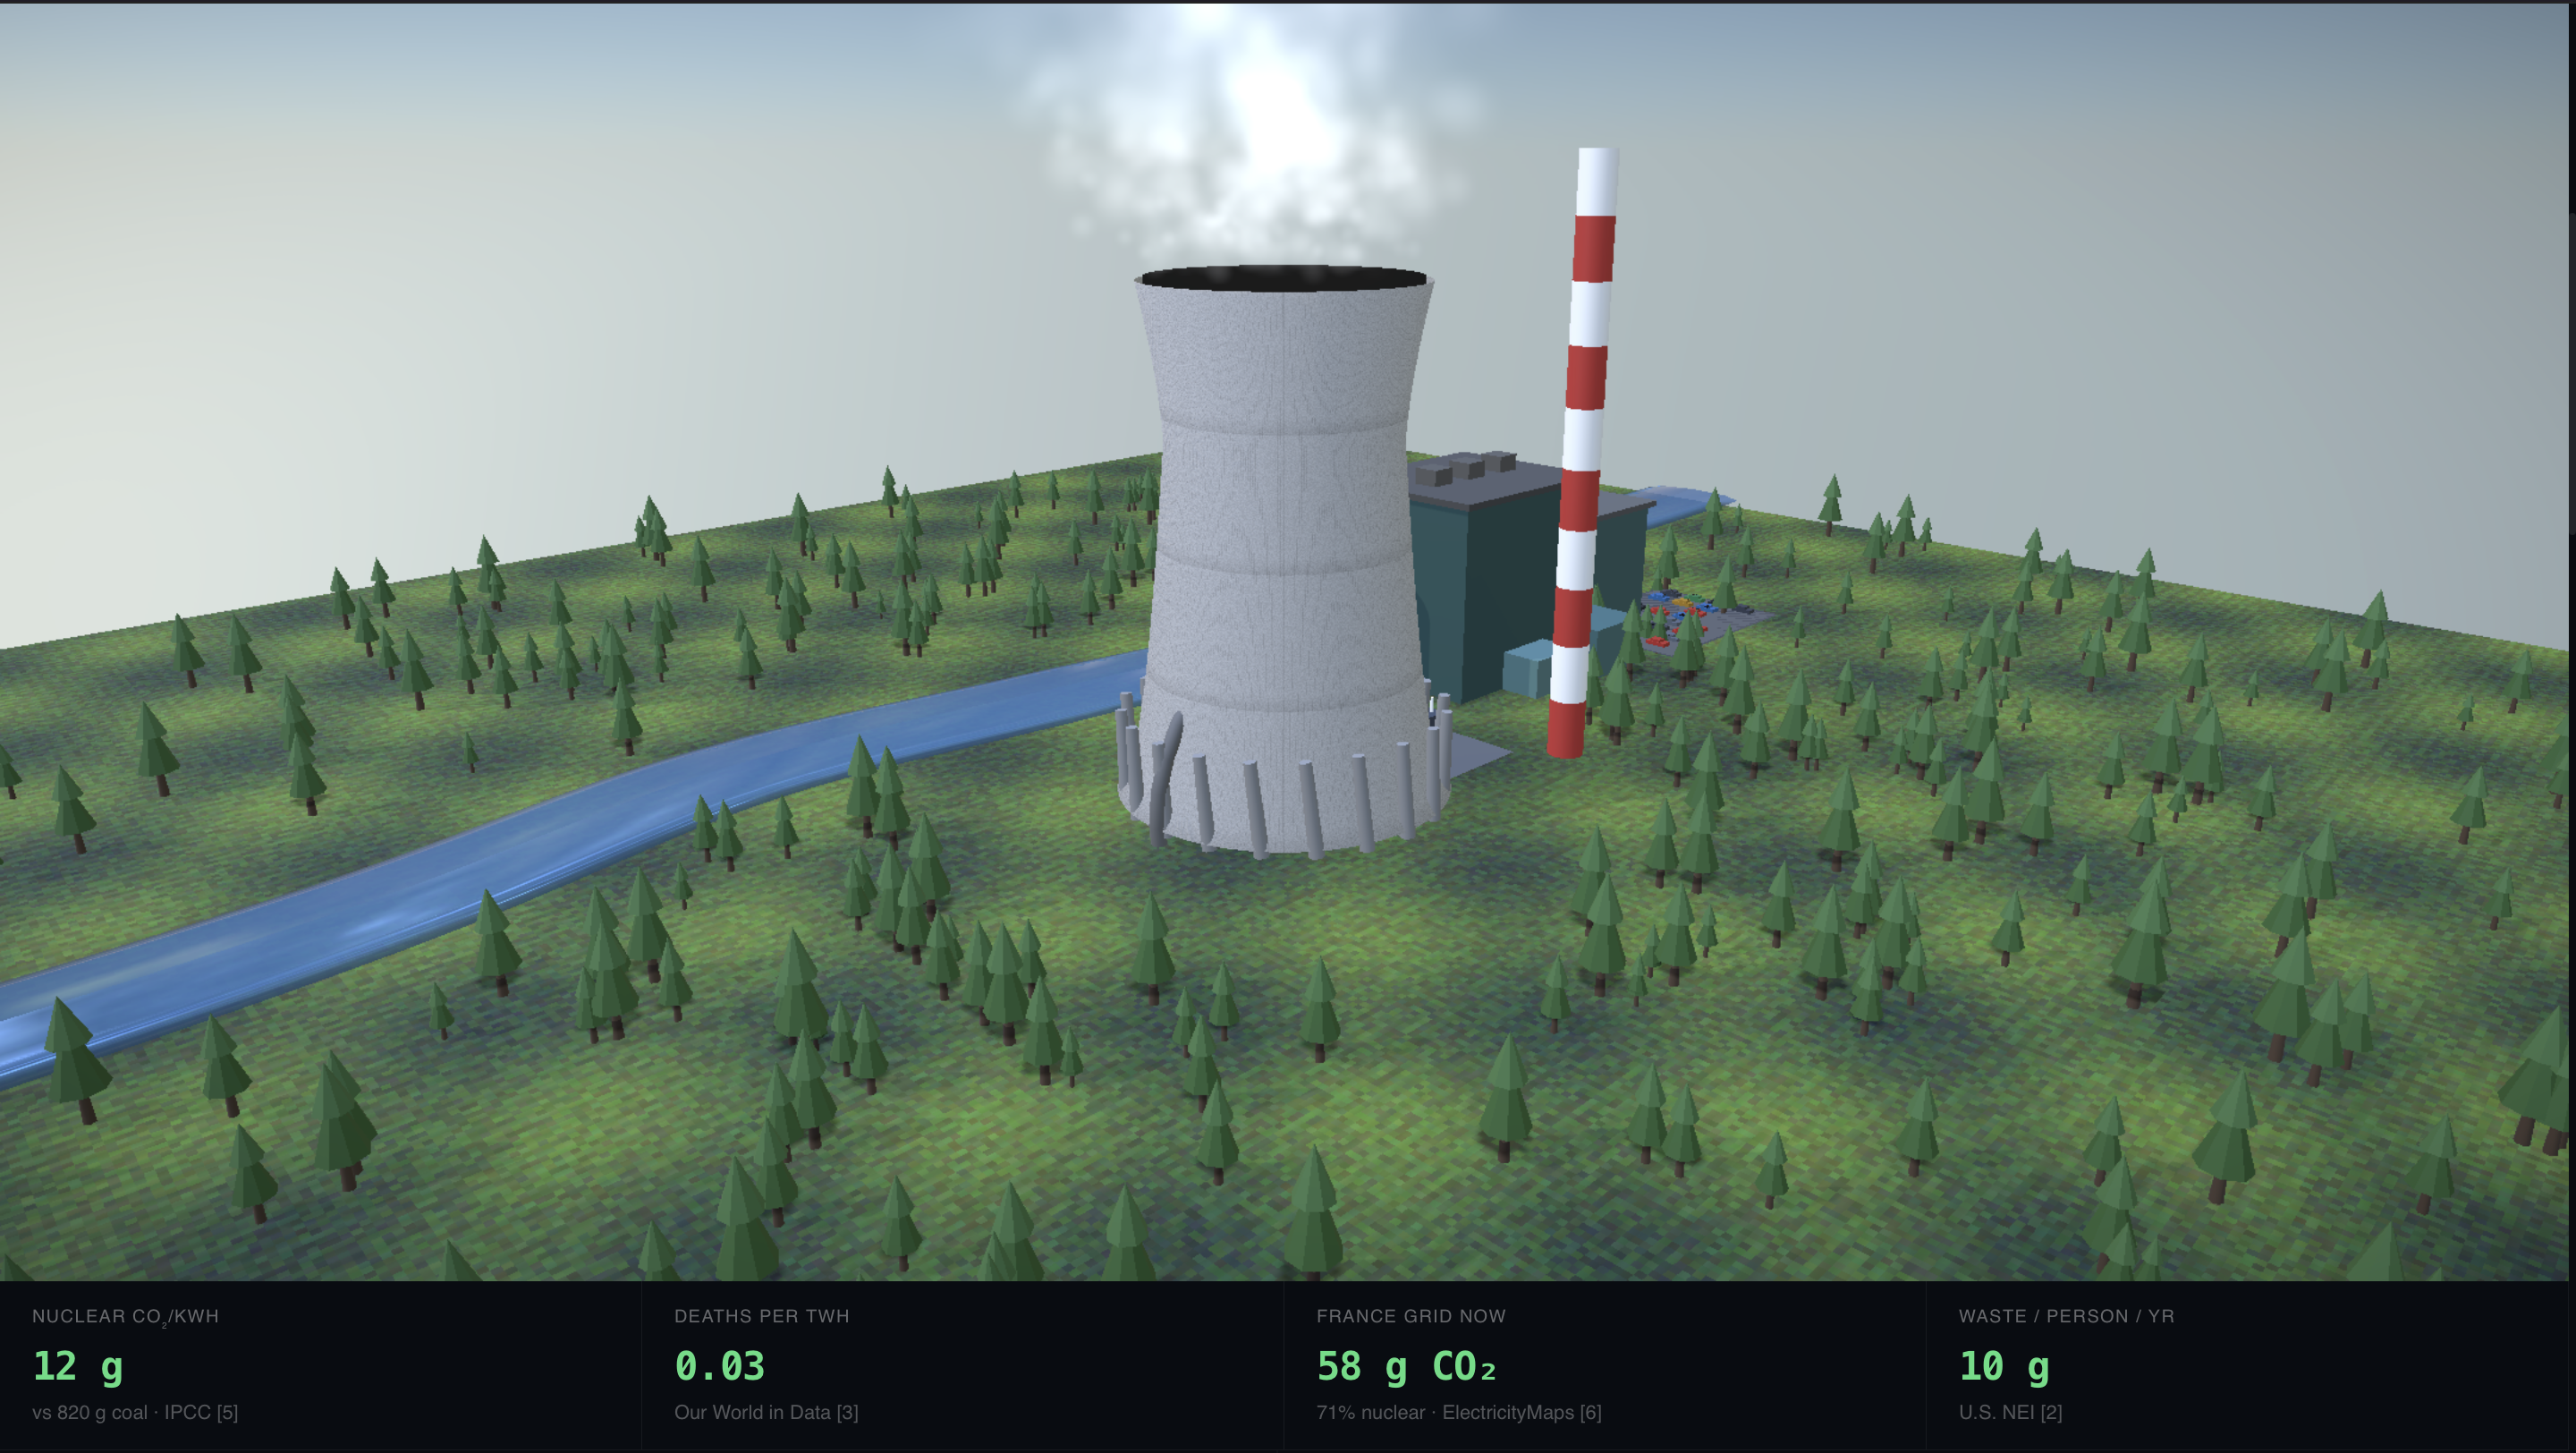
We realized the biggest barrier to clean energy adoption isn't technology or cost — it's education. Nuclear energy is the safest, cleanest baseload power source ever measured at just 0.03 deaths per TWh and 12 g CO₂/kWh, but decades of Hollywood dramatization and media sensationalism have left the public with a distorted picture. We wanted to build something that could change that — not with a textbook, but with an experience.
What it does
NuclearTruth is an interactive education platform built around four core experiences:
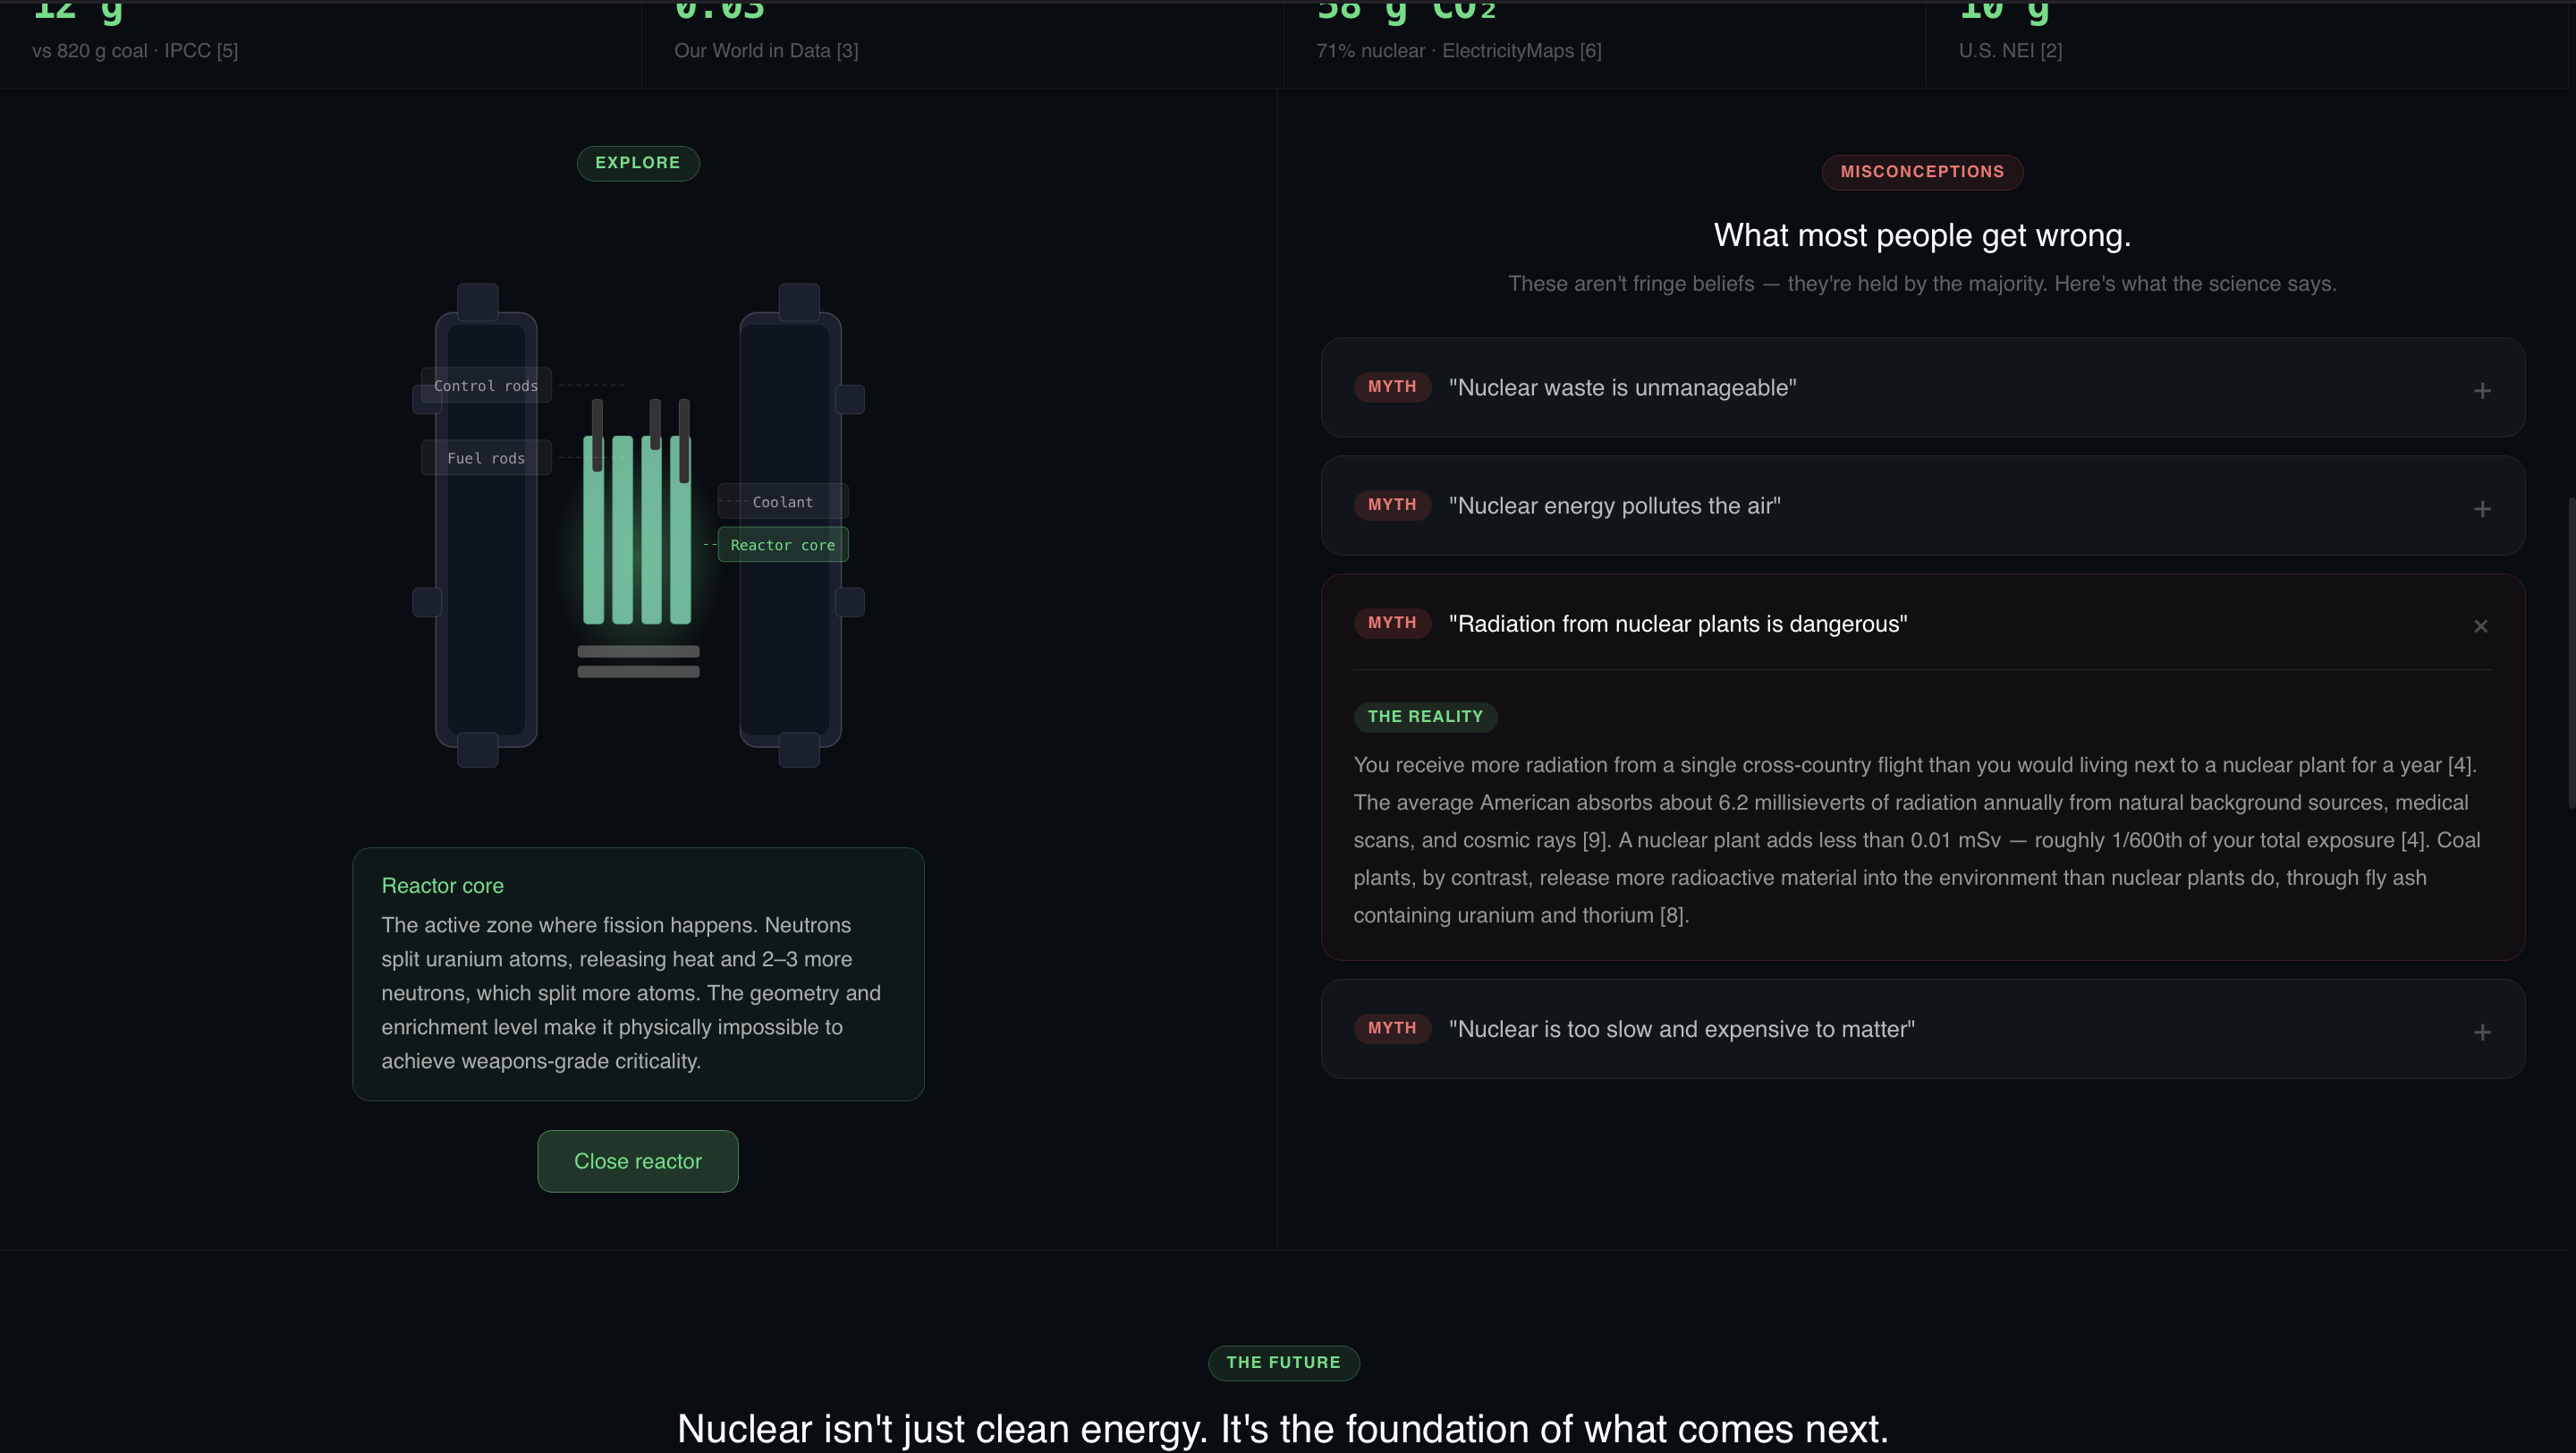
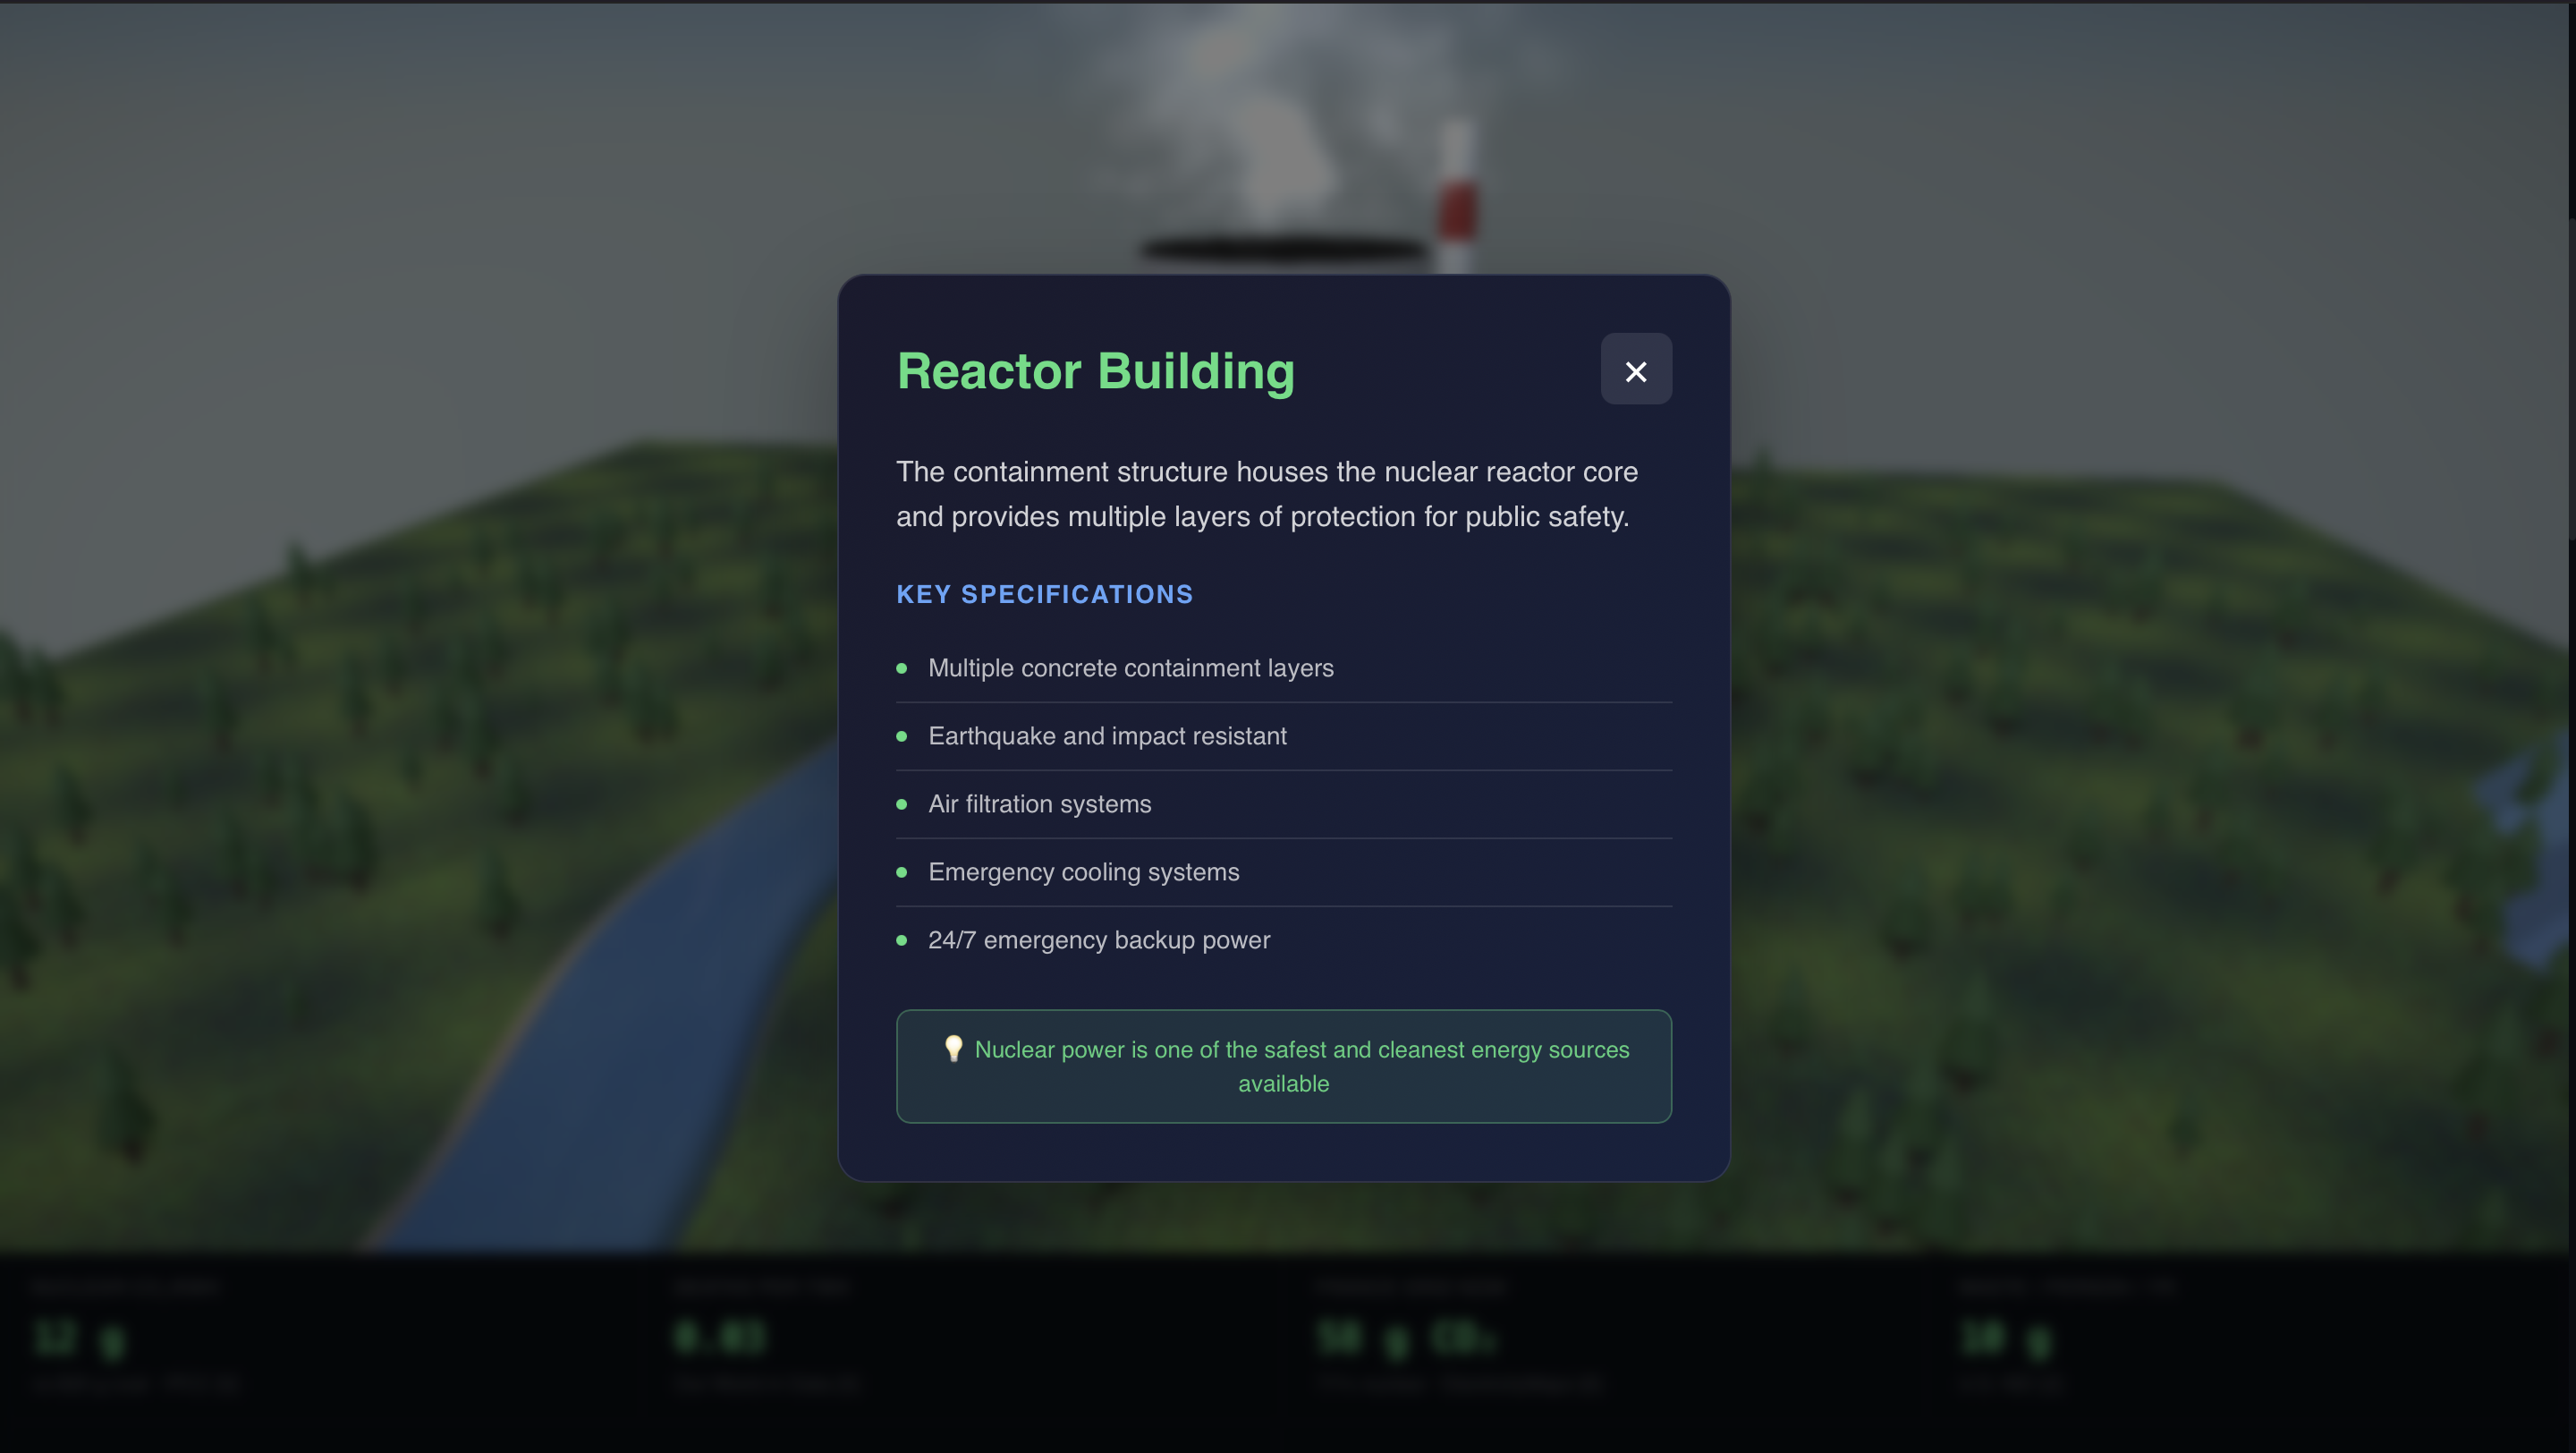
- Home — A scrolling narrative that opens with the public knowledge gap, transitions into an interactive 3D nuclear power plant (with cooling towers, smoke particles, and clickable buildings), presents a split-open 2D reactor where users can explore fuel rods, control rods, coolant systems, and the reactor core, then dives deep into common misconceptions and nuclear's role in powering the AI revolution and data centers of the future.
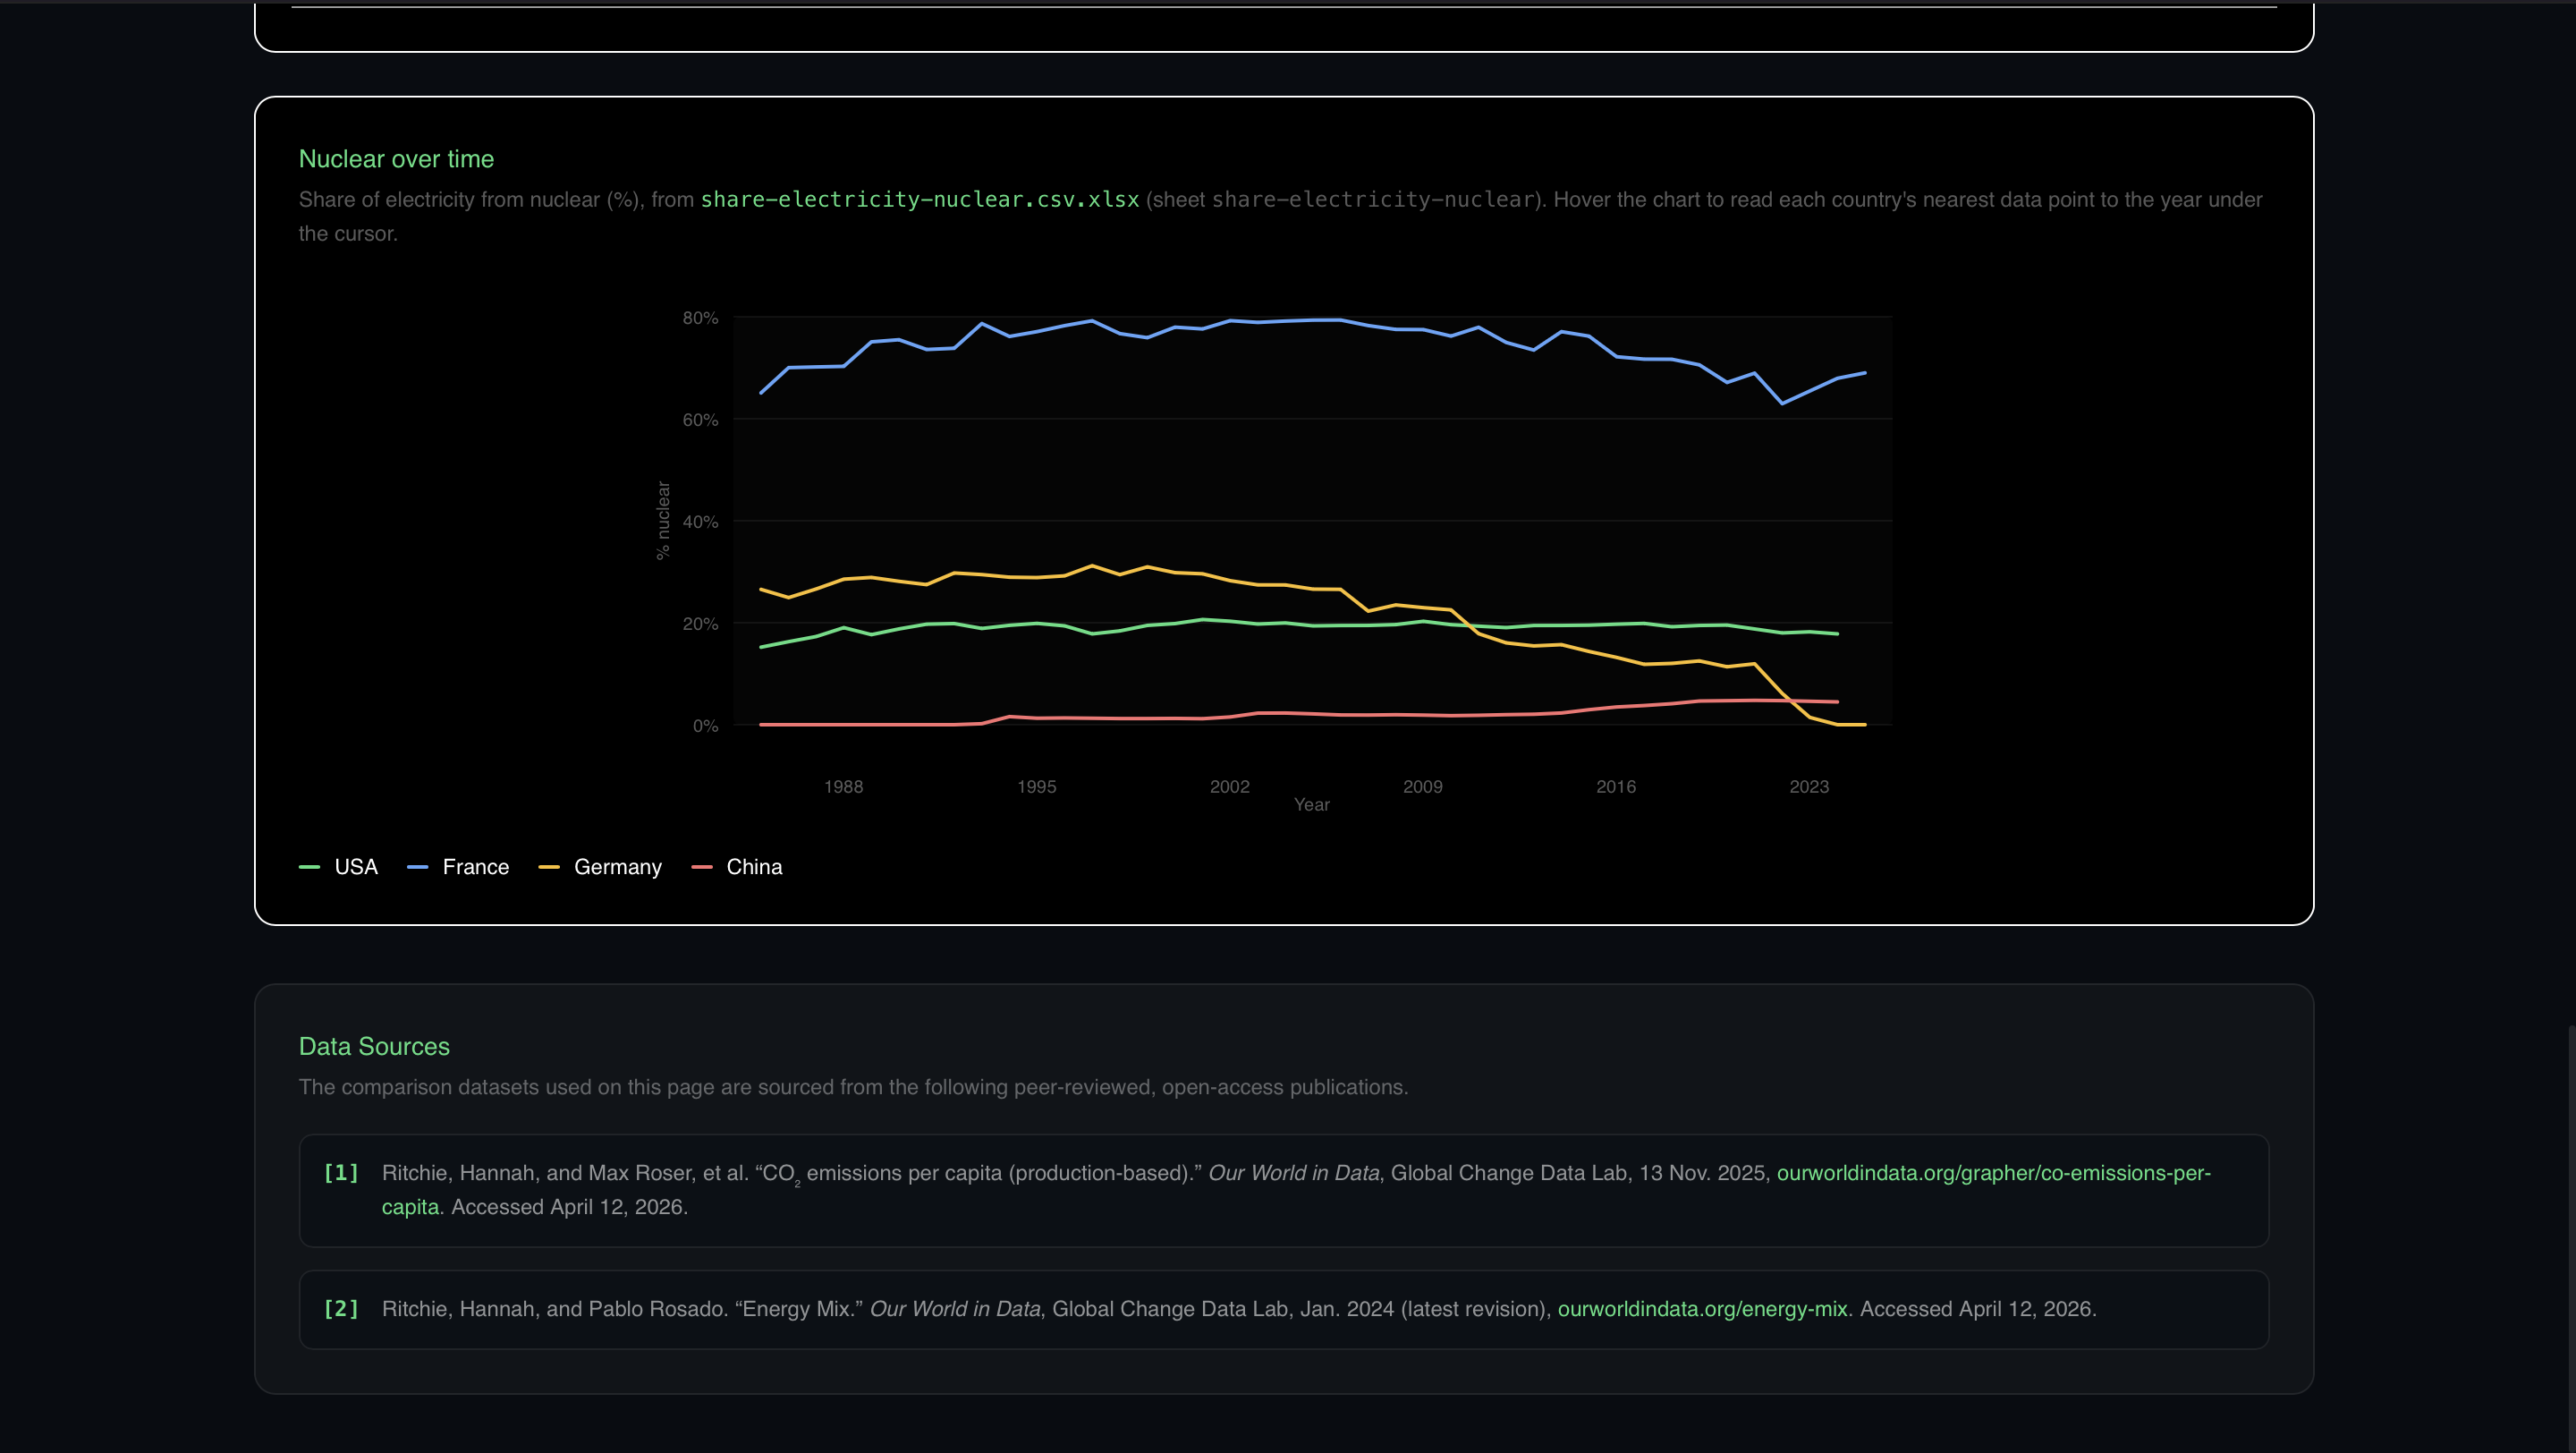
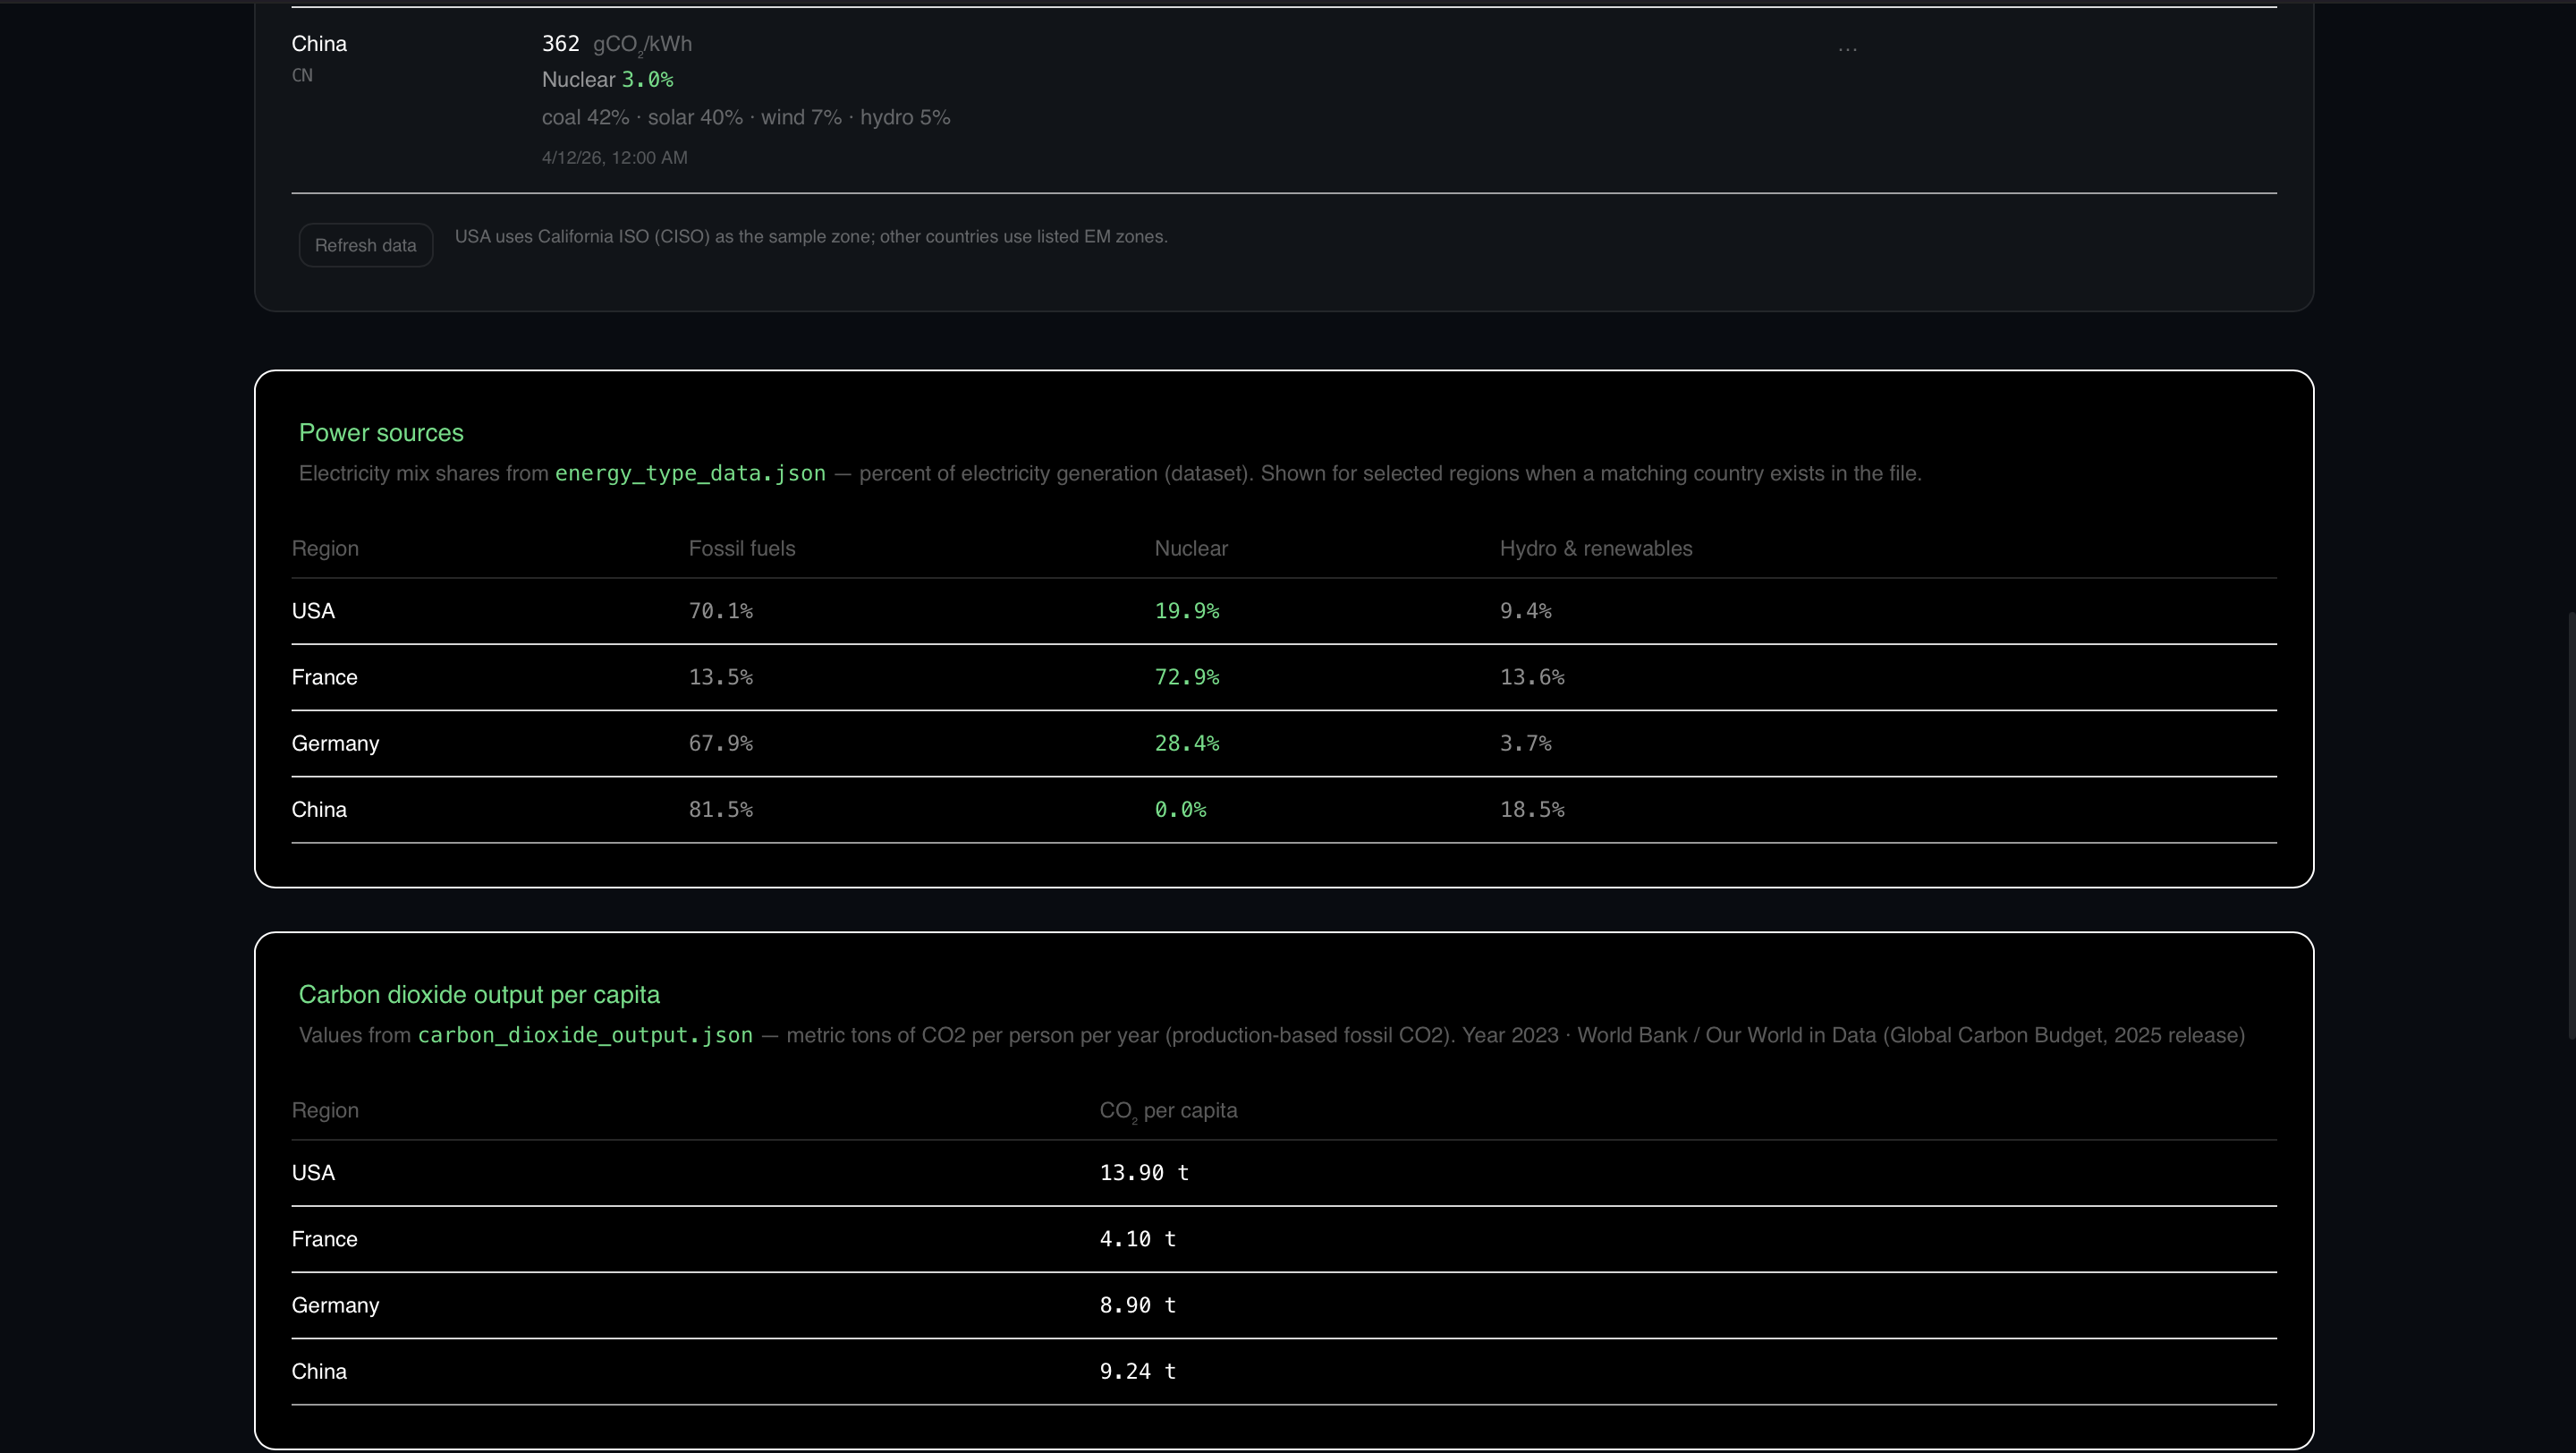
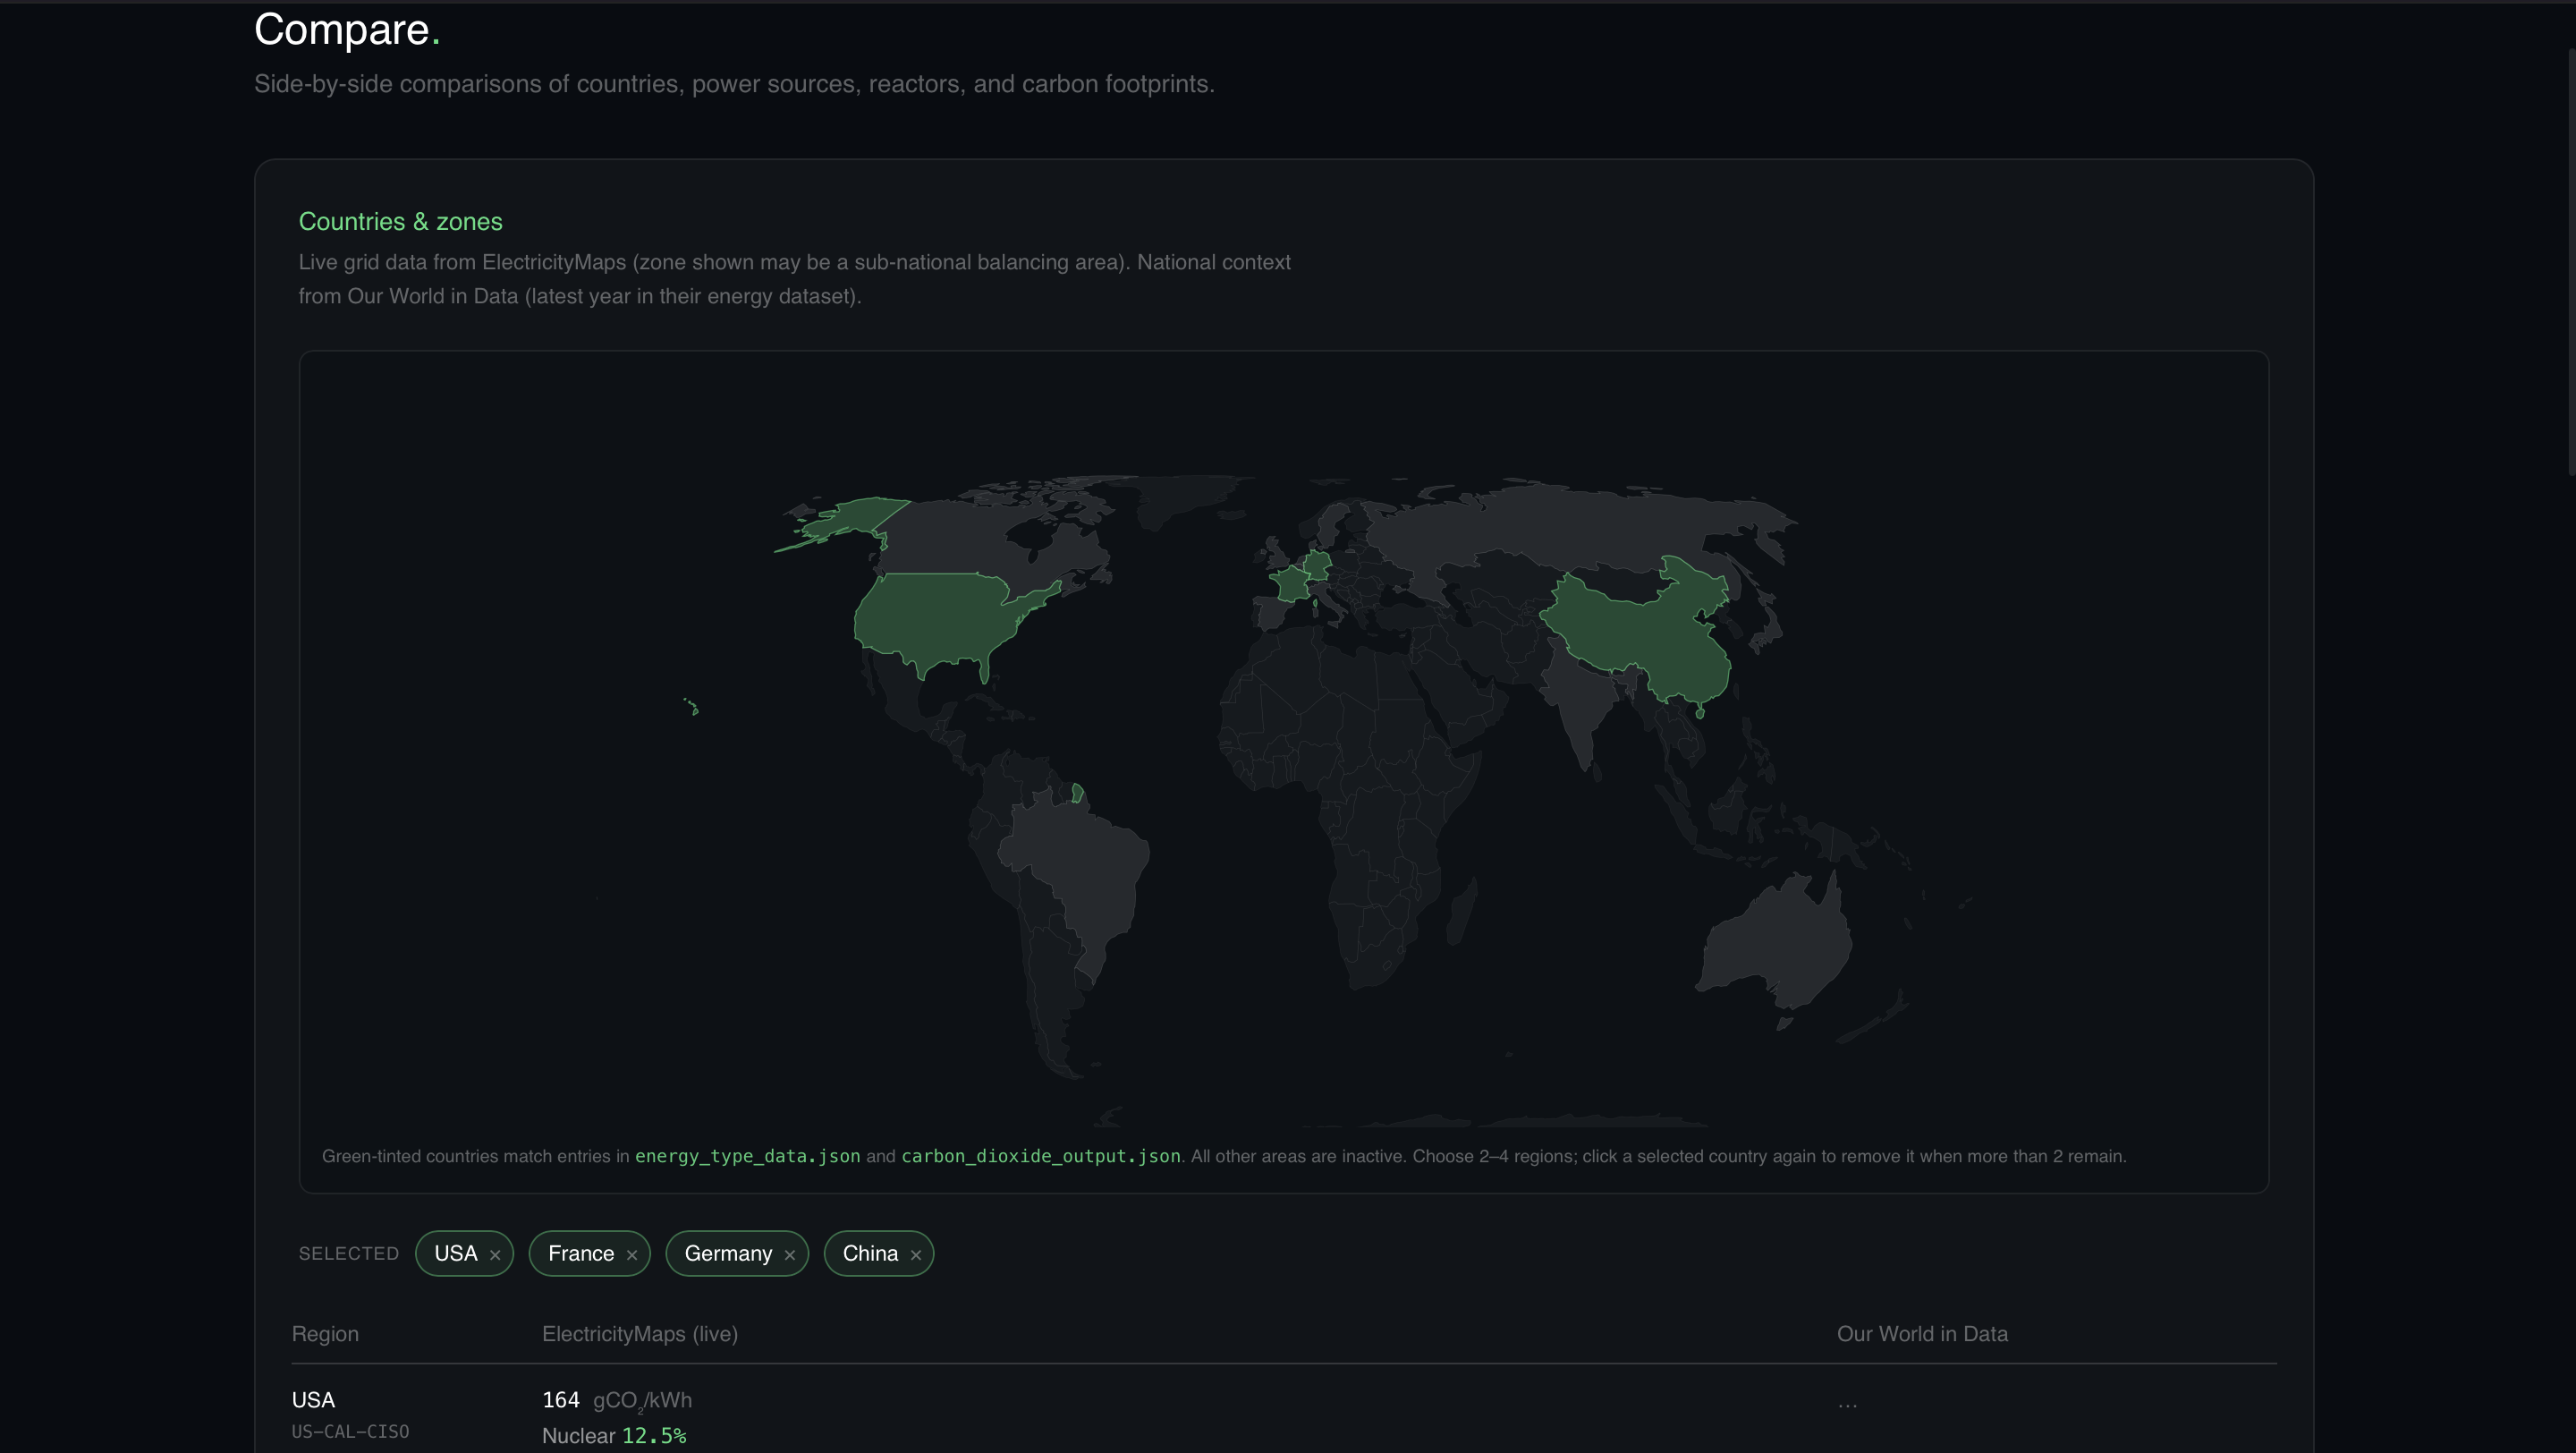
- Compare — Side-by-side comparisons of countries, power sources, individual reactors, and carbon per capita, drawing from real energy data.
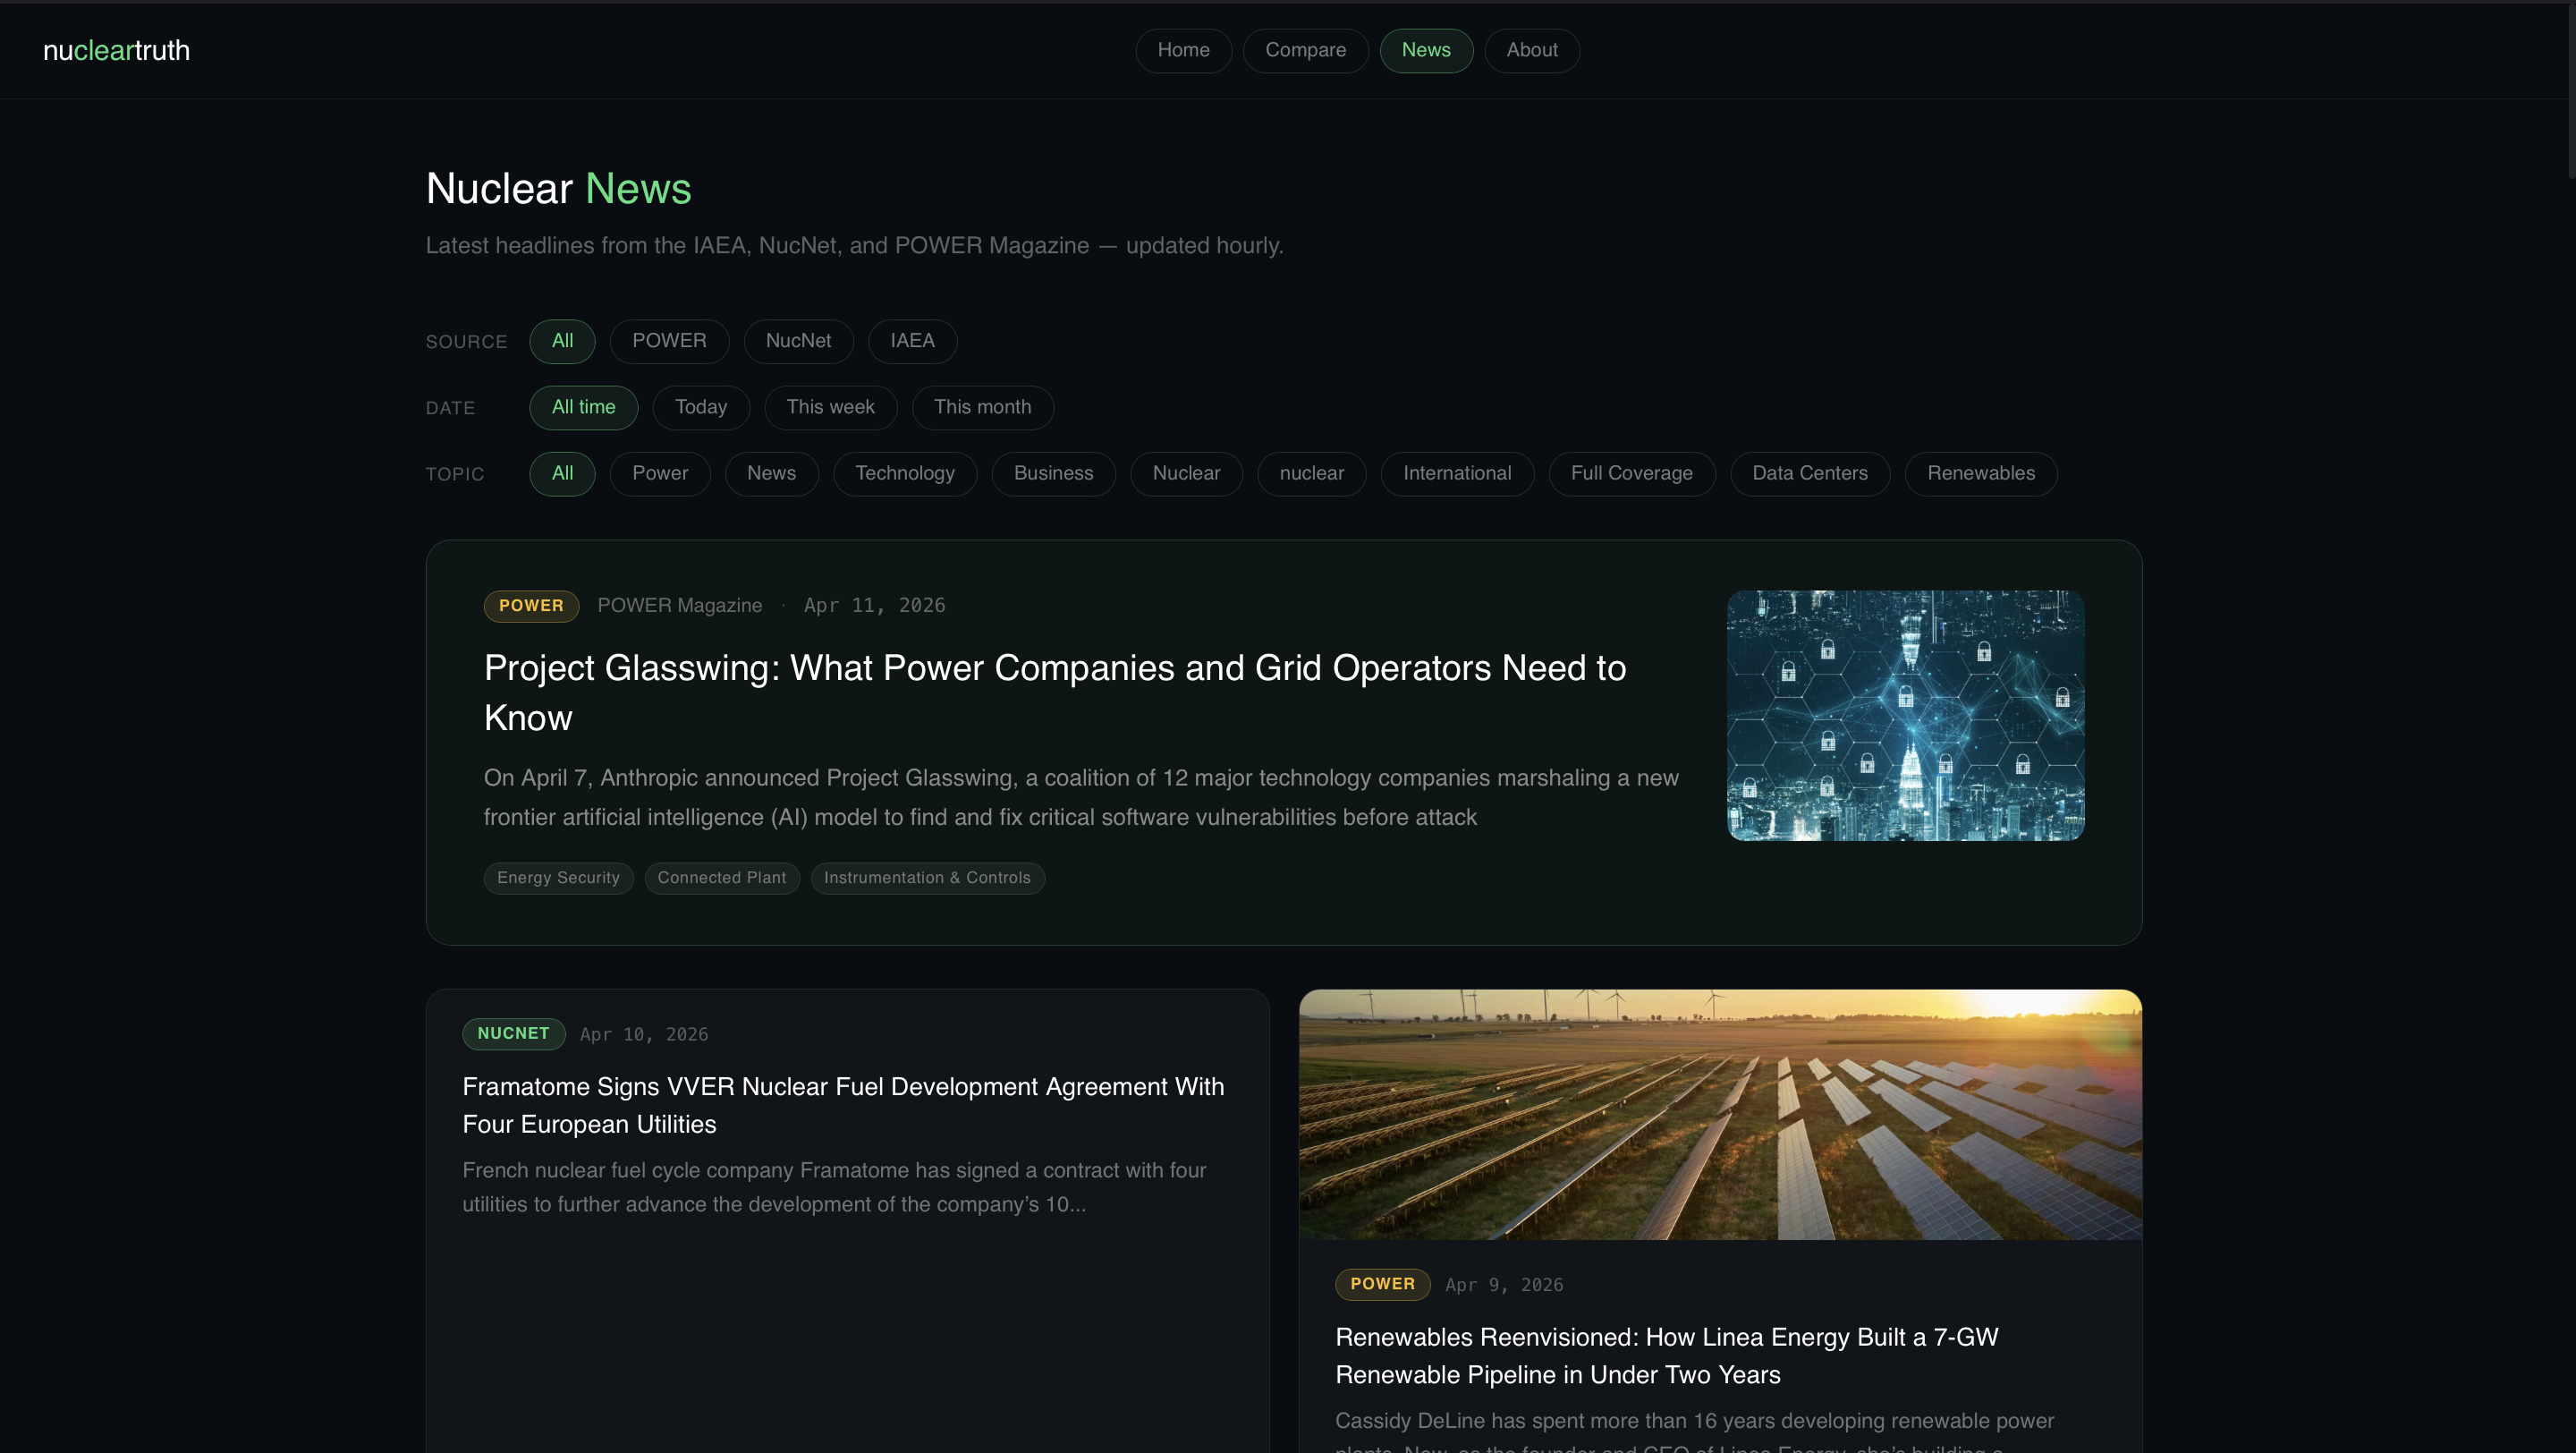
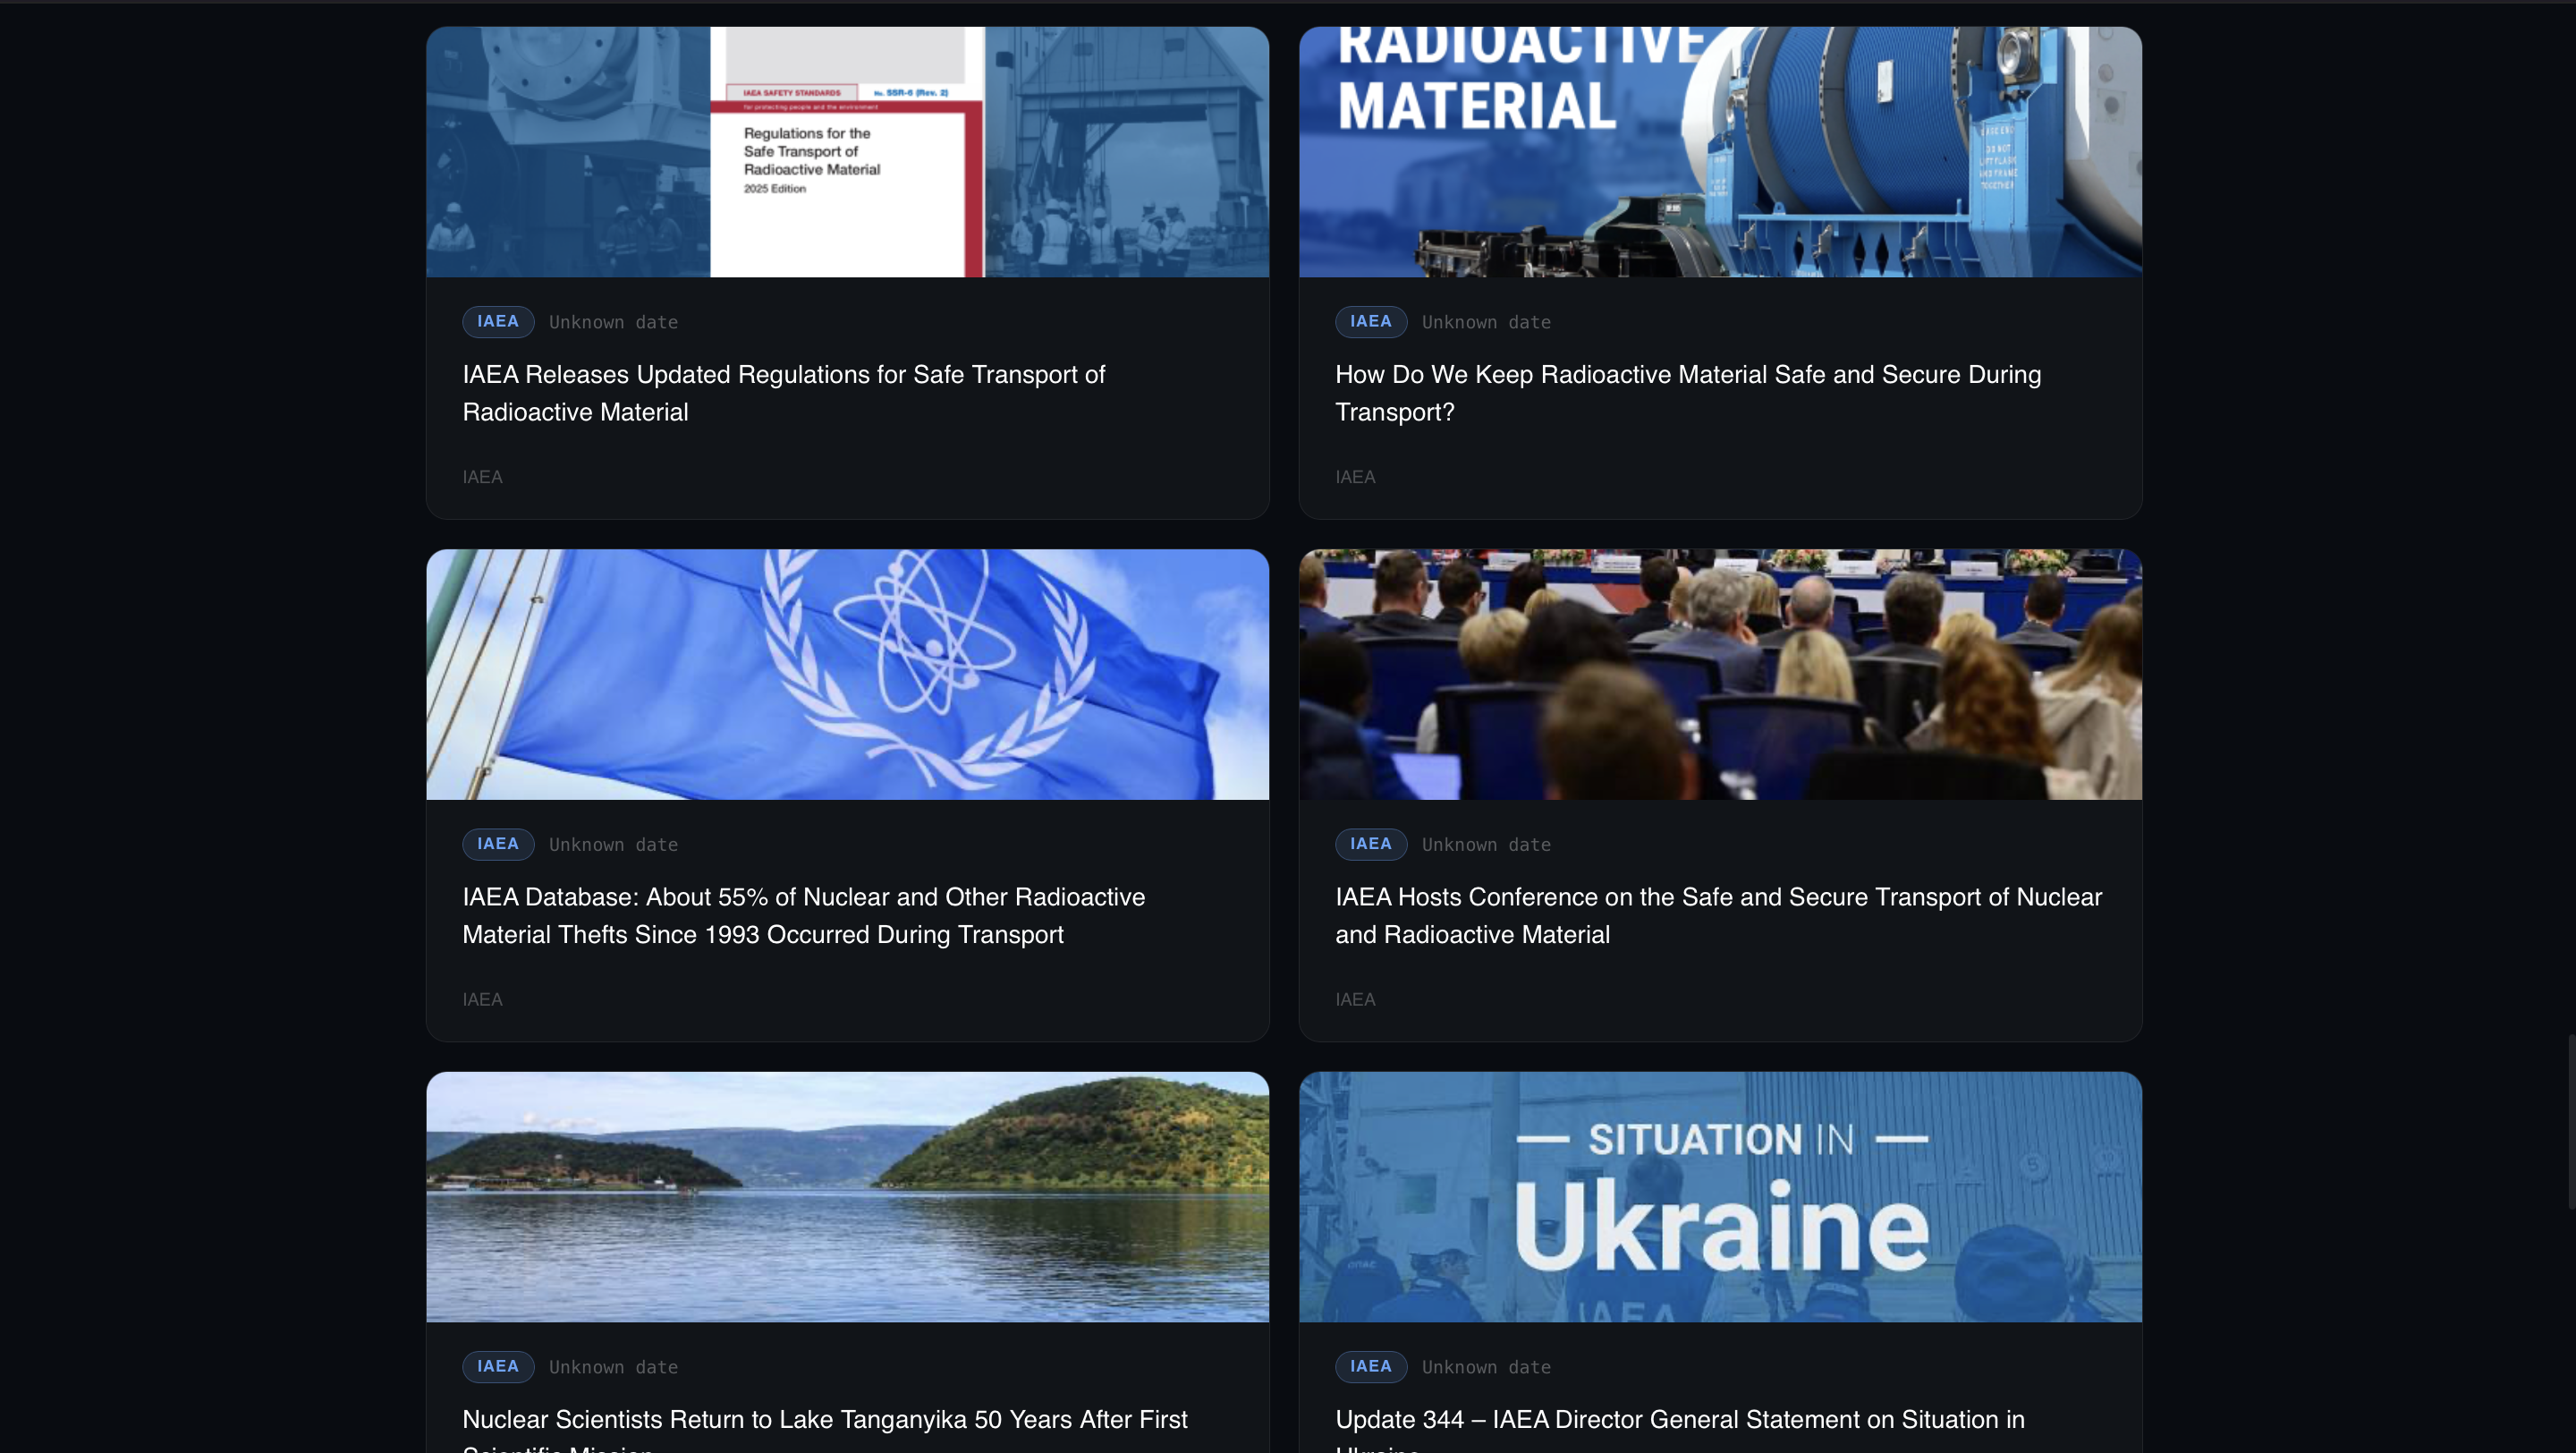
- News — A live feed of nuclear industry news aggregated from IAEA, NucNet, and POWER Magazine RSS feeds, with filtering by source, date, and topic.
- About — The mission, data sources, and the team behind it.
How we built it
We built NuclearTruth as a Next.js 14 application using the App Router with a mix of server and client components:
- 3D Scene — Built with Three.js via
@react-three/fiberand@react-three/drei. The nuclear plant scene includes procedurally generated terrain (usingsimplex-noise), a hyperbolic cooling tower, industrial buildings, a dynamic smoke/steam particle system, and post-processing effects (bloom, vignette) via@react-three/postprocessing. The scene auto-rotates and supports full orbit controls. - Interactive Reactor — A custom SVG reactor that splits open with a CSS animation, revealing labeled internal components (fuel rods, control rods, coolant, core) that expand on hover and display educational info on click.
- Data Pipeline — Server-side RSS parsing with
rss-parserfor the News page, with image extraction from enclosure tags and HTML content. Real-time carbon intensity data from the ElectricityMaps API. - Styling — Tailwind CSS v3 with a custom dark theme, CSS variables for consistent color tokens, and Google Fonts (DM Sans / DM Mono) via
next/font.
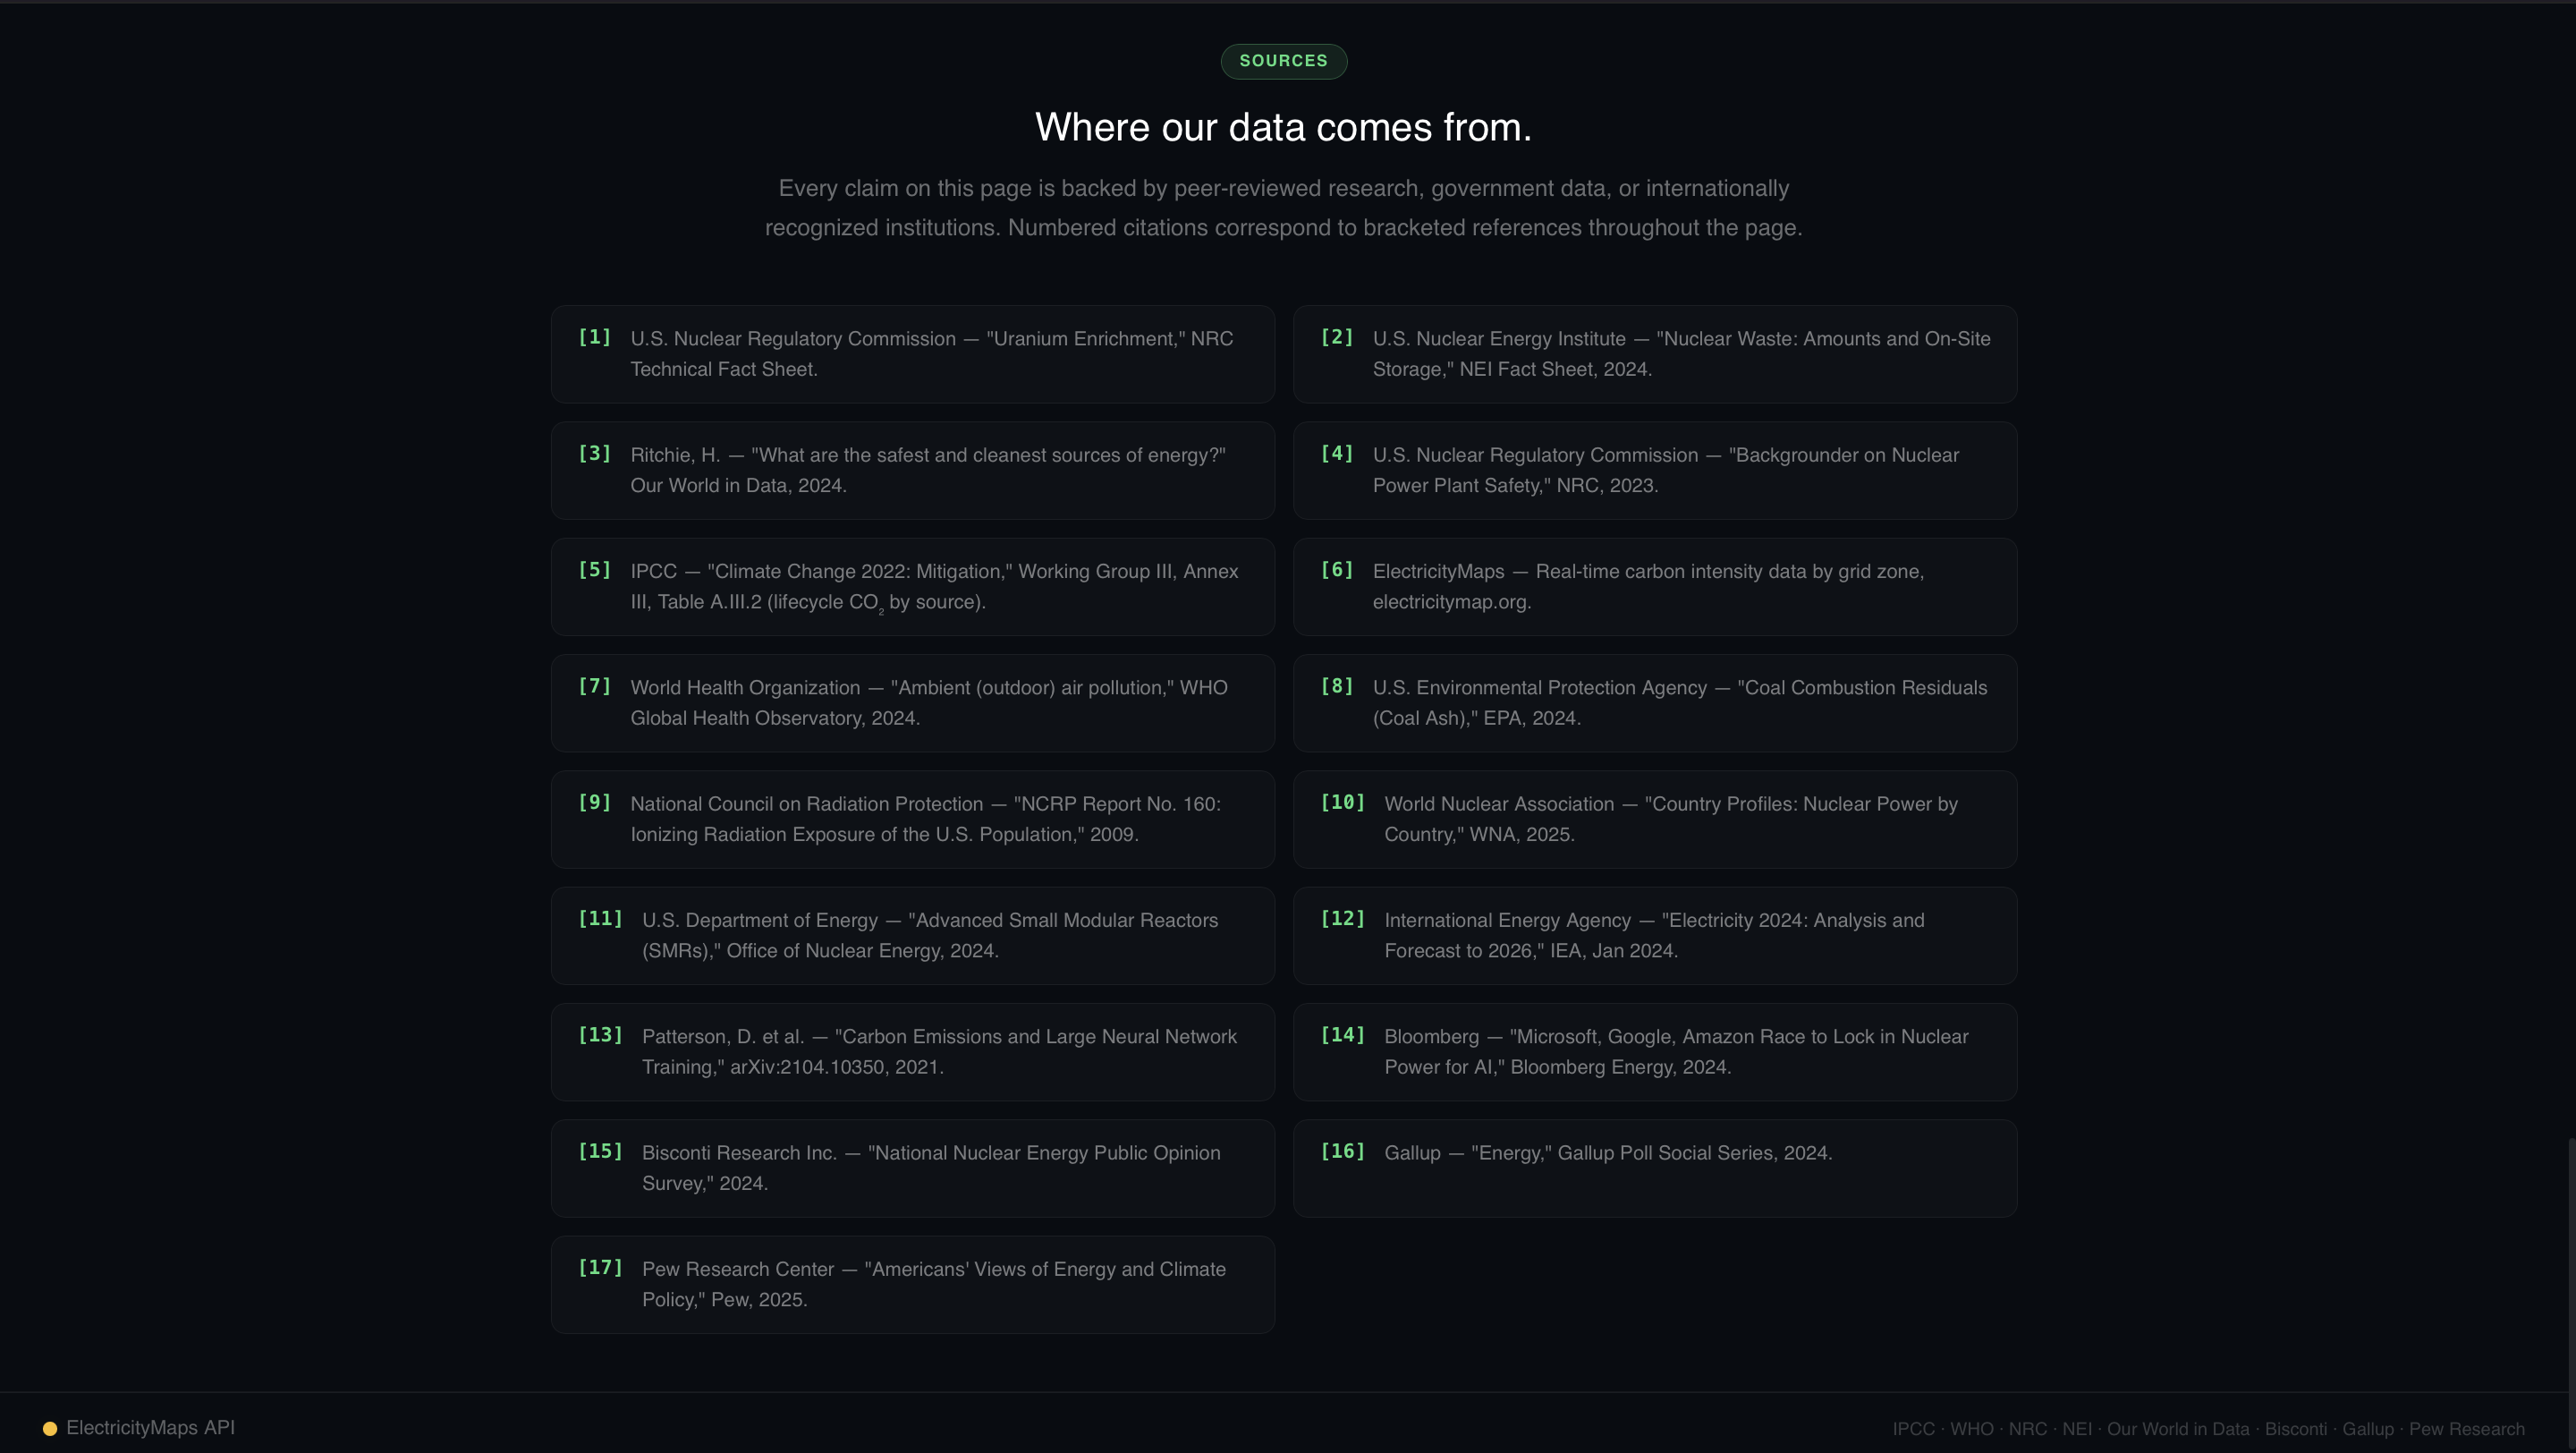
The energy comparison data — CO₂ per kWh by source, deaths per TWh, waste volume, capacity factors — is drawn from Our World in Data, the U.S. Nuclear Regulatory Commission, the Nuclear Energy Institute, and the World Health Organization.
Challenges we faced
- Next.js 15 / React 19 instability — We initially scaffolded with Next.js 15 and hit persistent dev-mode RSC hydration bugs (
enqueueModel is not a function,frame.join is not a function) that were framework-level issues. We had to downgrade the entire stack to Next.js 14.2 + React 18 + Tailwind v3, including rewriting config files and CSS imports. - RSS feed reliability — World Nuclear News turned out to return HTML instead of valid RSS XML. We had to discover and validate alternative feeds (NucNet, POWER Magazine) at runtime, and add defensive date parsing after the IAEA feed crashed the app with invalid
pubDatestrings. - SVG rendering order — The clickable reactor labels were rendering behind the reactor body because SVG paints elements in document order. We had to restructure the entire SVG to ensure interactive elements rendered last.
- 3D pointer events — The original raycasting approach for the 3D scene used per-frame raycasts and a global
window.addEventListener("click"), which meant hover and click states fired even when the user wasn't interacting with the 3D objects. We replaced this with R3F's nativeonPointerOver/onPointerOut/onClickevents for accurate hit detection.
What we learned
- The Electricity Maps API free tier is limited to one zone and latest-only data — not enough for multi-country historical comparisons. We learned to combine multiple free data sources (OWID, RSS, curated statistics) to build a complete picture.
- Server components vs. client components in Next.js require careful architectural decisions — RSS fetching happens server-side with
revalidate, while filtering and interactivity happen client-side withuseState/useMemo. - Building an educational tool means the UX has to earn attention. We spent significant time on scroll flow, visual hierarchy, and progressive disclosure (stats at a glance → interactive exploration → deep-dive paragraphs) so the content invites users forward rather than overwhelming them.
What's next
- Real-time ElectricityMaps integration for live grid carbon intensity on the Compare page
- Individual reactor profiles with technical specs and operational history
- Expanded 3D models (SMRs, BWRs) with guided walkthroughs
- Localization to reach non-English-speaking audiences where nuclear misconceptions are highest
Built with
Next.js · React · Three.js · React Three Fiber · Tailwind CSS · rss-parser · simplex-noise · ElectricityMaps API · Our World in Data
Built at
MorganHacks 2026 — by Charles, Tahj, Faris, and Maxwell.


Log in or sign up for Devpost to join the conversation.