-
-

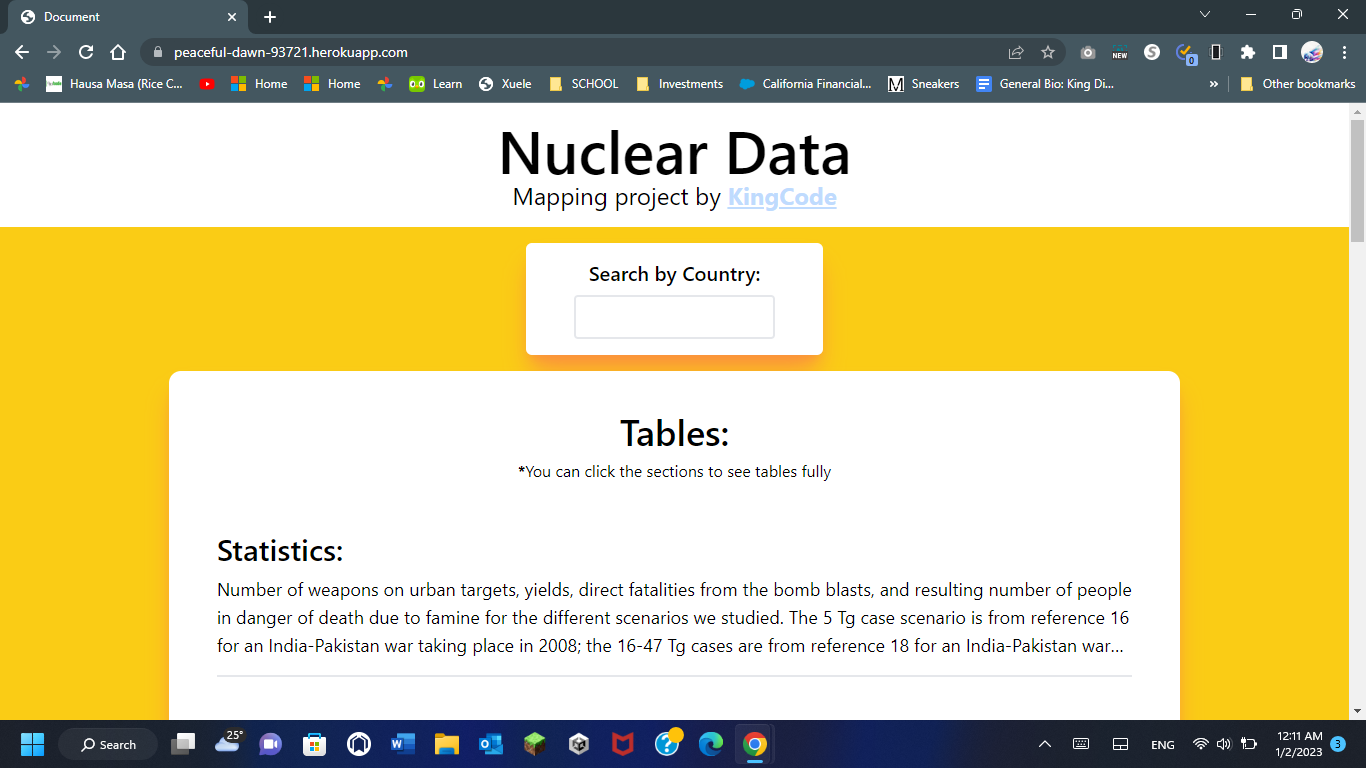
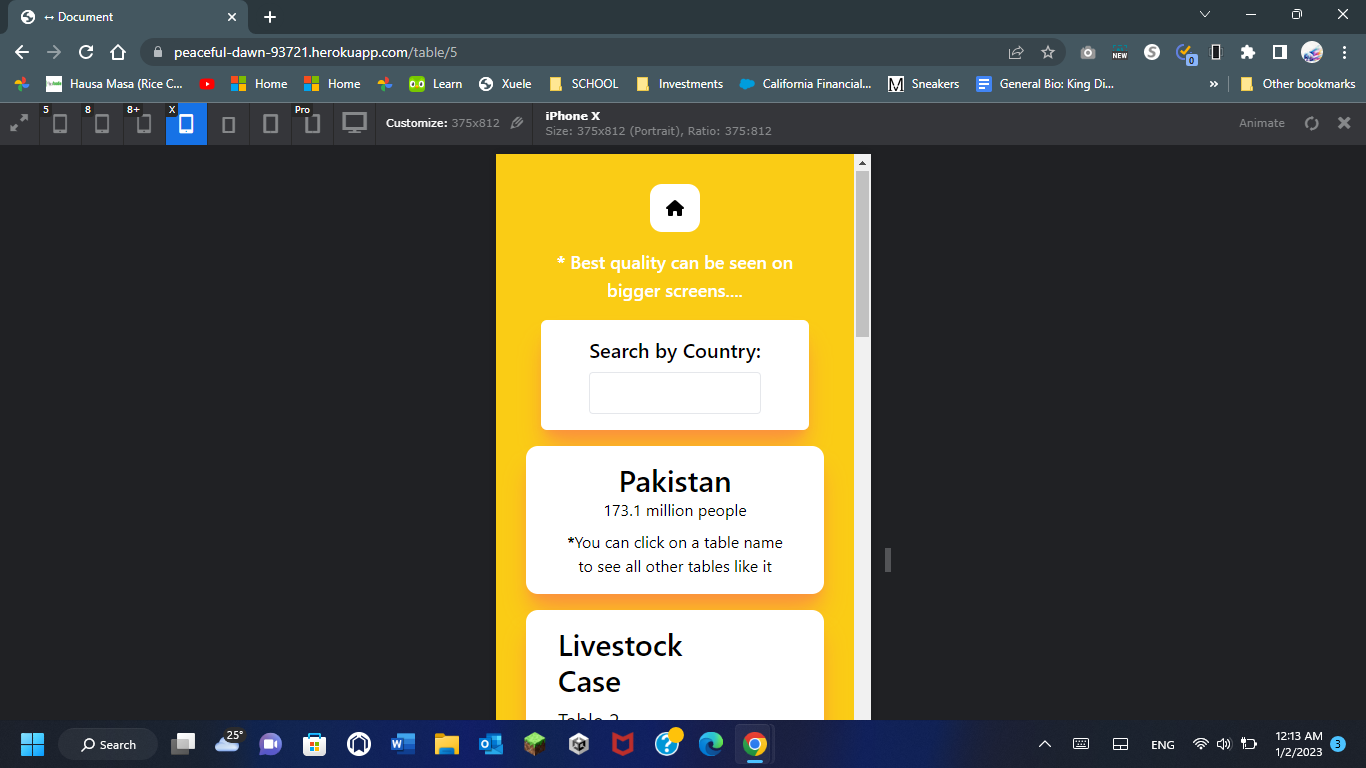
Home Page
-
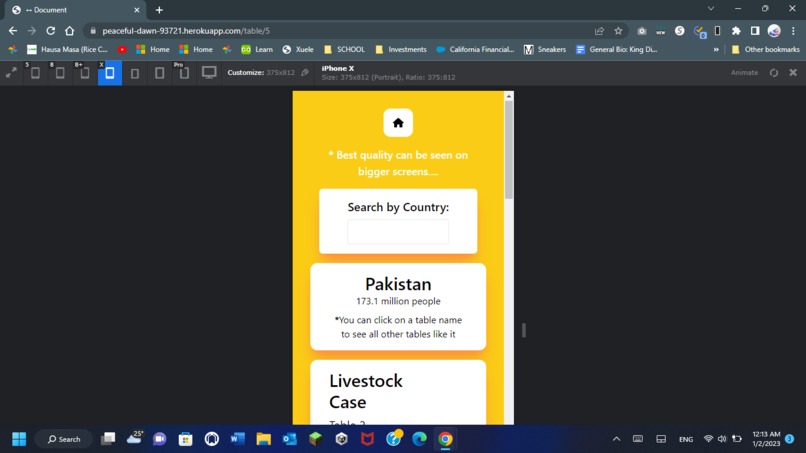
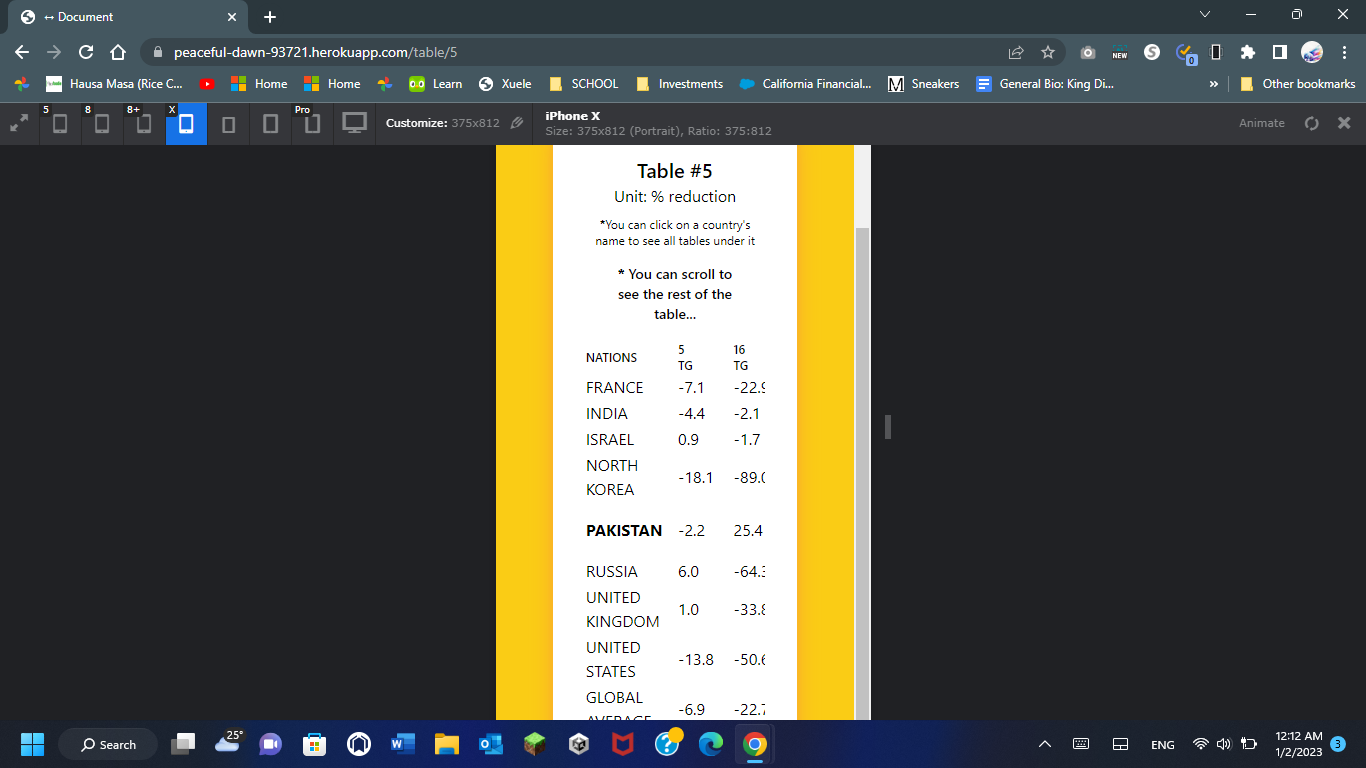
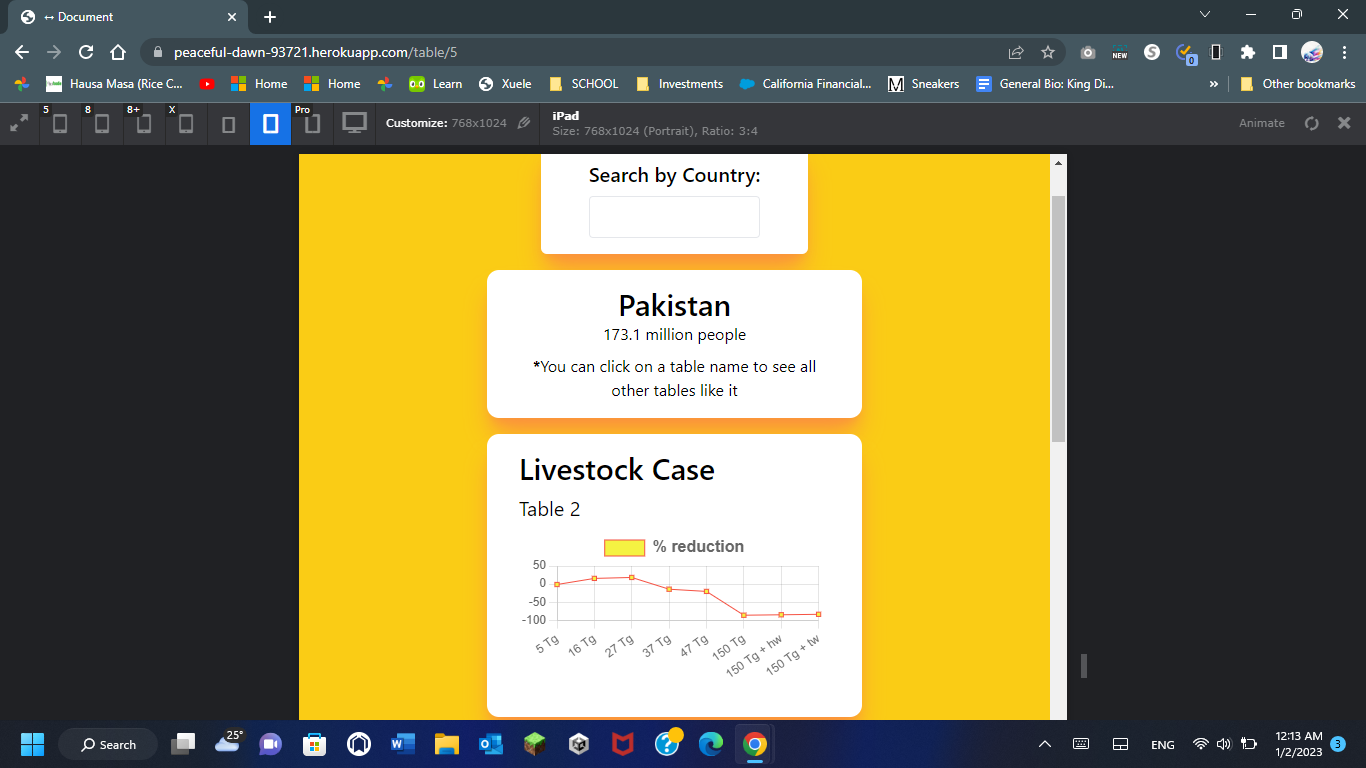
Responsive Design Table on Small Phone
-
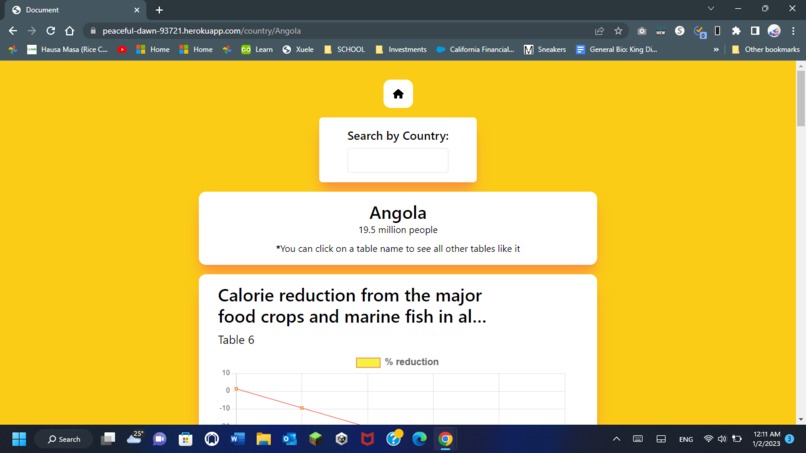
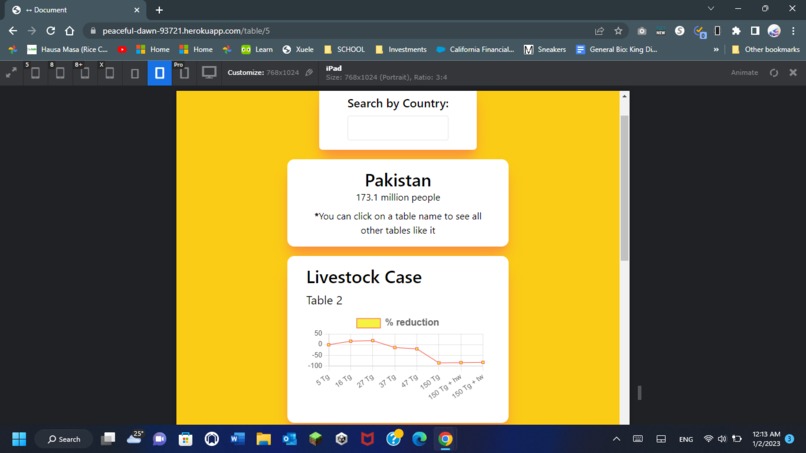
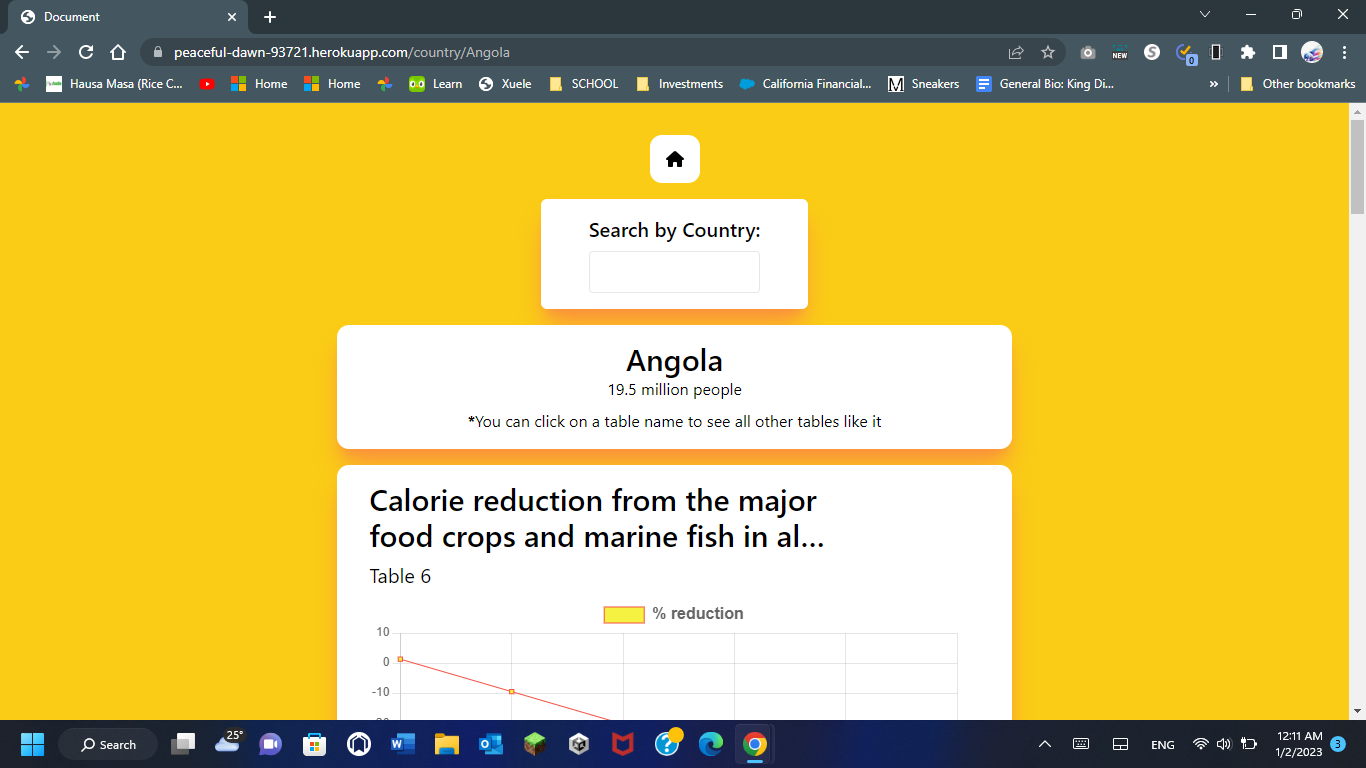
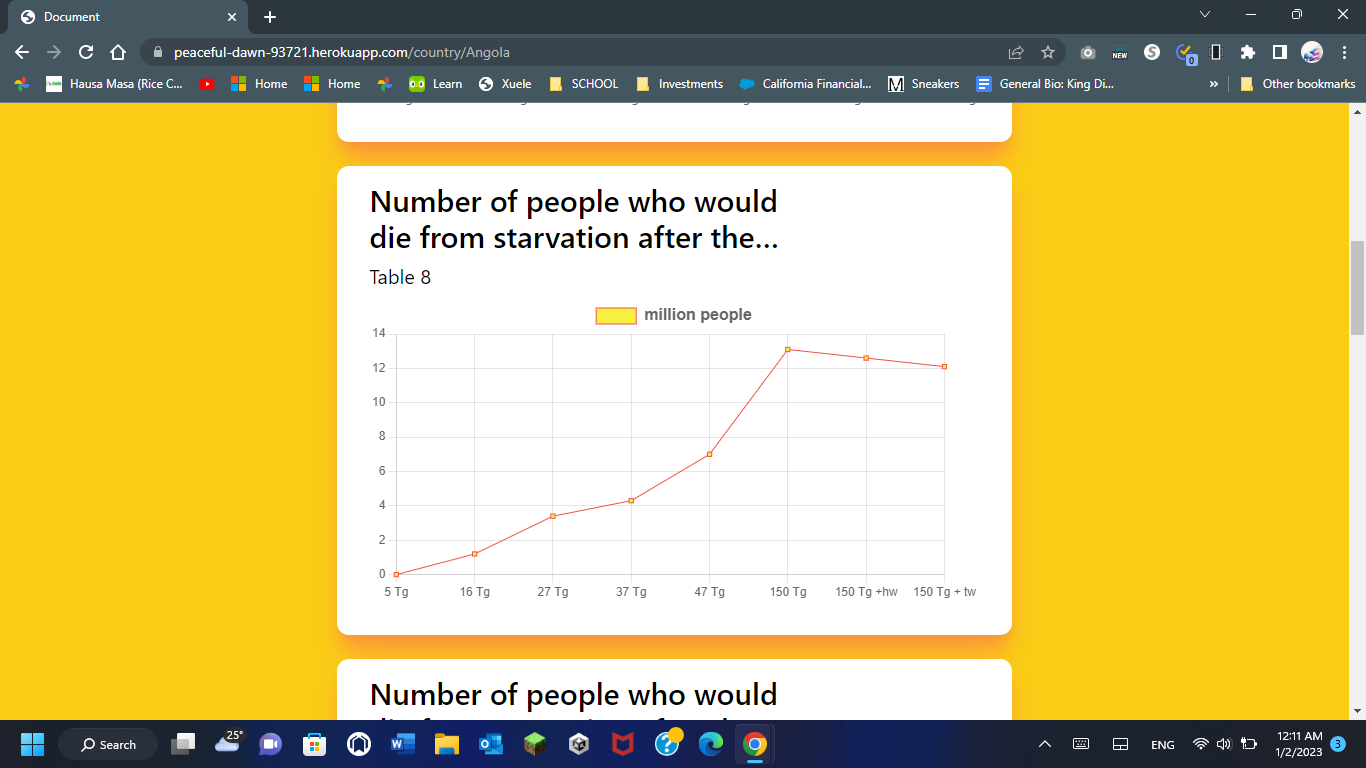
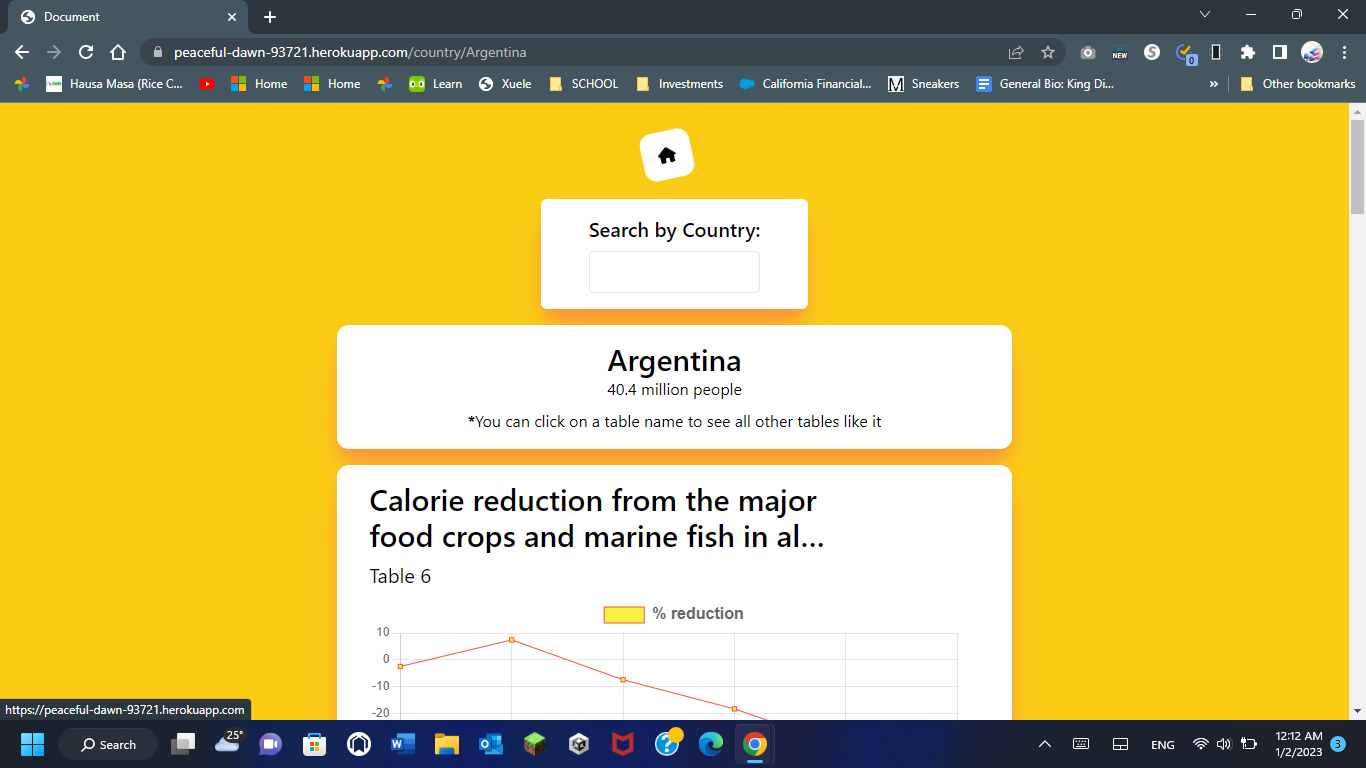
Country Page
-
Responsive Design Small Phone
-
Responsive Design Country Page
-
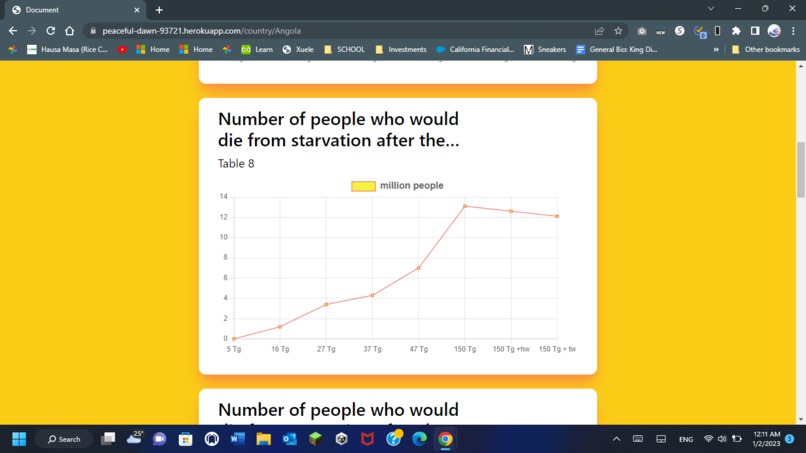
Example Country Data
-
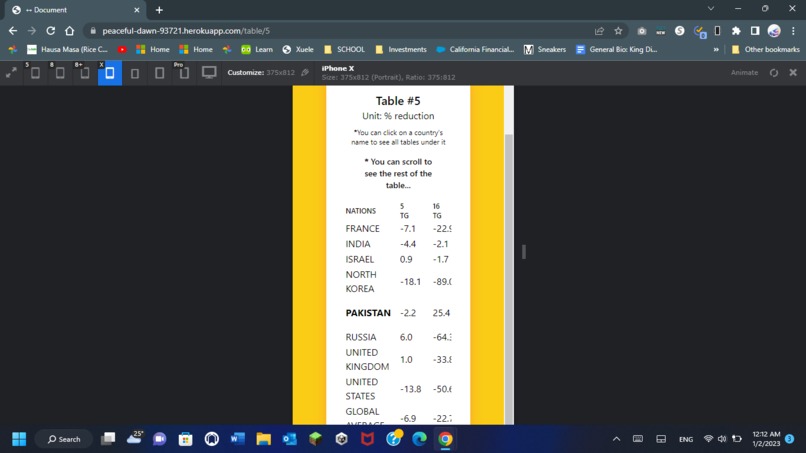
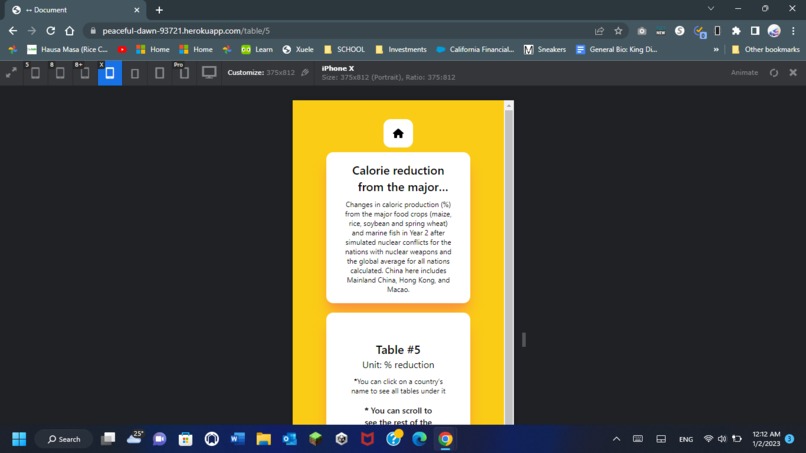
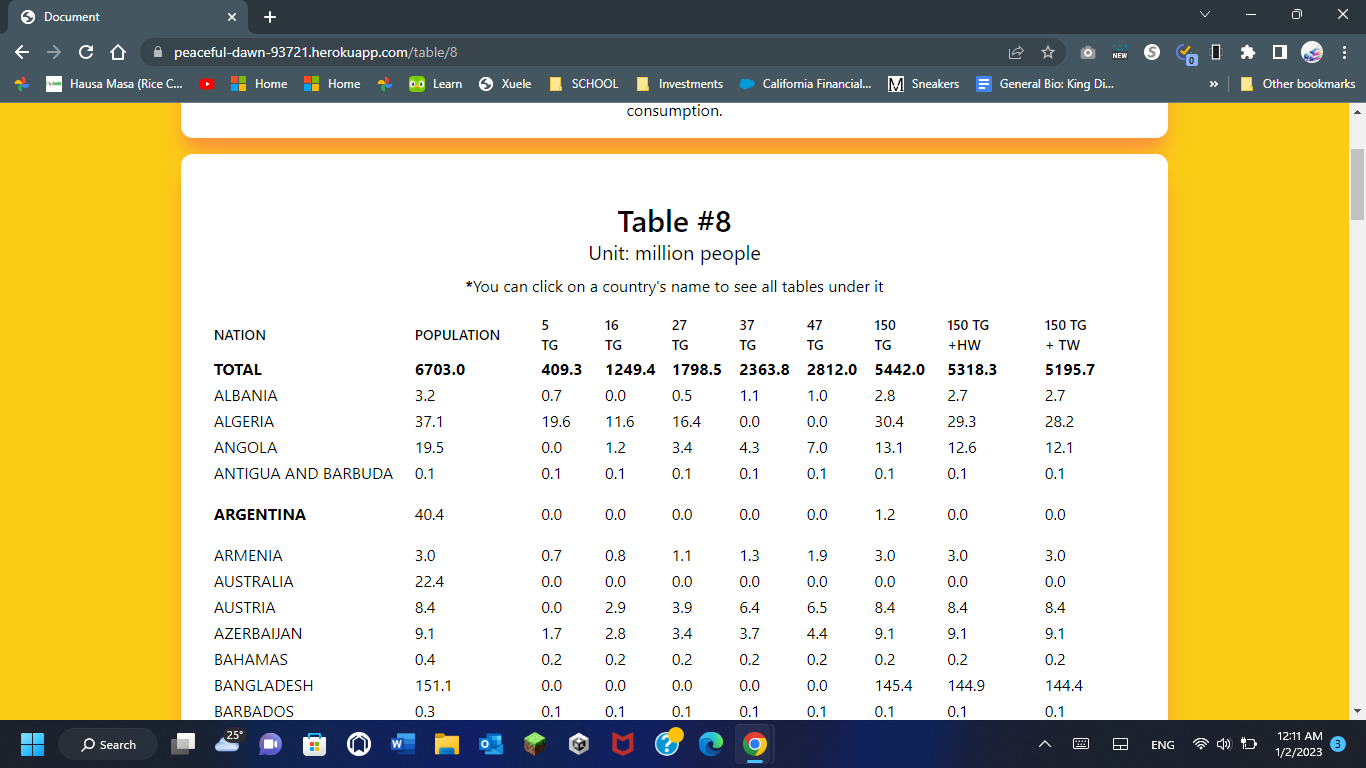
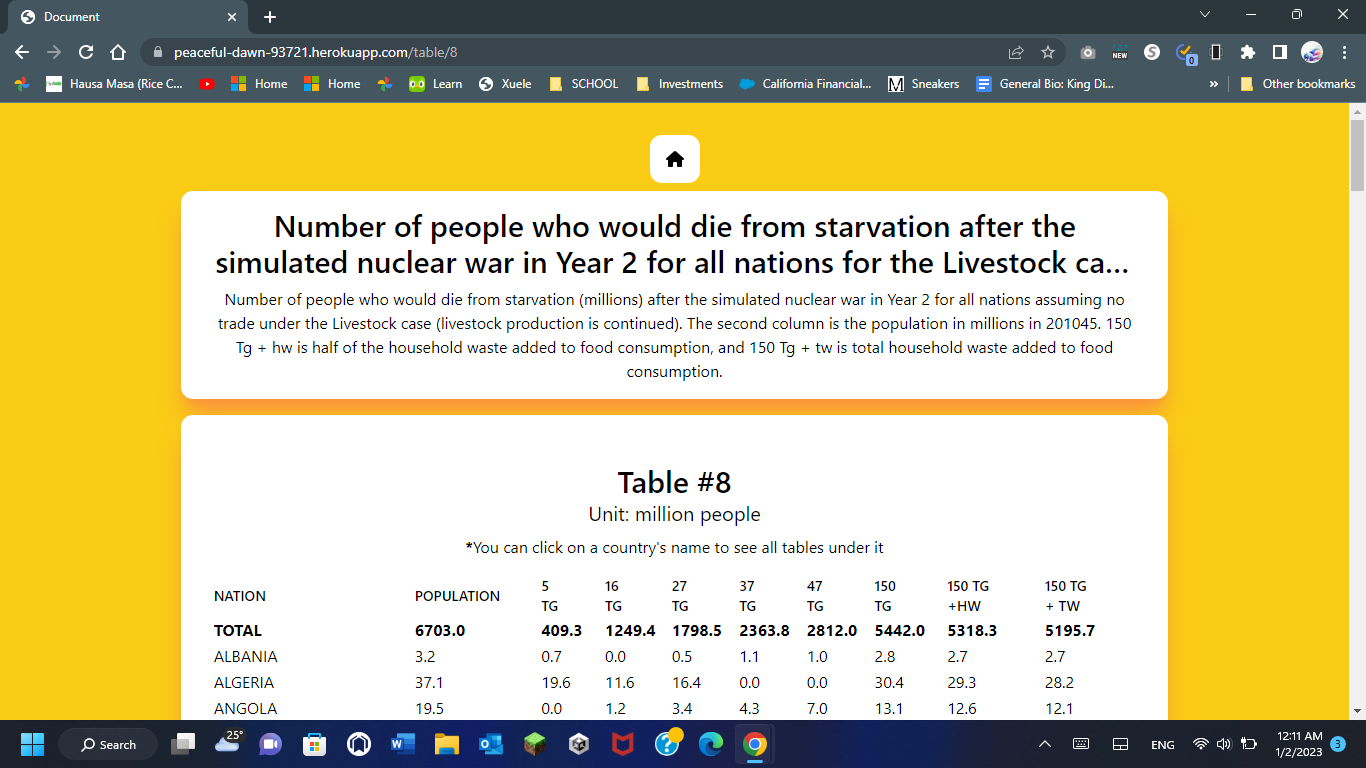
Table
-
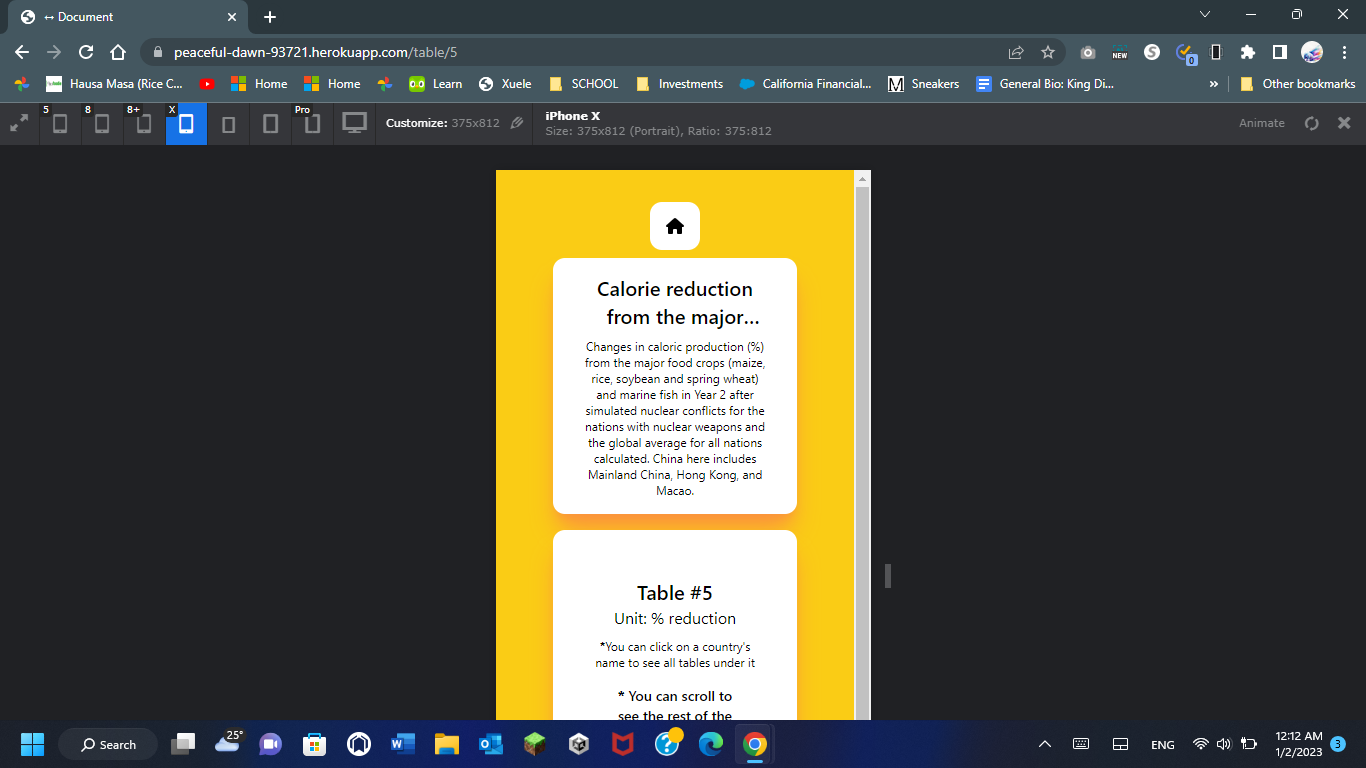
Responsive Design Country Page Table
-
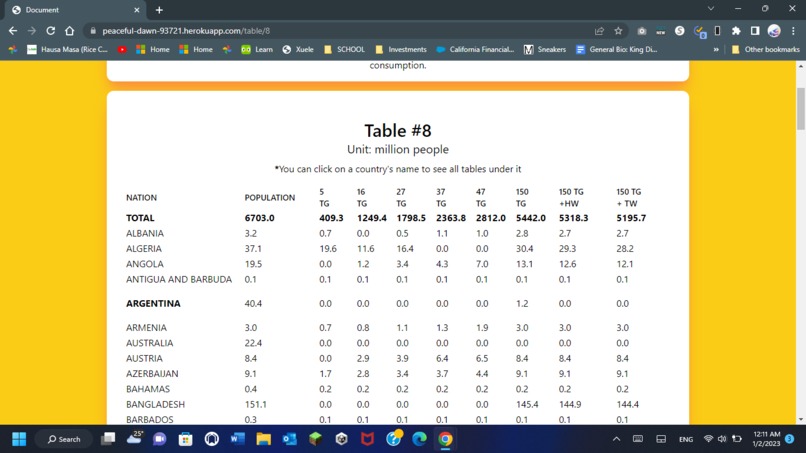
Table Data
-

Secondary Country Page
-

Table

Inspiration
What inspired me to finish the project wasn't only helping a friend but also growing to understand the consequences that nuclear conflicts bear. I'd already known the danger of using nuclear arms, as most do, yet beyond understanding its usage as generally harmful, I didn't truly understand the aftermath of nuclear conflict. After viewing this data, I can now understand how nuclear aftermath ranges from casualties to agricultural failures, facts that help us perceive the threat it poses. Data like this is crucial to understanding the threat nuclear arms pose, and graphing this data helps us see that.
What it does
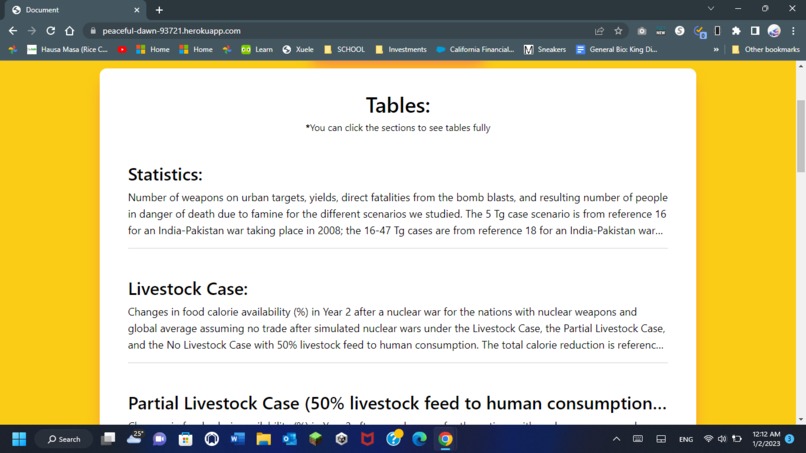
My small web application helps you view tables from the Nature Food article at https://doi.org/10.1038/s43016-022-00573-0. You'll be able to view the information of each table, while also searching up data about specific countries.
How we built it
This was built utilizing node.js to create an express app. The very first thing to do was to parse the information from the two .docx files provided in the docs folder ( which you can see in the Github repo). Using those .docx files and a docx parser package (programs found in the processes folder), I created a JSON file to hold the information from each table (metrics, index, data, etc..) along with a list of all the countries. After that using EJS, I made a file for the three major views: tables, country pages and home.
Accomplishments that we're proud of
A new skill that I learned was how to use docx parser which is the first time I've parsed data other than JSON data from requests. Even more, I think it'll be a useful skill to be able to manipulate files like pdfs, docxs, docs, and more, which are common mediums for displaying information.
What we learned
This was my first hackathon, and though there was no theme, I wanted to use an idea I had been thinking of for some time to do the project. That idea was this Nuclear Mapping project where I worked on graphing nuclear data. Initially, this was inspired by my friend sharing some information with me concerning table data mentioned in "Global food insecurity and famine....from nuclear war soot injection", where she asked if I knew how to graph something like this. After that, I became interested in the project and what the result of nuclear aftermath looked like, so I began working on graphing the data. In an effort to spread awareness of the consequences of nuclear arms usage, I created this application.
What's next for Nuclear Mapping
Next, I'm thinking of being able to map more data related to nuclear aftermath or other environmental hazards or consequences. Doing such would be taking part in trying to aware global communities of the dangers, nuclear conflicts pose.
About Me
King-Diorr Willsun 10th grader, aspiring programmer, likes maps....
Built With
- ejs
- express.js
- naturefood
- node.js
- nuclear-data
- tailwindcss

Log in or sign up for Devpost to join the conversation.