-
-
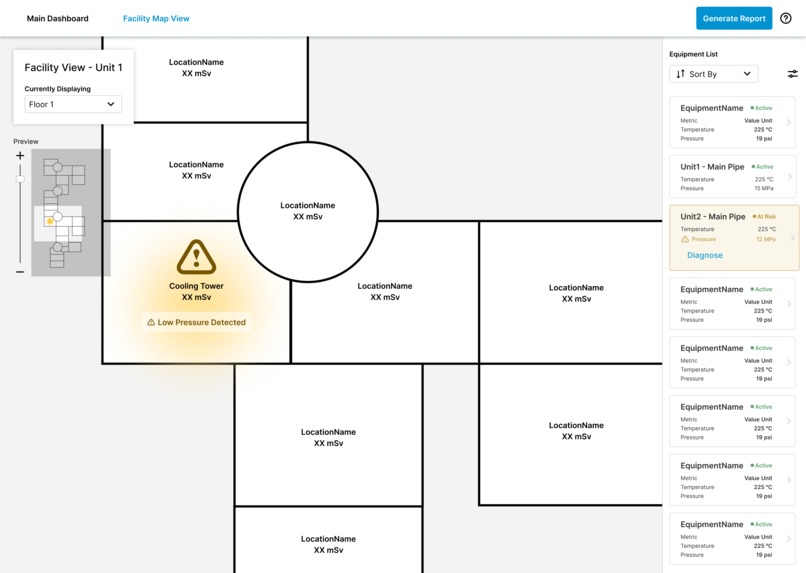
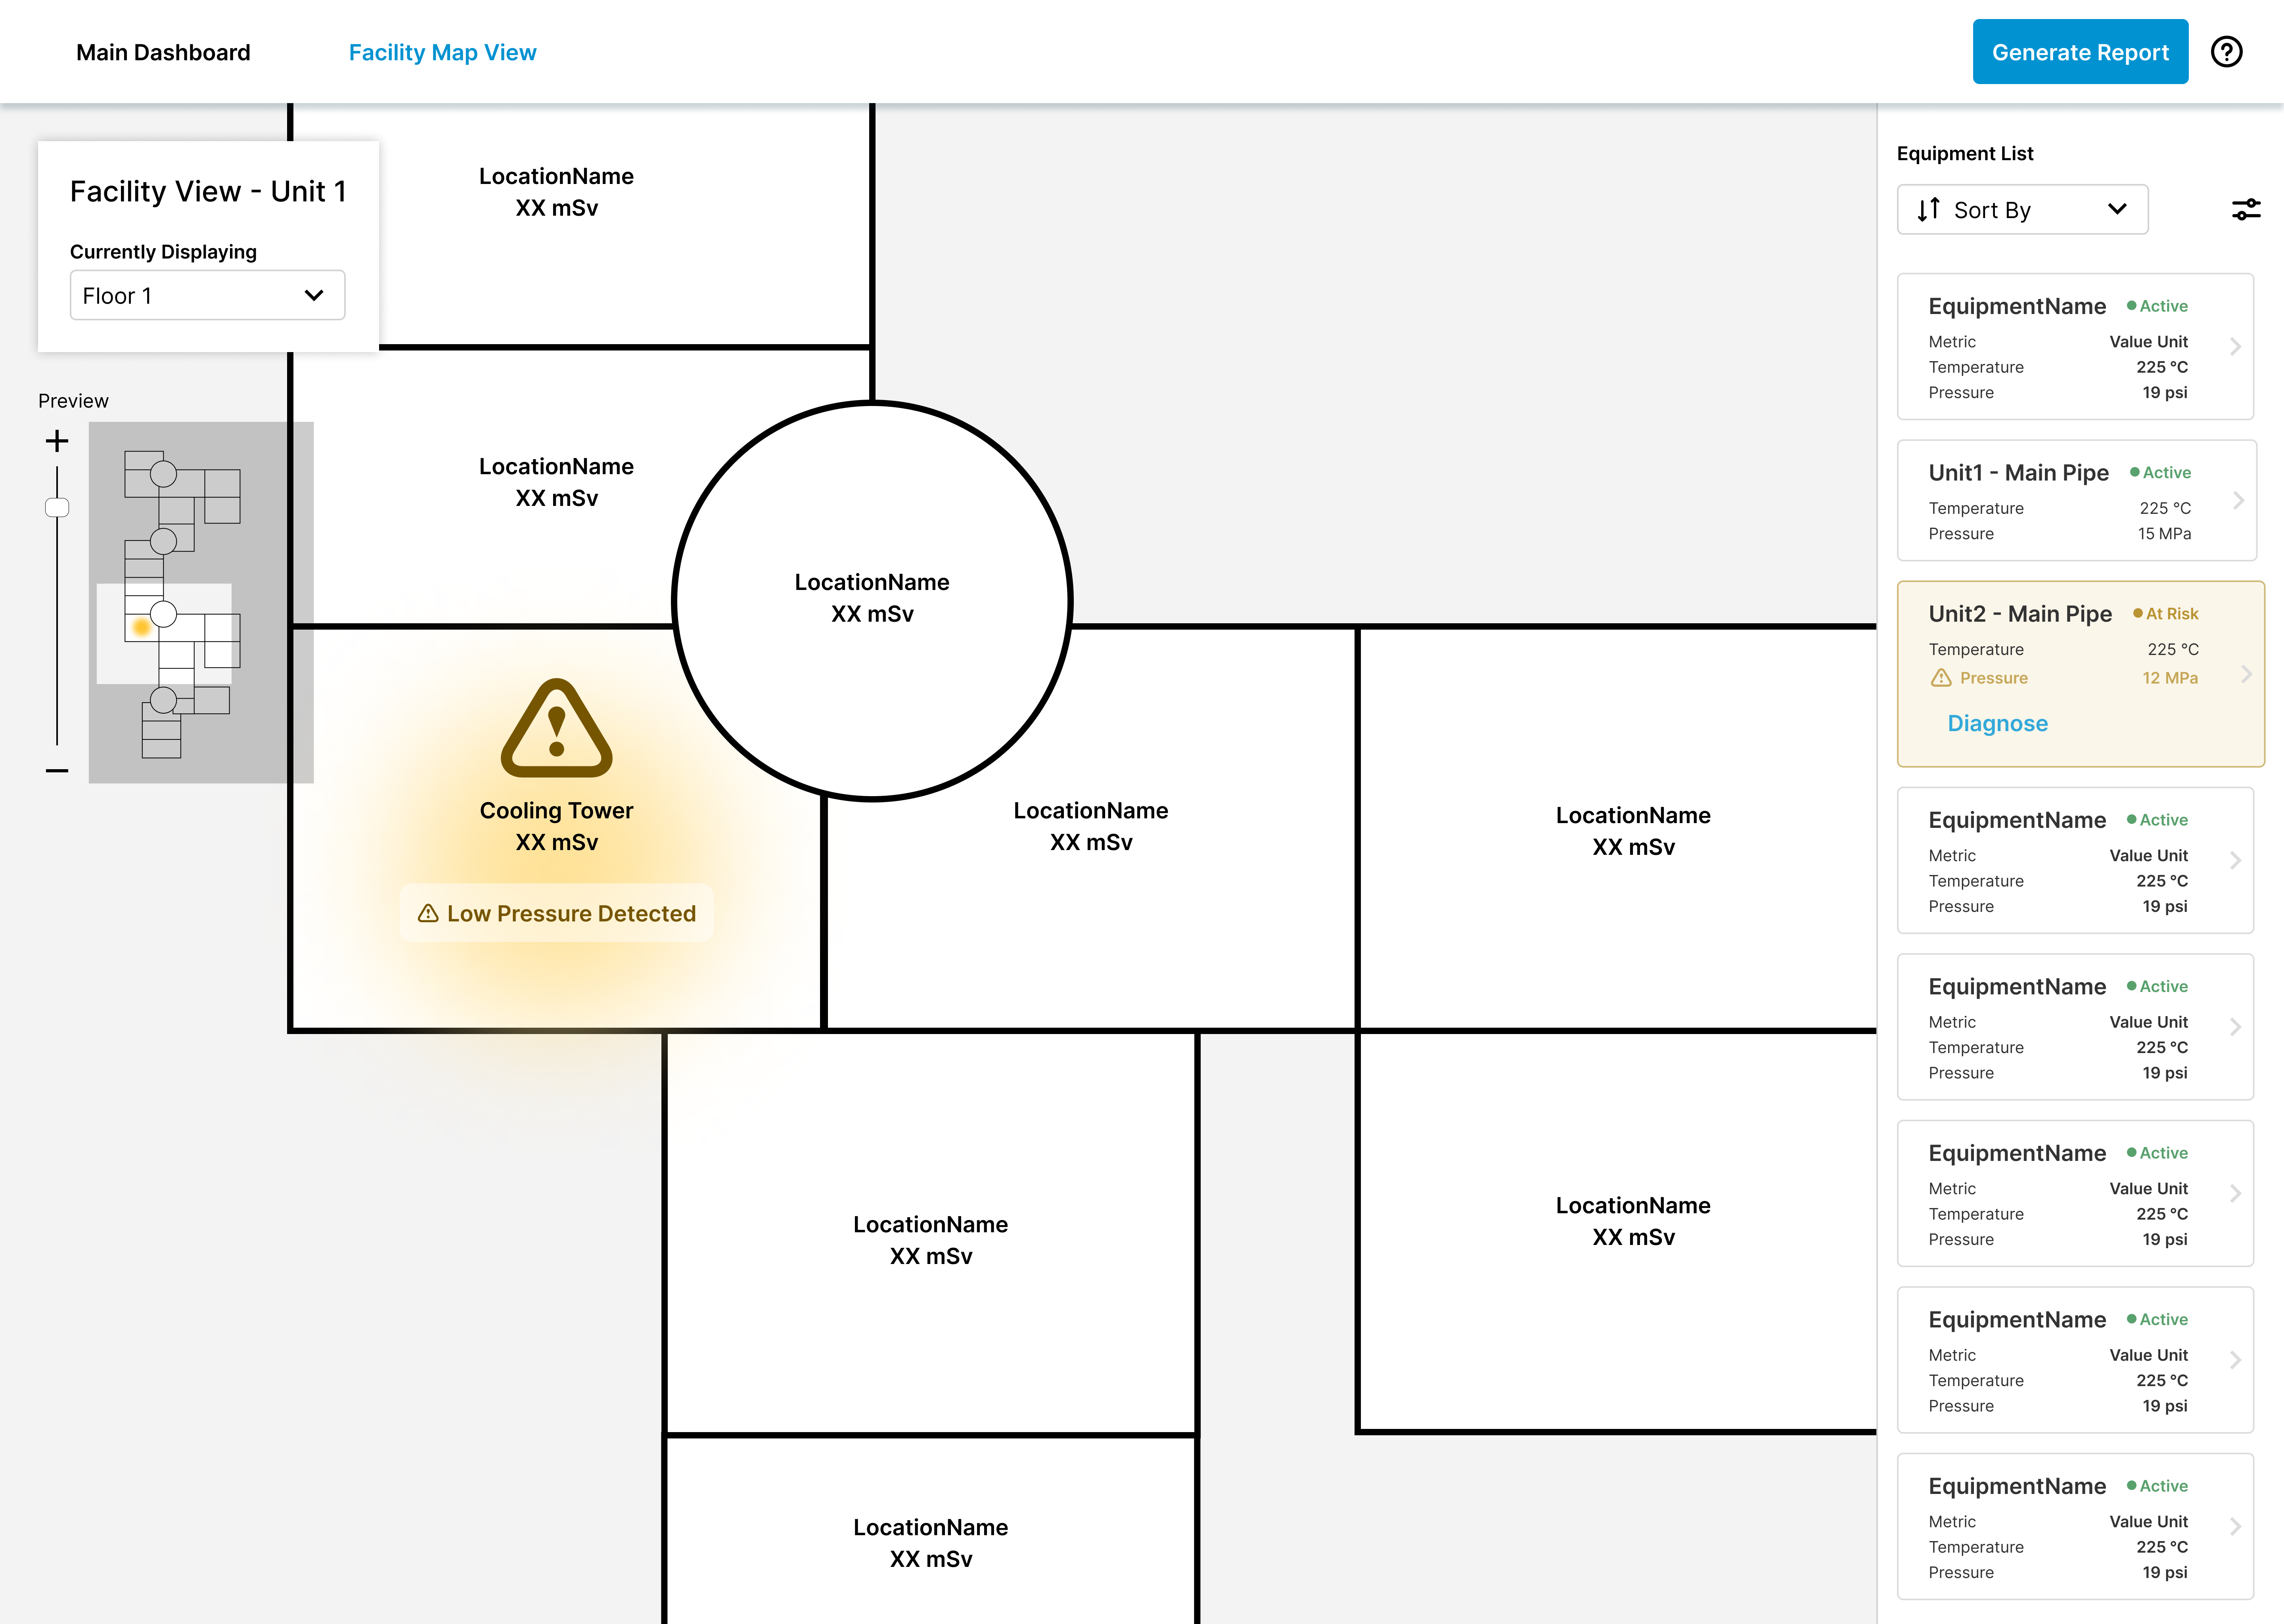
Map View of our prototype with a warning state visible.
Project Description
Nuclear Promise Canada (NPX) challenged us to create a dashboard used to monitor radiation levels across different buildings in a nuclear facility that will provide real-time information to ensure that radiation levels remain within safe limits.
What it does
Our solution is a web application intended for nuclear technicians that presents them with the appropriate information to assess whether the environment is safe by monitoring equipment performance. The dashboard view shows an overview of all the data, metrics, and input from sensors. The map view allows the technician to browse the facility visually by region. Warnings are shown on the screen and draw the user's attention. The primary use of this application is to monitor the facility and to generate reports for data analysis and inspection. Technicians have the ability to view and export live data along with data history.
How we built it
The first thing we did was research! Some of our key research questions were as follows:
- What types of buildings are in a nuclear facility?
- What form does the “real-time” information take on? What are some examples? What types of sensors would we be displaying data from?
- Who would be the person interacting with this dashboard? What is their role?
- What could be additional “essential features” for nuclear technicians?
After an unstructured interview with a nuclear consulting co-op student, we learned the following insights:
- Nuclear facilities are generally made up of one enormous building that includes all the equipment (reactor, pipes, electrical equipment) with multiple floors
- Radiation levels are always being monitored, but that is hardly the most important piece of information; the most important piece of information is the reactor temperature, which is heavily monitored (heating up may lead to emergency shutdown)
- Other indicators that are useful would be pipe pressures, coolant pressures, voltage etc. that indicate whether equipment is working correctly
- For context and scaling of the prototype, Bruce A has 4 reactors in one building
We then took to the internet to conduct secondary research to help us further understand the role of a nuclear technician and how a nuclear power plant functions.
We then created a proto-persona of a typical nuclear technician: Craig Ramsay, a 27 y/o new-hire to Bruce Power in Ontario. Craig has undergone all the required training for the role and his concerns are with the volume of information he has to keep track of and needing to know detailed sensor readings. When there is a minor issue, he creates a report for his supervisor. When there is a major issue, he escalates it and instructs his peers on what to do.
Hence, the following are the requirements we decided on for our project
- Must be a desktop application
- Must provide real-time data
- Must provide information on reactor temperatures and pipe pressures
- Must provide information on radiation levels
- Should provide historical data
- Should allow report generation and data export
- Should provide a visual representation in additional to dense data view
- Should integrate with their existing tools and software
- Should not include sensor calibration (out of scope)
We then took to Figma for lofi and midfi prototyping!
Challenges we ran into
Understanding the problem space took us a very long time. Even still, we have a lot of unanswered questions. It was difficult to find public resources on how nuclear plants were laid out and what existing tools we might want to integrate with. As such, we made a lot of assumptions and decided that verification of our assumptions would be under 'next steps'.
The sheer amount of data we would be displaying was also daunting. In addition to having very little understanding of what kinds of sensors are in place, what units they read in, what their sampling rate is, we also had to put all that information on a webpage! As such, we compromised aesthetics for utility in some areas.
Accomplishments that we're proud of
We're quite proud of how the map view turned out! As well as the Figma skills we picked up along the way (aka at 3AM). Although it may not look like much, it took us a long time to put everything together.
What we learned
Lots of things about nuclear and Figma tools! Additionally, we also learned that is it very difficult to design without all the information. Ideally, we would have had a week to interface with experts and properly understand our user needs.
What's next for Nu810?
User testing and interviews for sure. It would be really cool to visit a facility and conduct some observations to really understand nuclear technicians' workflows and where we can come in to fill the gap. Would love to also work with a real-time dataset.
In terms of potential features, looking at sensor calibration and better display of sensor values would be the next steps.
Built With
- figma

Log in or sign up for Devpost to join the conversation.