Inspiration
The main reasons that motivated us to work in this project were to try to improve an existing system while acquire more knowledge when it comes to working with tabular data.
What it does
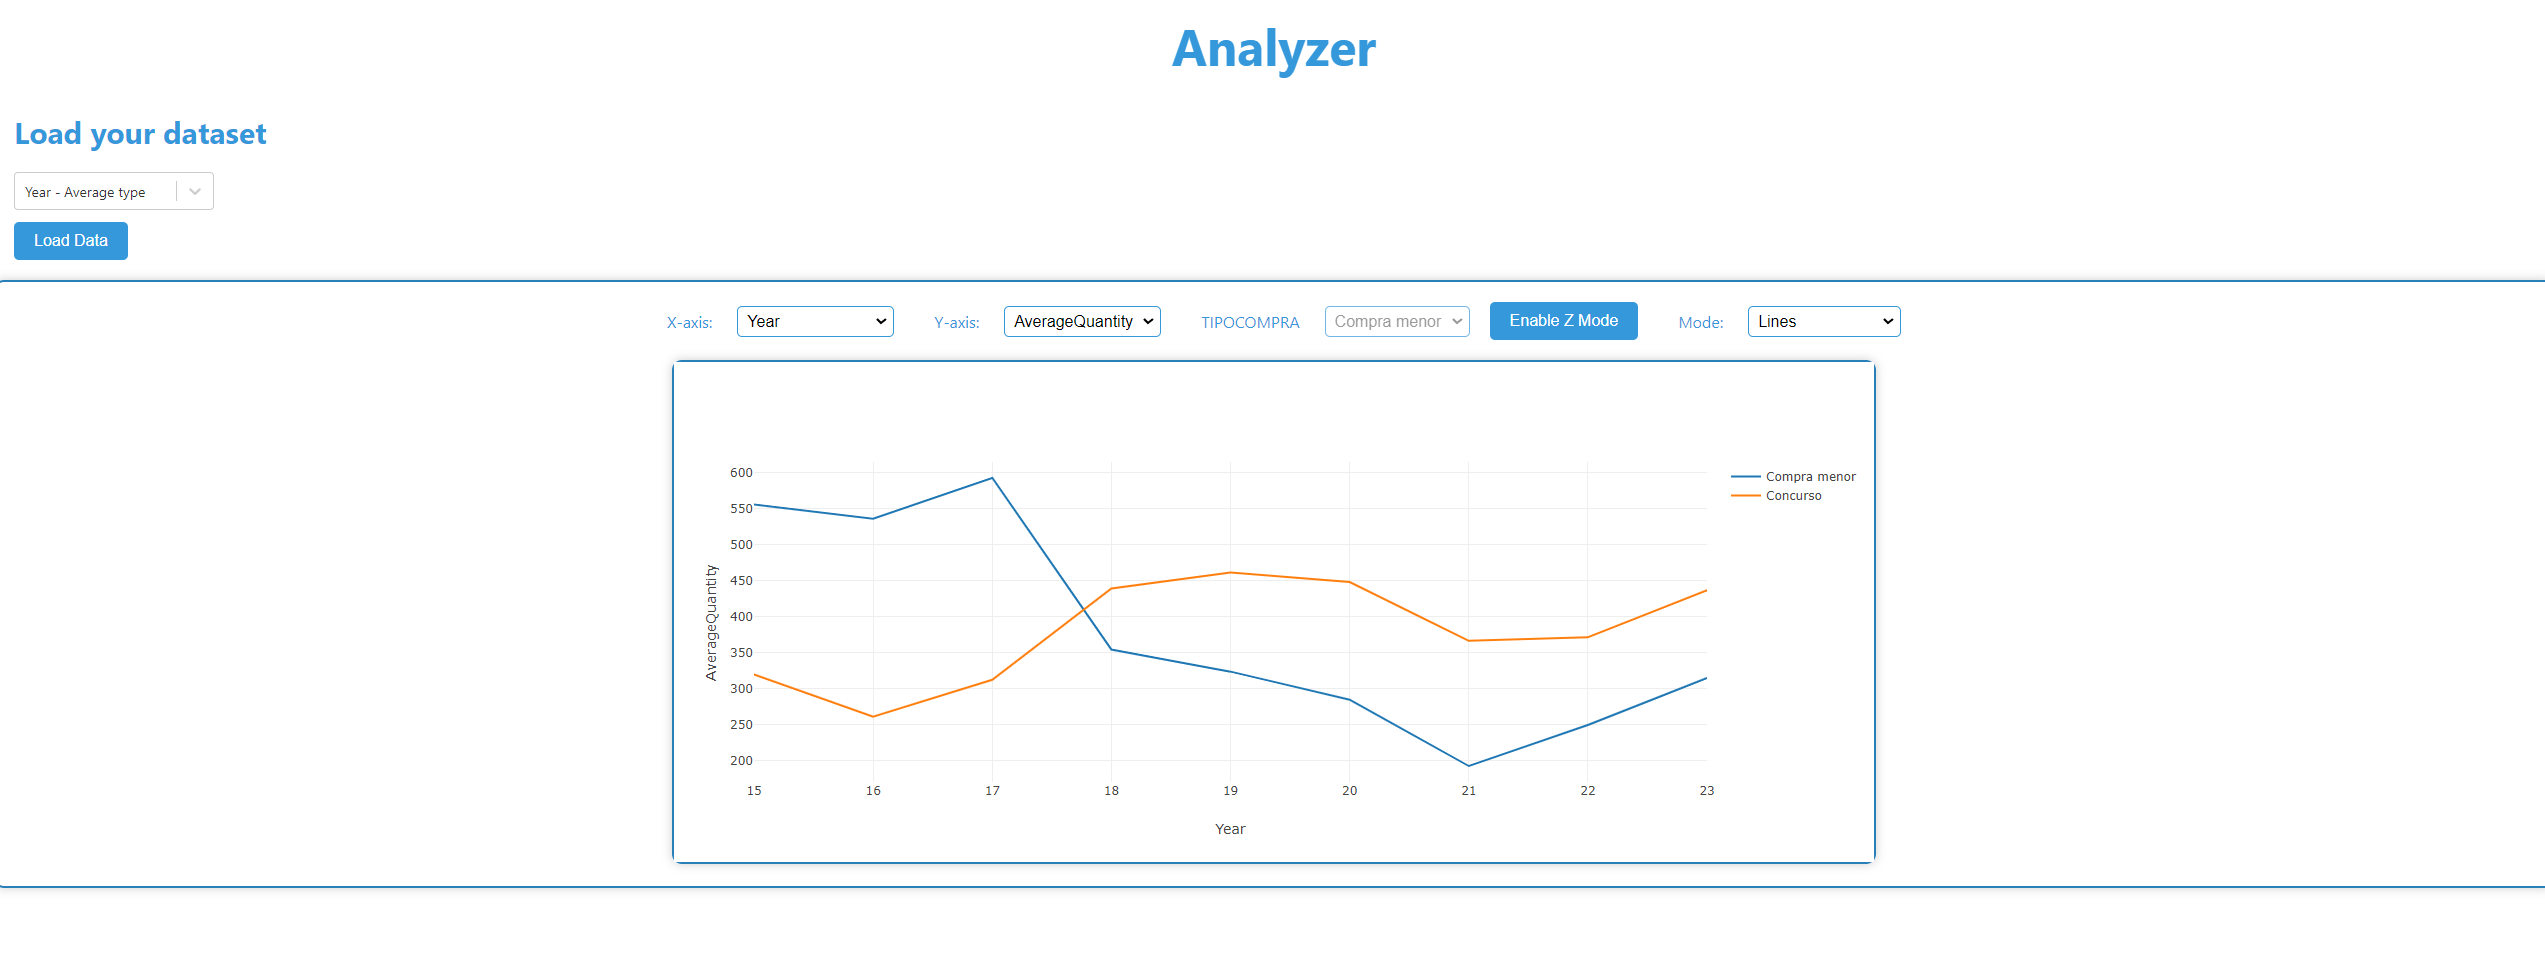
The system allows the user to visualize the data in a comprehensive format that displays the evolution of data overtime and the relationships between different values and variables. Furthermore, an additional script has been added in order to generate predictive models (LSTM) that would allow, if configured properly, to predict which items should be bought.
How we built it
We built this system using a Python backend, that using libraries such as pandas, numpy or keras allows us to treat and group the data.
On the other hand, the frontend has been made using react.
Challenges we ran into
Our main problem during the development of the project was the lack of time, given that data treatment and analysis tends to be an iterative process in which trial and error is used in order to determine what improvements and actions should be taken.
Accomplishments that we're proud of
We consider that we have created a nice interface that eases the visualization and interpretation of data. Additionally, we have made the common grounds required to train a model
What we learned
We have learned how tabular data should be treated and different ways to identify relationships between variables.
What's next for NTTDATA - ToroTeam - Analyzer
In ordrer to continue the project, the train script should be refined and used to generate a predictive model that is able to properly determine what next purchases should be done given the previous ones. It would also be positive to include more graphics to visualize


Log in or sign up for Devpost to join the conversation.