-
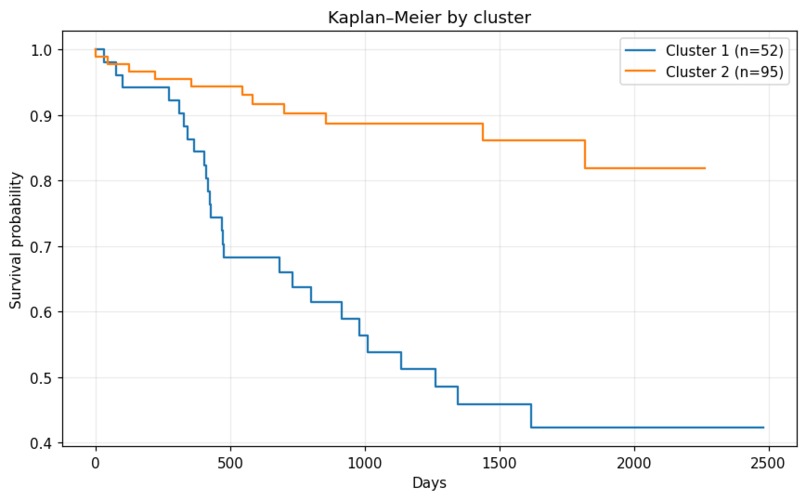
Kaplan–Meier by cluster
-
web1
-
web2
-
web3
-
web4

Inspiration
Endometrial cancer is one of the most common gynecologic malignancies, yet prognosis prediction often relies solely on traditional staging systems (like FIGO). We were inspired by the potential of Precision Medicine: every patient is unique, and their survival probability depends on a complex interaction of variables (age, biomarkers like CA125, histology, and genetics).
We wanted to move beyond static statistics and build a dynamic tool that uses Unsupervised Machine Learning to discover hidden patient "phenotypes" and Survival Analysis to provide personalized risk assessments over time. Our goal was to give clinicians a powerful "second opinion" powered by data.
What it does
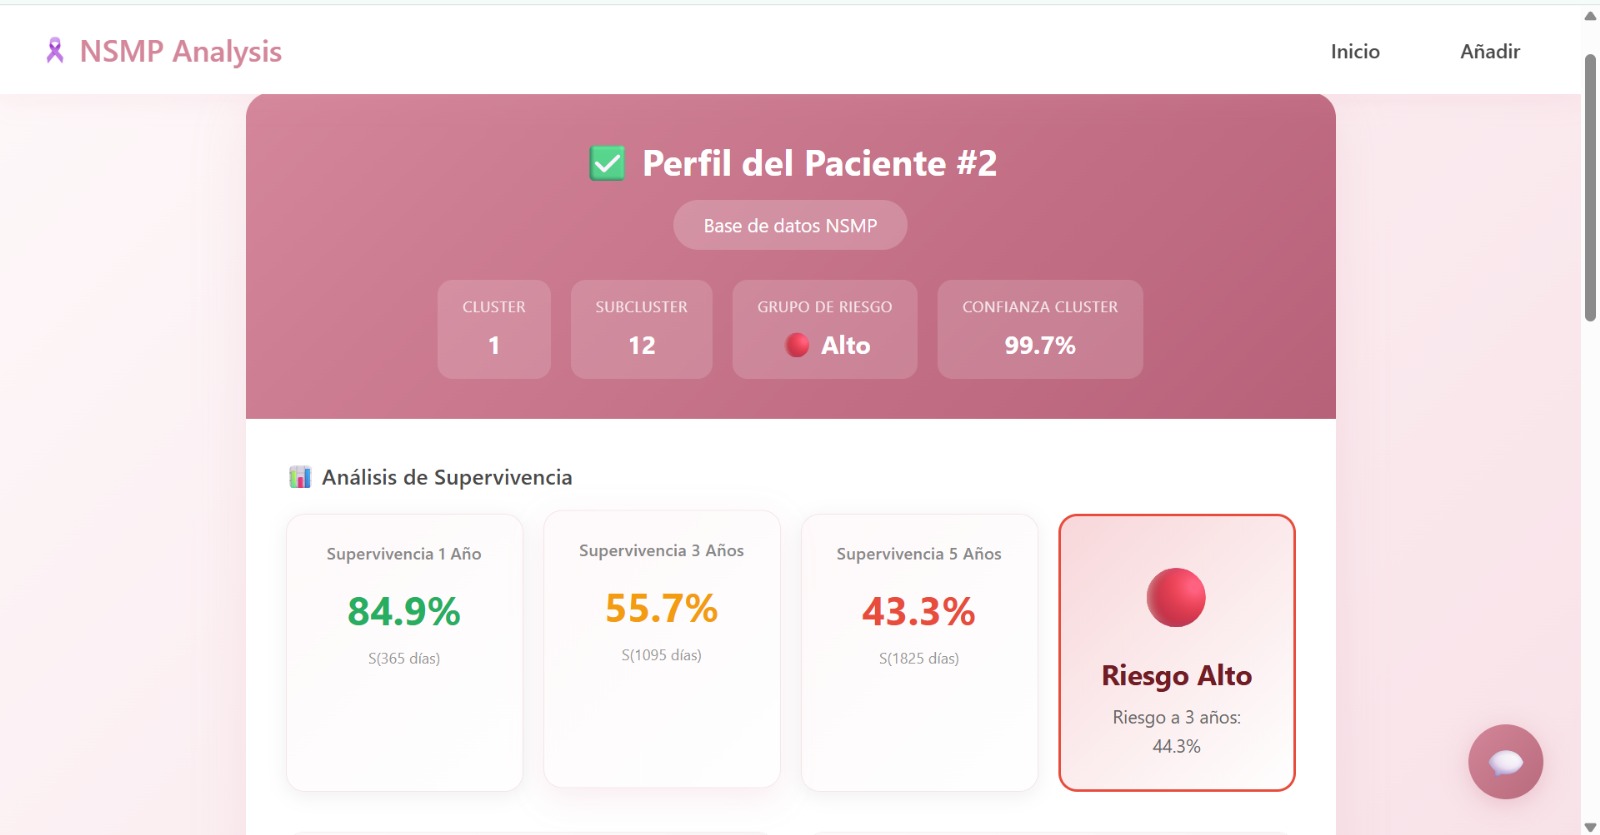
Our project is an AI-powered Endometrial Cancer Risk Calculator & Clinical Phenotyping Tool.
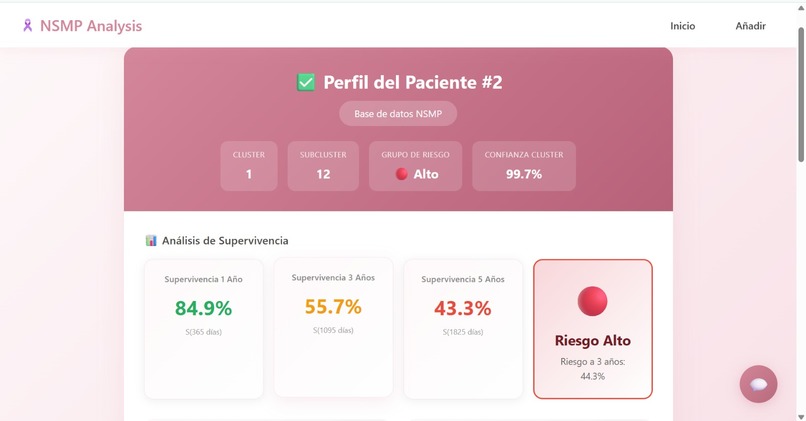
- Individual Survival Prediction: It predicts the probability of survival at 1, 3, and 5 years for a specific patient using Random Survival Forests.
- Unsupervised Phenotyping: It automatically assigns the patient to a specific clinical "cluster" or phenotype. These clusters were discovered by the AI without human bias, grouping patients with similar characteristics.
- Risk Stratification: It classifies the patient into Low, Medium, or High risk groups based on population terciles derived from our training data.
- Data Quality Alerts: The system warns the doctor if the input data has low confidence or too many missing values.
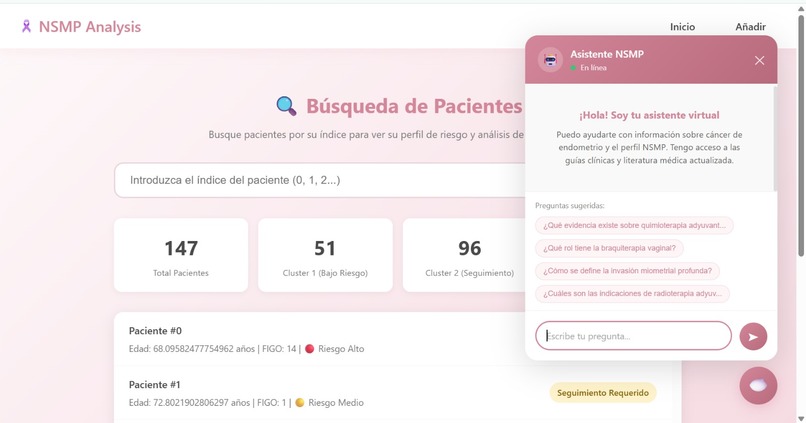
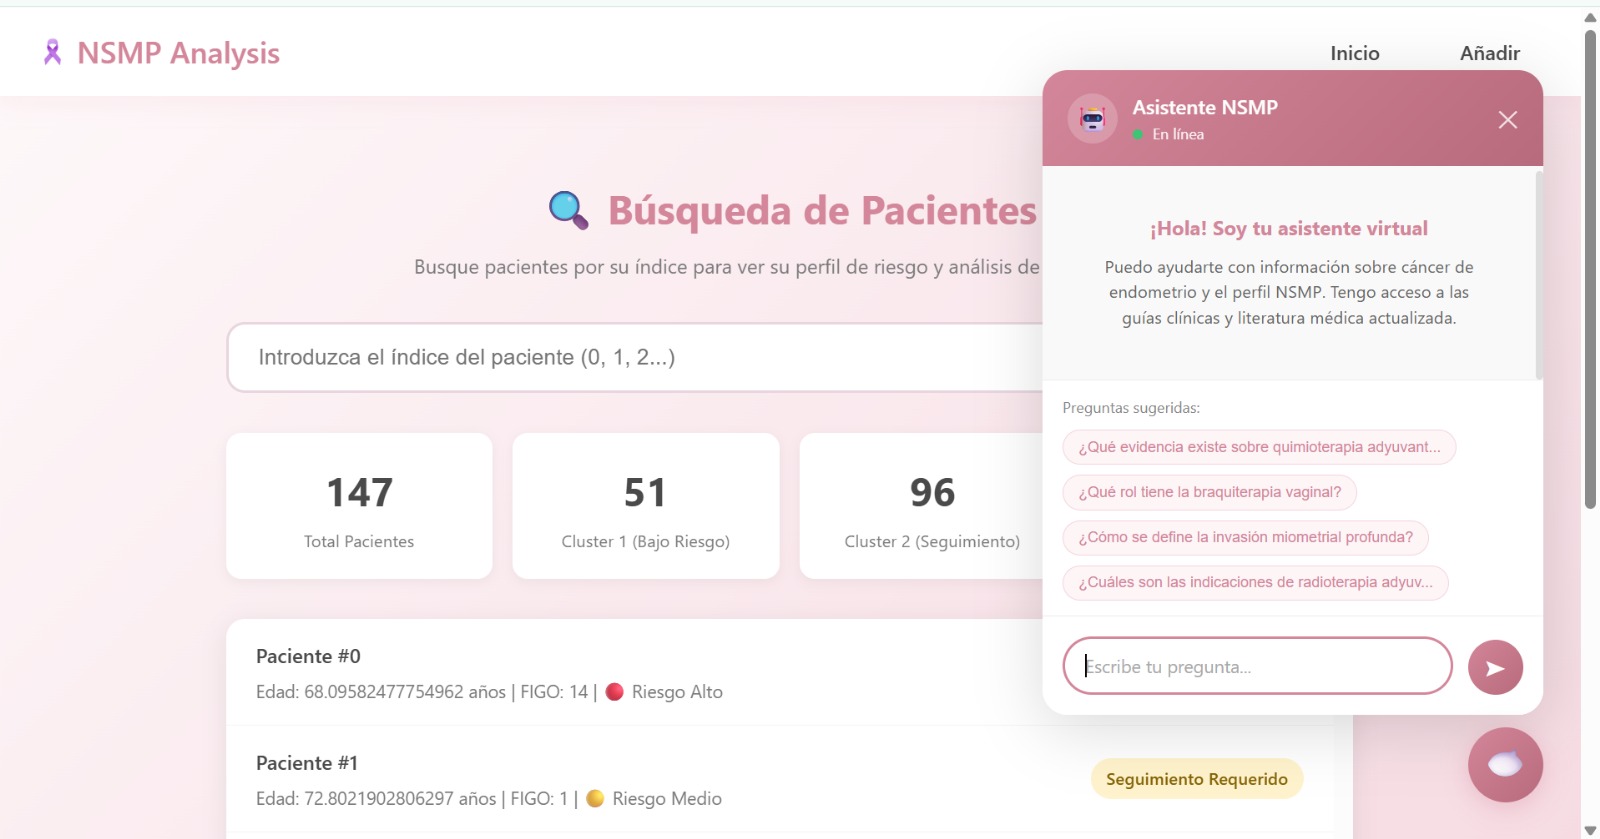
- AI Clinical Assistant: Beyond raw predictions, the platform features an embedded chatbot powered by RAG (Retrieval-Augmented Generation). It has been trained on a corpus of authoritative medical papers and guidelines on endometrial cancer, allowing clinicians to ask questions and verify protocols instantly.
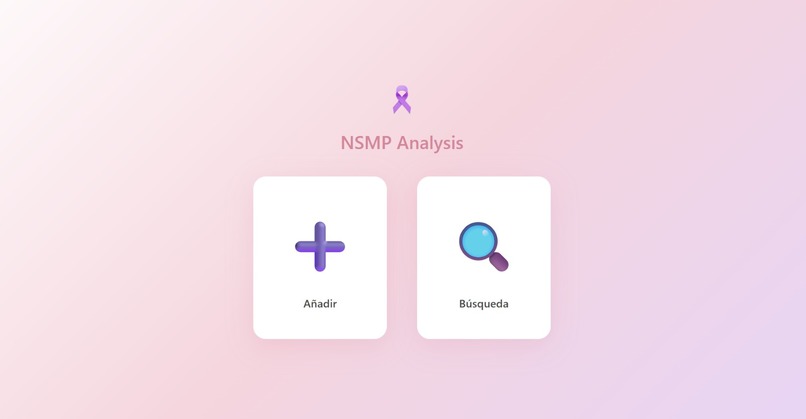
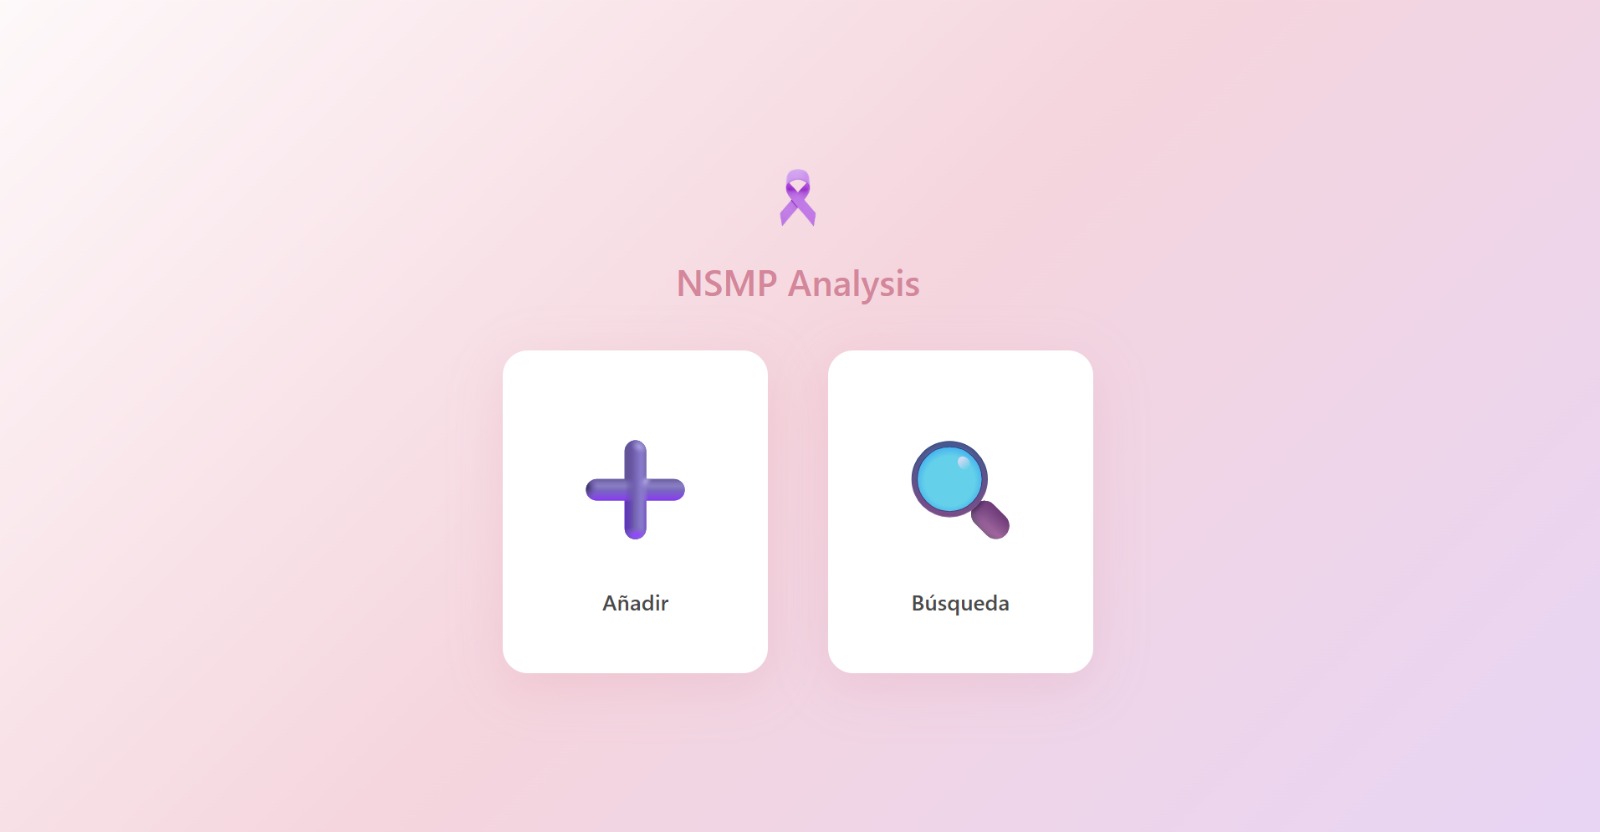
NSMPAnalisy is not just a model; it is a comprehensive, visual web platform designed for clinical utility. It streamlines two critical workflows for oncologists:
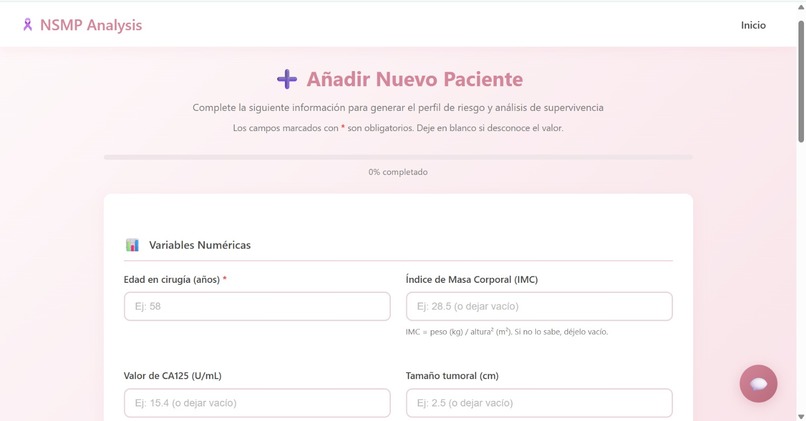
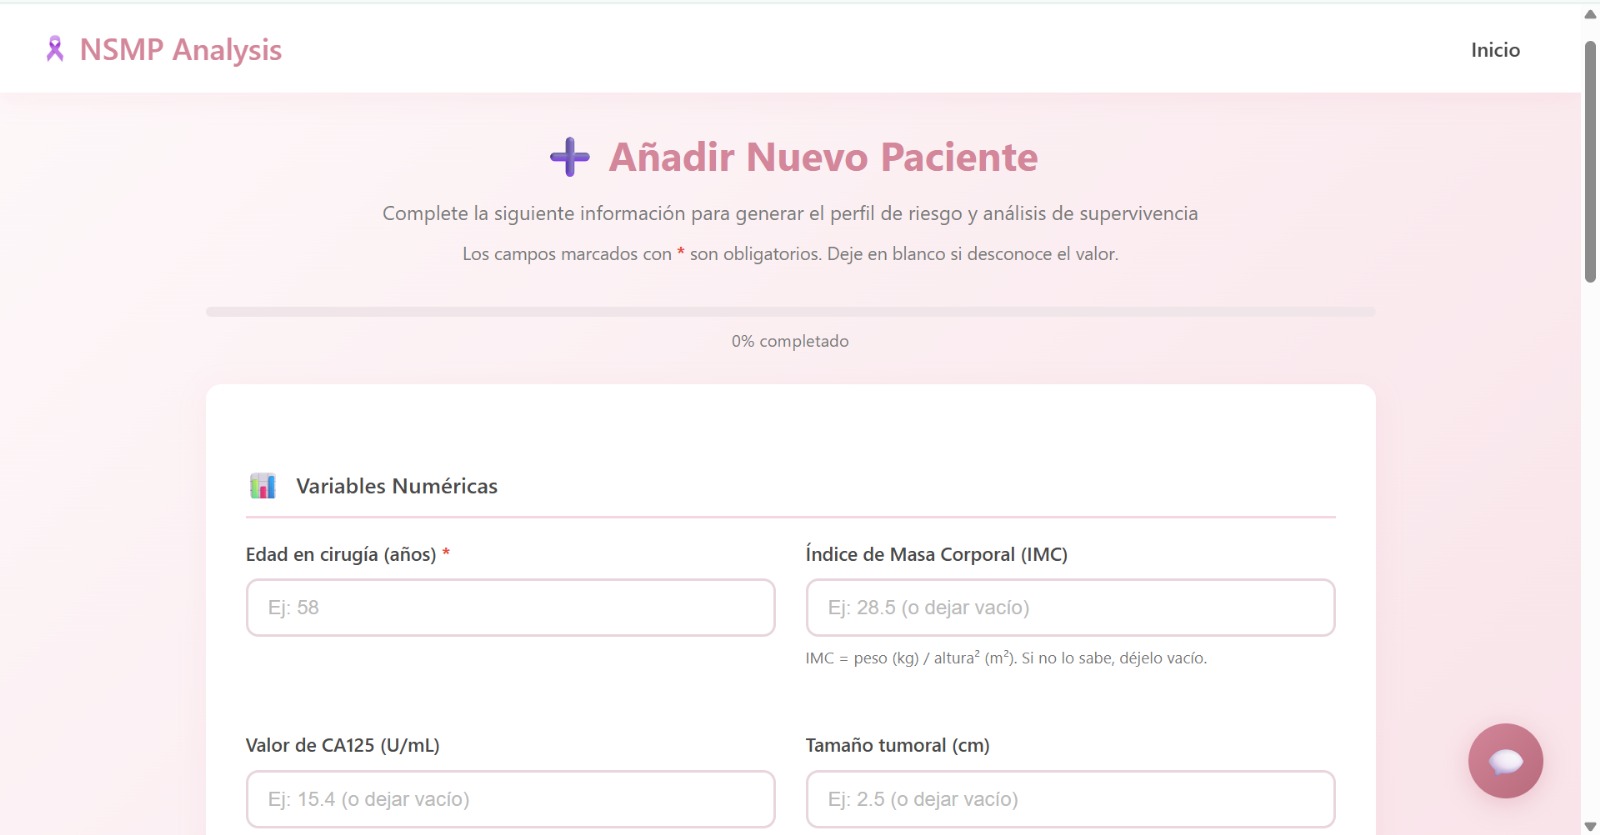
- New Patient Assessment (The Calculator): Clinicians can input clinical data for a new patient to instantly visualize where they fit. The system automatically assigns the patient to a specific Phenotype (Cluster) and calculates their Risk Group (Low, Medium, or High) based on our RSF model predictions.
- Patient Registry (The Dashboard): A search functionality allows doctors to look up existing patients by ID. This provides a quick view of their historical risk assessments and survival trajectories without re-entering data.
How we built it
We developed a rigorous data science pipeline divided into three stages:
1. Robust Data Preprocessing
Real-world clinical data is messy. We used Pandas and NumPy to clean a dataset containing mixed variables (numerical and categorical).
1.1. Feature Engineering: We applied log-transformations log(1 + x) to skewed tumor markers like tamano_tumoral and valor_de_ca125.
1.2. Imputation Strategy: Instead of discarding incomplete records, we treated "Missing" as a valid informative category for categorical variables and used median imputation for numerical ones, creating specific flags to track these imputations.
2. Unsupervised Clustering (The Core Innovation)
To find patient phenotypes, we avoided standard K-Means because our data was mixed (continuous + categorical).
2.1. Gower Distance: We calculated the Gower Distance matrix to correctly measure similarity between patients with different data types.
2.2. Hierarchical Clustering: We applied Complete Linkage clustering to this matrix.
2.3. Validation: We validated these clusters clinically using Kaplan-Meier curves and Log-Rank tests (p < 0.001), proving that the AI-discovered groups had significantly different survival outcomes.
3. Survival Modeling & Deployment
3.1. Random Survival Forests (RSF): We trained an RSF model using scikit-survival to handle right-censored data. This model achieved a Concordance Index (C-index) of ≈ 0.80, outperforming standard linear Cox models.
3.2. Calculator Logic: We encapsulated the trained artifacts (pipelines, models, and encoders) using joblib. The calculator logic handles new patient data in real-time, applying the same transformations as the training set.
3.3. Web Interface: We integrated this Python backend into a web application built with [Streamlit / React / Flask] to make it accessible for clinicians.
4. RAG-Powered Medical Chatbot
To bridge the gap between AI scores and clinical reasoning, we built a conversational agent using Retrieval-Augmented Generation (RAG).
- Knowledge Base: We ingested and indexed key medical papers and gynecologic oncology guidelines using a Vector Database.
- Semantic Search: When a doctor asks a question (e.g., "What is the protocol for Stage IA with p53 mutation?"), the system retrieves the most relevant excerpts from the medical literature.
- Contextual Answer: An LLM generates a precise answer based only on the retrieved medical texts, reducing hallucinations and providing citations for trust.
Challenges we ran into
A. Handling Mixed Data Types: Standard distance metrics (like Euclidean) fail with categorical medical data (e.g., "Stage IA" vs "Stage III"). Implementing and validating Gower Distance was crucial to getting meaningful clusters.
B. Preventing Data Leakage: In the unsupervised phase, we had to be extremely careful to exclude the outcome variables (event and time_days) from the clustering features. If we had included them, the clusters would have been trivial and useless for prediction. We successfully separated the feature space from the target space.
C. Right-Censored Data: Many patients in the dataset were still alive at the end of the study. Standard regression cannot handle this. Learning to effectively use Survival Analysis libraries (sksurv) was a steep but rewarding learning curve.
Accomplishments that we're proud of
Successfully implementing an unsupervised phenotyping approach that aligns with clinical reality (e.g., separating aggressive phenotypes from indolent ones without being told which is which).
Building a production-ready inference pipeline that handles edge cases, missing values, and validates inputs via a JSON schema.
What we learned
Navigating Medical Data Complexity: We learned that real-world clinical data is messy and heterogeneous. Handling right-censored data (where patients leave the study or outlive it) required a shift in mindset from standard regression to Survival Analysis.
Advanced Preprocessing & Engineering: We mastered techniques to stabilize clinical features, such as applying log(1 + x) transformations to skewed biomarkers and treating missing values as informative signals rather than just noise.
Cox vs. Random Survival Forests: We gained deep insight into the trade-offs between interpretability and performance. While Cox Proportional Hazards provided a solid statistical baseline, we learned that Random Survival Forests (RSF) could capture complex non-linear interactions between variables, significantly improving predictive accuracy.
The Power of Unsupervised Phenotyping: We discovered that algorithms like Hierarchical Clustering with Gower Distance can reveal clinically relevant patient subgroups that traditional staging systems might miss.
What's next for NSMP-PREDICT: A Risk Prediction Model for Endometrial Cancer
We believe NSMP-PREDICT has the potential to become a standard tool in gynecologic oncology. To get there, our roadmap focuses on bridging the gap between code and clinic:
A. Rigorous Clinical Validation: The immediate next step is to conduct a study where gynecologic oncologists review the AI-generated risk groups and phenotypes. We want to compare our model's predictions against standard clinical guidelines in a "shadow mode" (running parallel to current practice) to measure its added value in real-world decision-making.
B. External Validation on New Cohorts: To ensure our model generalizes well and isn't biased to a single hospital's population, we plan to test NSMP-PREDICT with unseen patient data from other medical centers. This multi-center validation is crucial to confirm robustness before deployment.
Built With
- cluster
- cox
- css
- fastapi
- html
- javascript
- jupyter
- llamaindex
- node.js
- python
- rfs
- scikit-learn
- scikit-survival
- scipy

Log in or sign up for Devpost to join the conversation.