What Inspired Us
The inspiration for this project came from a critical gap in clinical decision-making for endometrial cancer patients. While molecular profiling has revolutionized cancer treatment, there's a significant subset of patients, those with No Specific Molecular Profile (NSMP), who don't fit into the standard molecular classification system. These patients represent a clinical challenge: how do we predict their survival outcomes and guide treatment decisions when traditional molecular markers aren't informative?
We were driven by the vision of creating a tool that could help clinicians make more informed decisions for these patients. By leveraging clinical and pathological features that are routinely available, we could build predictive models that complement molecular testing and provide actionable insights at the point of care.
The goal was ambitious: develop a web-based calculator that could take a patient's clinical profile and provide real-time predictions for both Overall Survival (OS) and Recurrence-Free Survival (RFS), complete with risk stratification and survival probability estimates.
What We Learned
This project was a deep dive into survival analysis, a statistical domain we had only encountered in theory before. Here are the key lessons we took away:
Survival Analysis Fundamentals
We learned that survival analysis is fundamentally different from standard classification or regression. The challenge isn't just predicting an outcome, but modeling time-to-event data where many patients are "censored" (we don't observe their event because they're still alive or haven't recurred at last follow-up). The Cox Proportional Hazards model became our tool of choice because it can handle this censoring naturally while modeling the effect of multiple risk factors simultaneously.
Data Preprocessing in Clinical Settings
Working with real clinical data taught us that medical datasets are messy in ways we hadn't anticipated:
- Missing data is the norm, not the exception: Some features had 80%+ missing values, requiring careful feature selection
- Mixed data types everywhere: The same variable might be encoded as text ("G1", "G2", "G3"), numeric (1, 2, 3), or even have both formats in the same column
- Multicollinearity is a real problem: Clinical features are often highly correlated (e.g., preoperative and final staging), requiring variance inflation factor (VIF) analysis to identify redundant predictors
- Small sample sizes: With only 161 patients, every data point mattered, and overfitting was a constant concern
Feature Engineering for Survival Models
We discovered that feature selection for survival models requires different considerations than for classification:
- Temporal relationships matter: Preoperative features (available before surgery) are more clinically useful than postoperative features for early decision-making
- Domain knowledge is essential: Understanding which molecular markers (PMS2, MSH2, MSH6, MLH1) are relevant for endometrial cancer guided feature selection
- Encoding order matters: We learned the hard way that encoding categorical variables before feature selection prevents data leakage and ensures consistent preprocessing
Building Clinical Interfaces
Creating the Dash web application taught us that user experience in clinical tools is critical:
- Clinicians need interpretability: Not just a risk score, but understanding why a patient is high-risk (feature contributions)
- Visualization matters: Kaplan-Meier-style survival curves are familiar to clinicians and help build trust in the model
- Input validation is crucial: Medical data has constraints (e.g., BMI ranges, staging categories) that must be enforced
- Responsive design: The interface needed to work on tablets and desktops in clinical settings
How We Built the Project
The project evolved through several distinct phases, each building on lessons learned from the previous:
Phase 1: Exploration and Understanding
We started with exploratory data analysis (EDA) to understand the dataset structure. The Excel file contained 161 patients with over 100 potential features, ranging from demographics to molecular markers. We created a comprehensive feature documentation (key_features.md) tracking missing data percentages and clinical significance.
Key discovery: The dataset had two primary survival outcomes:
- Recurrence-Free Survival (RFS): Time from diagnosis to recurrence or last follow-up
- Overall Survival (OS): Time from diagnosis to death or last follow-up
These required separate models because the risk factors differed between recurrence and death.
Phase 2: Preprocessing Pipeline Development
The preprocessing pipeline (02_preproccesing.py) became the foundation of the project. This was where we encountered and solved most of the technical challenges:
Data Translation: The original data was in Spanish, requiring a comprehensive variable mapping dictionary to translate to English for consistency.
Survival Time Calculation: We wrote functions to calculate survival times from date columns, handling edge cases like:
- Patients who died before recurrence (for RFS, they're censored at death)
- Patients with missing follow-up dates
- Negative time differences (data quality issues)
Encoding Strategy: We implemented a multi-step encoding process:
- Ordinal variables (tumor grade, risk groups) → numeric encoding preserving order
- Categorical variables → one-hot encoding with
drop_first=Trueto avoid multicollinearity - Continuous variables → kept as-is for Cox models (which handle continuous features well)
Feature Selection: We used multiple criteria:
- Missing data threshold (<50% missing)
- Correlation analysis to remove highly correlated features
- VIF analysis to detect multicollinearity
- Clinical relevance (prioritizing features available preoperatively)
Train-Test Splitting: Used stratified splitting to ensure both sets had similar event rates, critical for small datasets.
Phase 3: Model Development
We built a modular modeling framework (src/modeling.py) centered around a CoxPHModel class that wrapped the lifelines library:
Key design decisions:
- Regularization: Used L2 penalization (penalizer=1.0) to prevent overfitting with the small sample size
- Feature standardization: Added an option to standardize features, which improves coefficient interpretability (coefficients represent effect of 1 standard deviation change)
- Model persistence: Implemented save/load functionality using
joblibfor deployment
Model Performance:
- Overall Survival: C-index = 0.77 (moderate discrimination)
- Recurrence-Free Survival: C-index = 0.85 (good discrimination)
The RFS model performed better, likely because recurrence is more directly related to tumor characteristics, while OS is influenced by many non-cancer factors (comorbidities, age, etc.).
Phase 4: Validation Framework
We implemented cross-validation (src/validation.py) to assess model stability and prevent overfitting. This was crucial given the small sample size. The framework:
- Used stratified K-fold cross-validation respecting survival structure
- Evaluated both discrimination (C-index) and calibration
- Generated visualizations comparing model performance across folds
Phase 5: Web Application Development
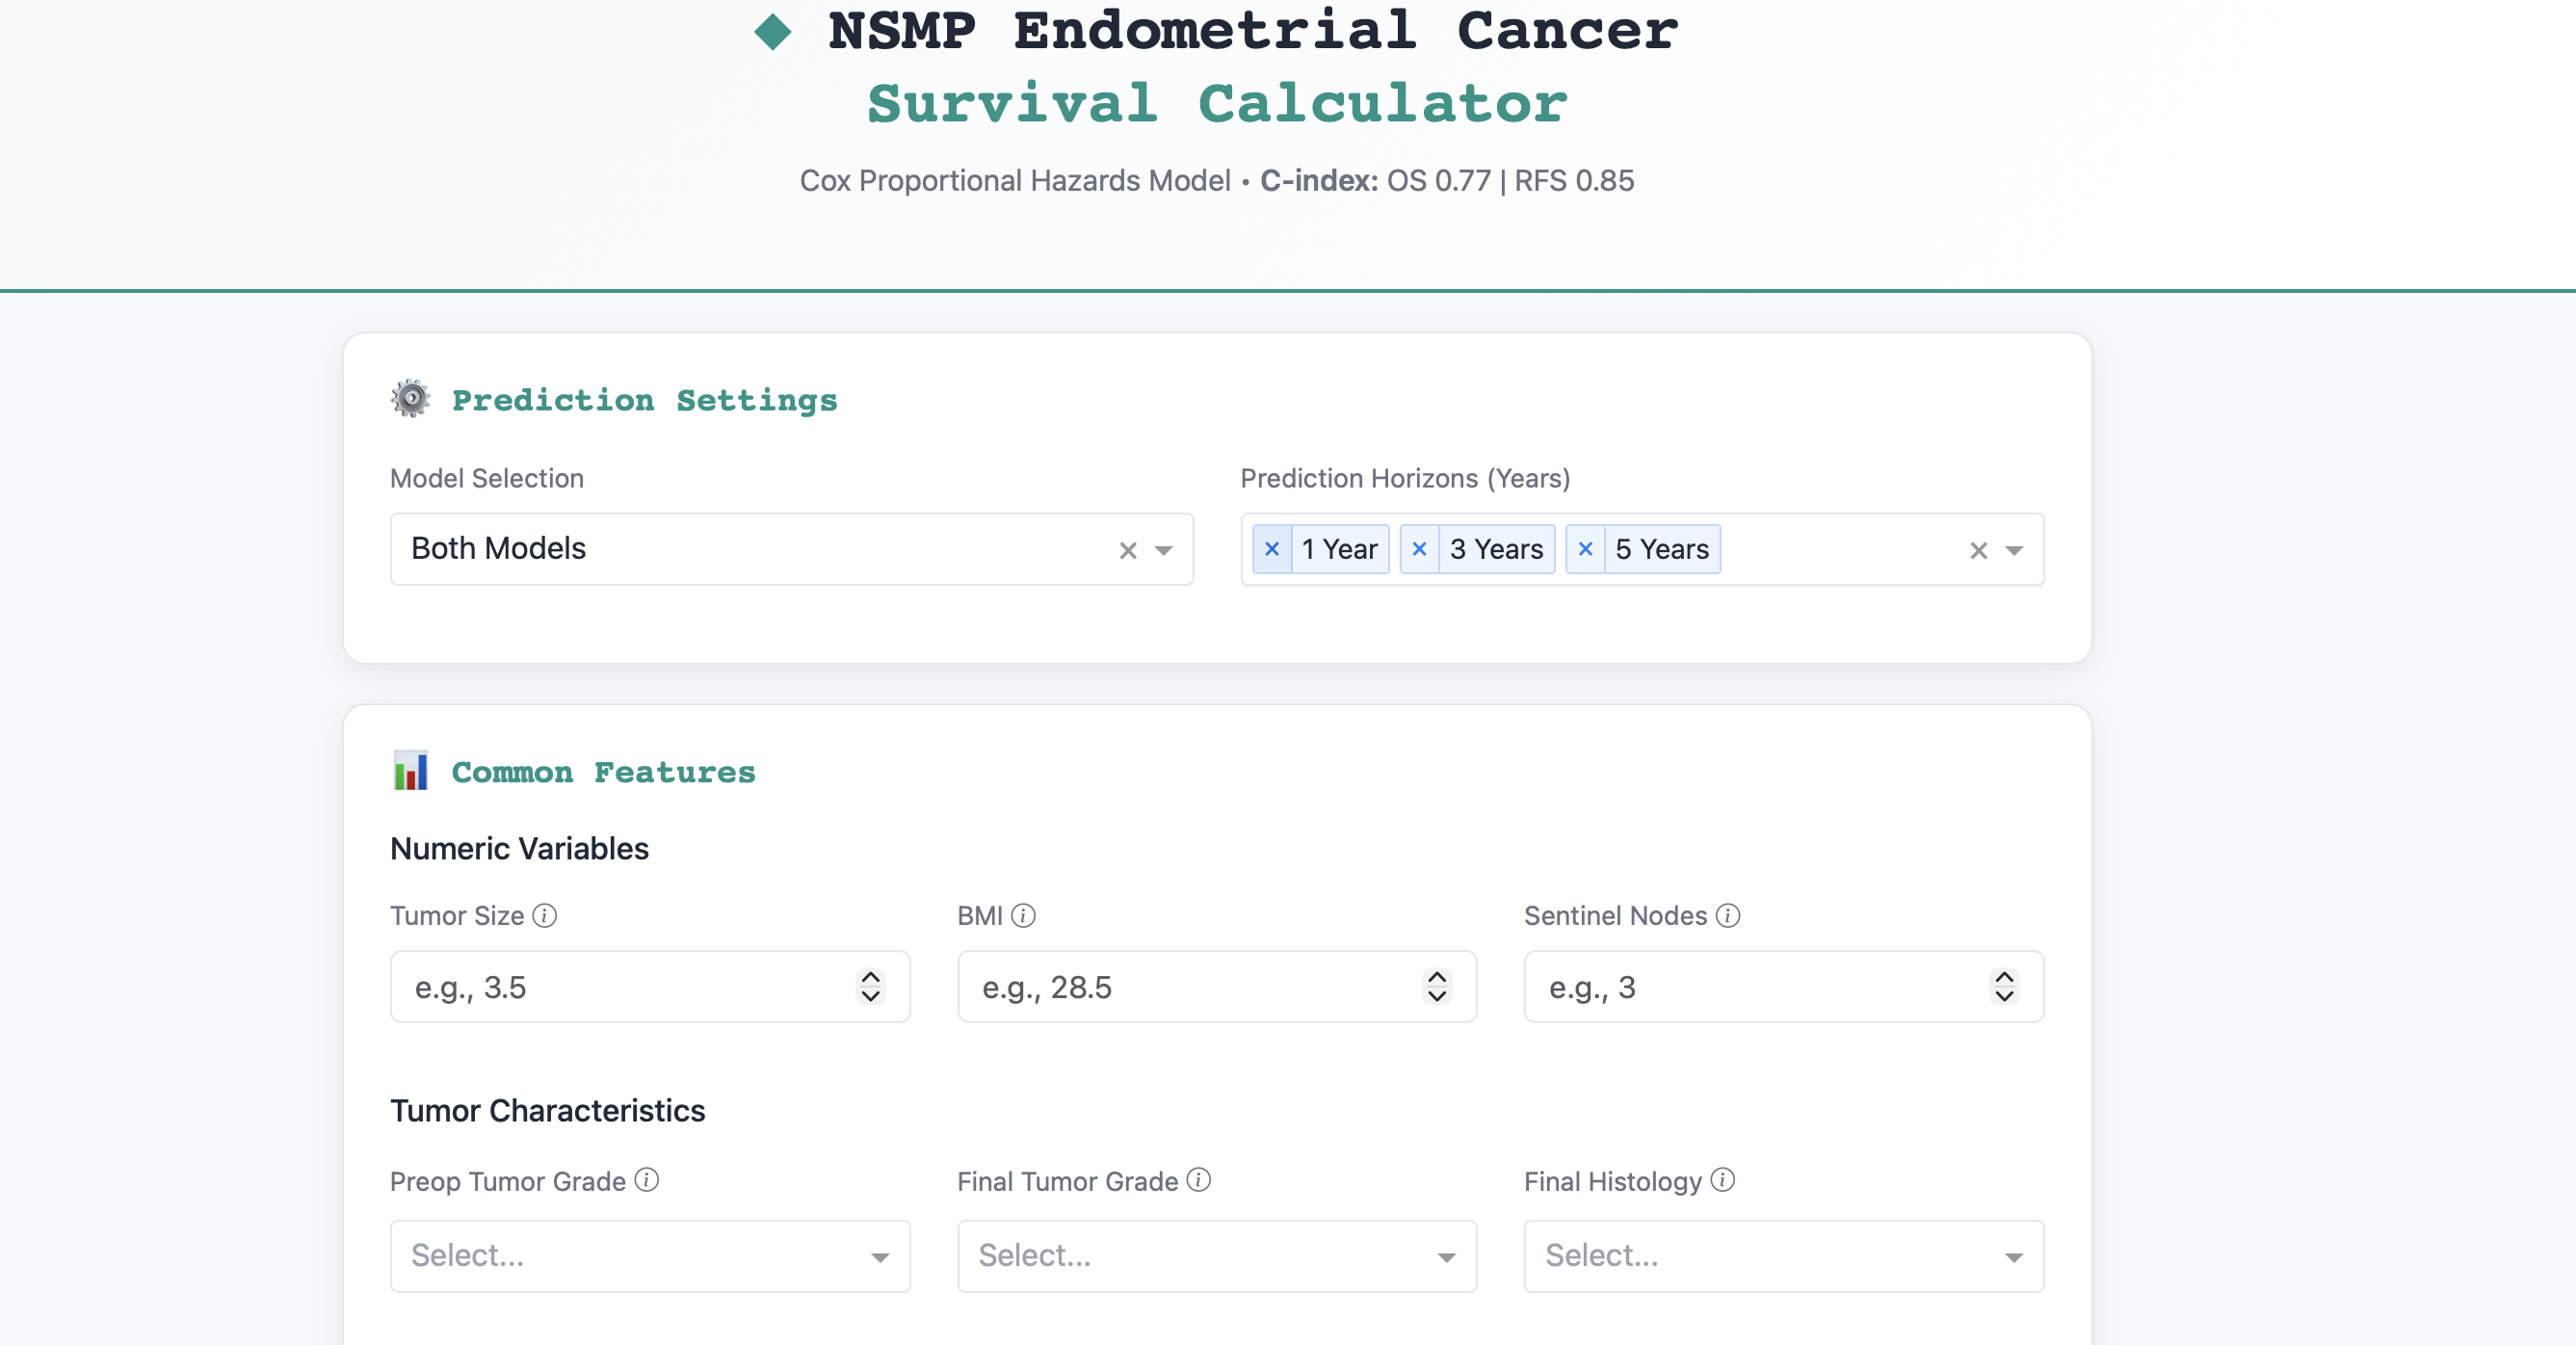
The Dash application (app/dash_app.py) was the most user-facing component. We designed it with several key features:
- Dual Model Support: Users can select OS, RFS, or both predictions
- Dynamic Input Forms: Different input fields for OS vs. RFS models (e.g., PMS2 for OS, lymphovascular invasion for RFS)
- Real-time Predictions: Instant risk scores and survival probabilities
- Visualizations:
- Risk distribution histograms
- Survival probability curves
- Feature contribution bar charts
- Hazard ratio visualizations
- Risk Stratification: Automatic classification into Low/Medium/High risk groups
The interface uses Bootstrap styling for a professional, clinical appearance and includes extensive input validation.
Phase 6: Addressing Class Imbalance
One challenge we discovered was class imbalance in survival outcomes. Most patients didn't experience events (recurrence or death), which could bias the models. We experimented with SMOTE (Synthetic Minority Oversampling Technique) for survival data (02b_oversampliong.py), though ultimately the Cox model's ability to handle censoring made this less critical than in classification problems.
Challenges We Faced
Challenge 1: The Encoding Order Bug
The Problem: Our initial preprocessing pipeline performed feature selection before encoding categorical variables. This caused a critical bug: the selected features were categorical column names, but the model expected encoded (one-hot) features.
The Solution: We restructured the pipeline to encode first, then select features. This required rewriting significant portions of the preprocessing code but resulted in a more robust pipeline.
Lesson: In machine learning pipelines, the order of operations matters critically. Always encode before feature selection when working with mixed data types.
Challenge 2: Multicollinearity in Clinical Features
The Problem: Clinical features are inherently correlated. For example, preoperative staging, final staging, and risk groups all measure similar concepts. High multicollinearity causes unstable coefficient estimates and makes interpretation difficult.
The Solution: We implemented VIF (Variance Inflation Factor) analysis to identify and remove highly correlated features. We set a threshold of VIF > 10 to flag problematic features and removed them iteratively.
Lesson: Domain knowledge helps, but quantitative methods like VIF are essential for detecting subtle multicollinearity that isn't obvious from correlation matrices.
Challenge 3: Small Sample Size
The Problem: With only 161 patients, the risk of overfitting was constant. Standard machine learning approaches (like complex neural networks) weren't viable.
The Solution:
- Used regularization (L2 penalization) aggressively
- Kept the feature set small (16 features for OS, 20 for RFS)
- Used cross-validation extensively to assess generalization
- Accepted that some uncertainty is inherent with small datasets
Lesson: Sometimes the best model is the simplest one that generalizes well. A well-regularized Cox model with 16 features outperformed more complex approaches on this dataset.
Challenge 4: Missing Data Strategy
The Problem: Missing data percentages ranged from 0% to 87%. Some important features (like CA-125, a tumor marker) had >80% missing values, making them unusable.
The Solution:
- Set a 50% missing threshold for feature inclusion
- Used complete-case analysis (dropping rows with missing values in selected features) rather than imputation, since imputation assumptions are hard to validate in survival analysis
- Documented missing data patterns to inform clinical interpretation
Lesson: In clinical data, missingness is often informative (e.g., a test wasn't ordered because it wasn't indicated). Imputation can introduce bias, so sometimes complete-case analysis is preferable.
Challenge 5: Building an Intuitive Clinical Interface
The Problem: Clinicians need to trust the tool, which requires both accuracy and interpretability. The interface needed to be fast, clear, and provide context for predictions.
The Solution:
- Added feature contribution visualizations showing which factors drive high/low risk
- Included confidence intervals and risk stratification (not just point estimates)
- Used familiar visualizations (Kaplan-Meier curves) that clinicians recognize
- Provided both numeric outputs (survival probabilities) and visual outputs (curves)
Lesson: A model is only as good as its usability. Spending time on the user interface and interpretability features is as important as model performance.
Challenge 6: Handling Censored Data in Predictions
The Problem: Survival models predict survival functions, not single values. For the web app, we needed to extract specific survival probabilities at clinically relevant time points (1, 3, 5 years).
The Solution: Used the predict_survival_function method from lifelines, which returns survival probabilities at specified time points. We then formatted these for display in the web interface.
Lesson: Survival analysis requires thinking in terms of functions and probabilities, not just binary outcomes. This is more complex but also more informative for clinical decision-making.
Reflection
This project taught us that building clinical decision support tools requires a unique combination of skills:
- Statistical rigor: Understanding survival analysis, regularization, and validation
- Data engineering: Handling messy, real-world clinical data
- Software engineering: Building robust, maintainable pipelines
- User experience design: Creating interfaces that clinicians will actually use
- Domain knowledge: Understanding the clinical context to make informed modeling decisions
The final tool represents a synthesis of these skills. While the models aren't perfect (C-index of 0.77-0.85), they provide valuable risk stratification that can complement clinical judgment. The interactive web interface makes these predictions accessible at the point of care.
Most importantly, this project reinforced that in healthcare applications, interpretability and usability are as important as raw performance. A slightly less accurate model that clinicians understand and trust is more valuable than a black-box model with marginally better metrics.
Future Directions
If we were to continue this project, we would:
- External validation: Test the models on an independent dataset to assess generalizability
- Temporal validation: Validate on more recent patients to ensure the models remain relevant as treatment practices evolve
- Feature updates: Incorporate new molecular markers as they become standard in clinical practice
- Model calibration: Improve calibration so that predicted probabilities match observed event rates more closely
- Clinical integration: Work with clinicians to integrate the tool into electronic health record systems
The journey from raw Excel data to a functional clinical calculator was challenging but deeply rewarding. Each obstacle taught us something new about both the technical aspects of survival modeling and the practical realities of working with clinical data.


Log in or sign up for Devpost to join the conversation.