-
-
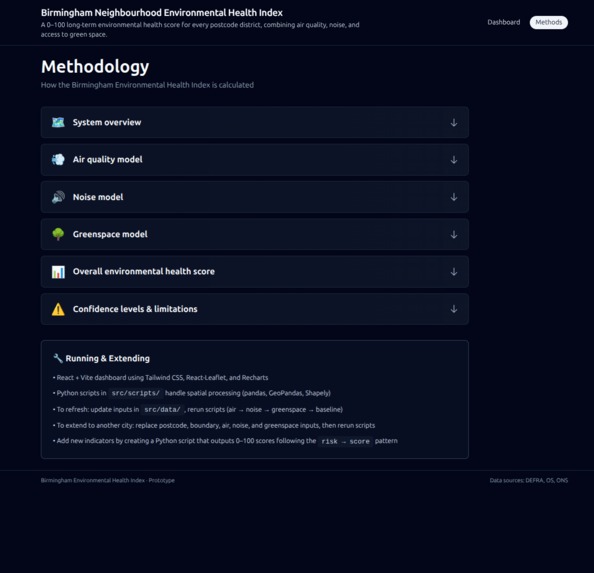
Methods page
-
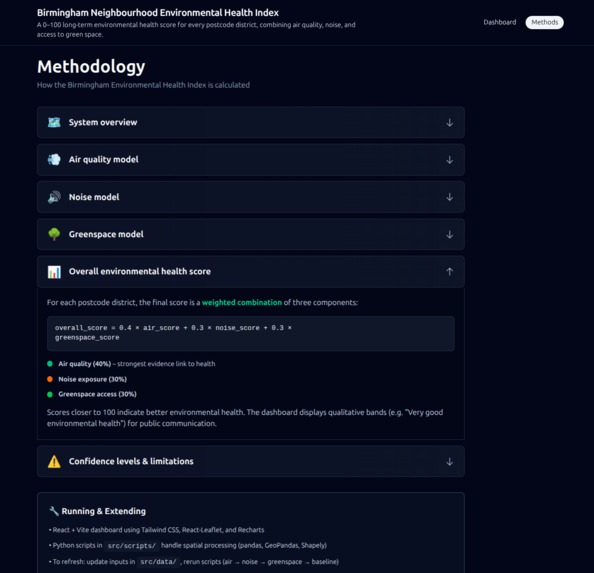
Methods page > How health score was calculated
-
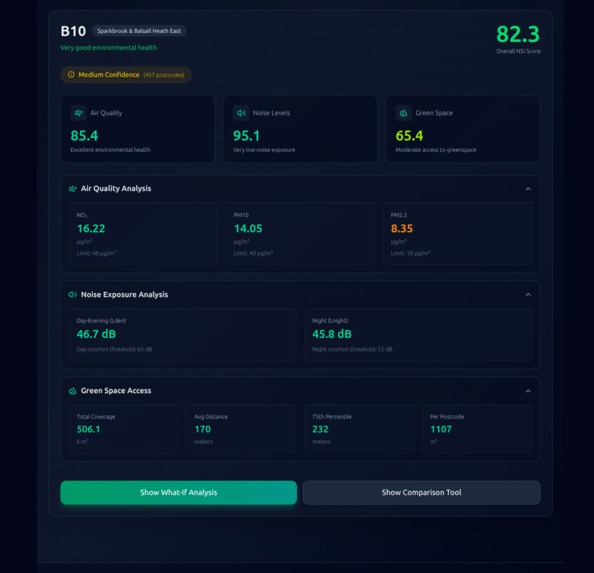
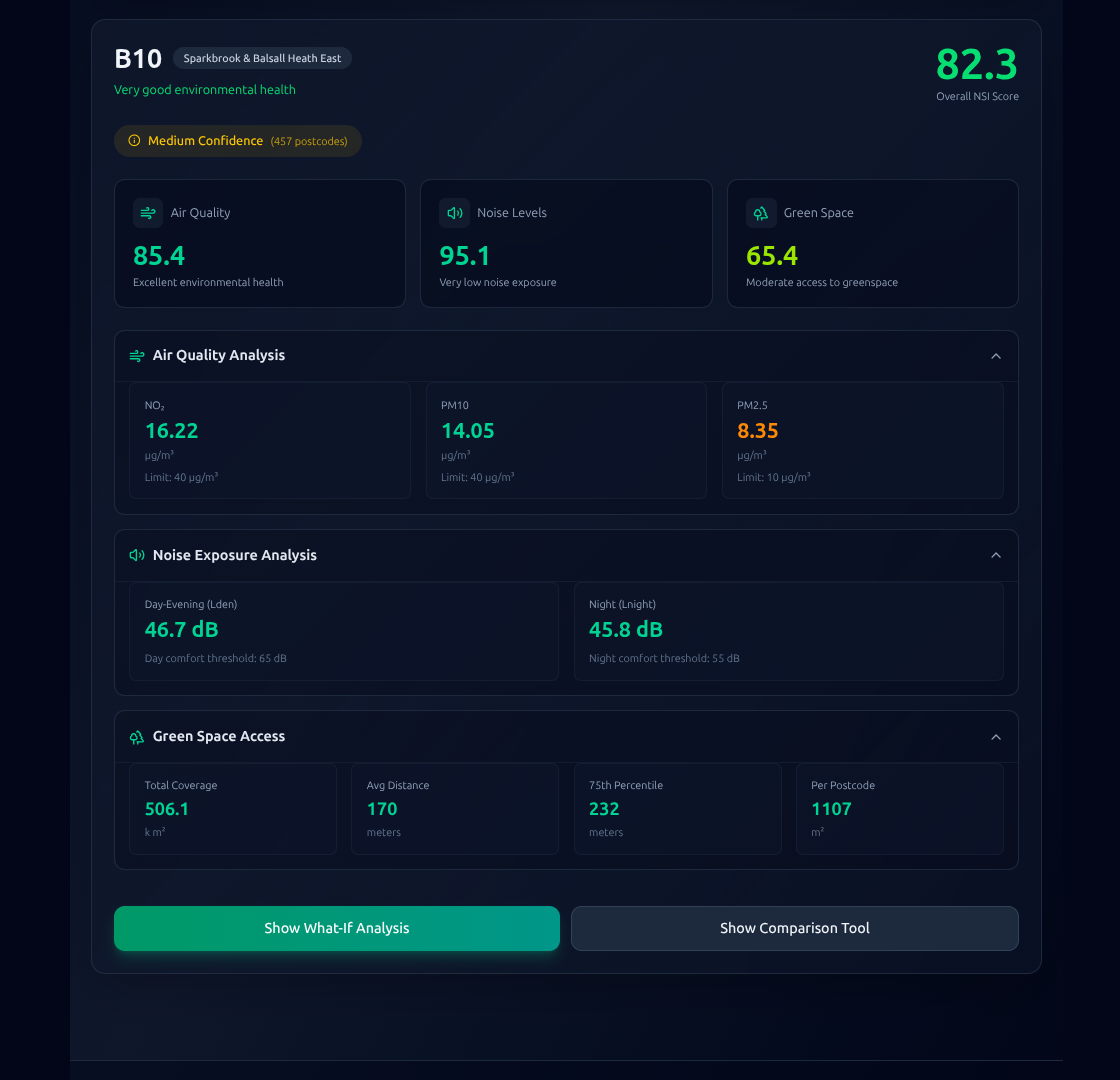
Details for a postcode
-
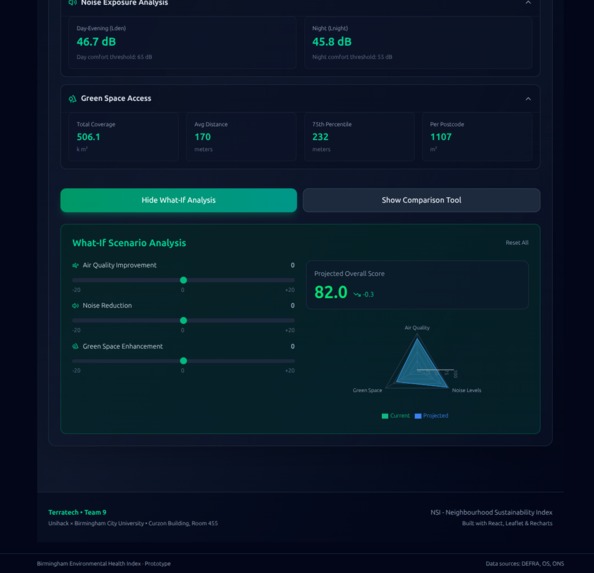
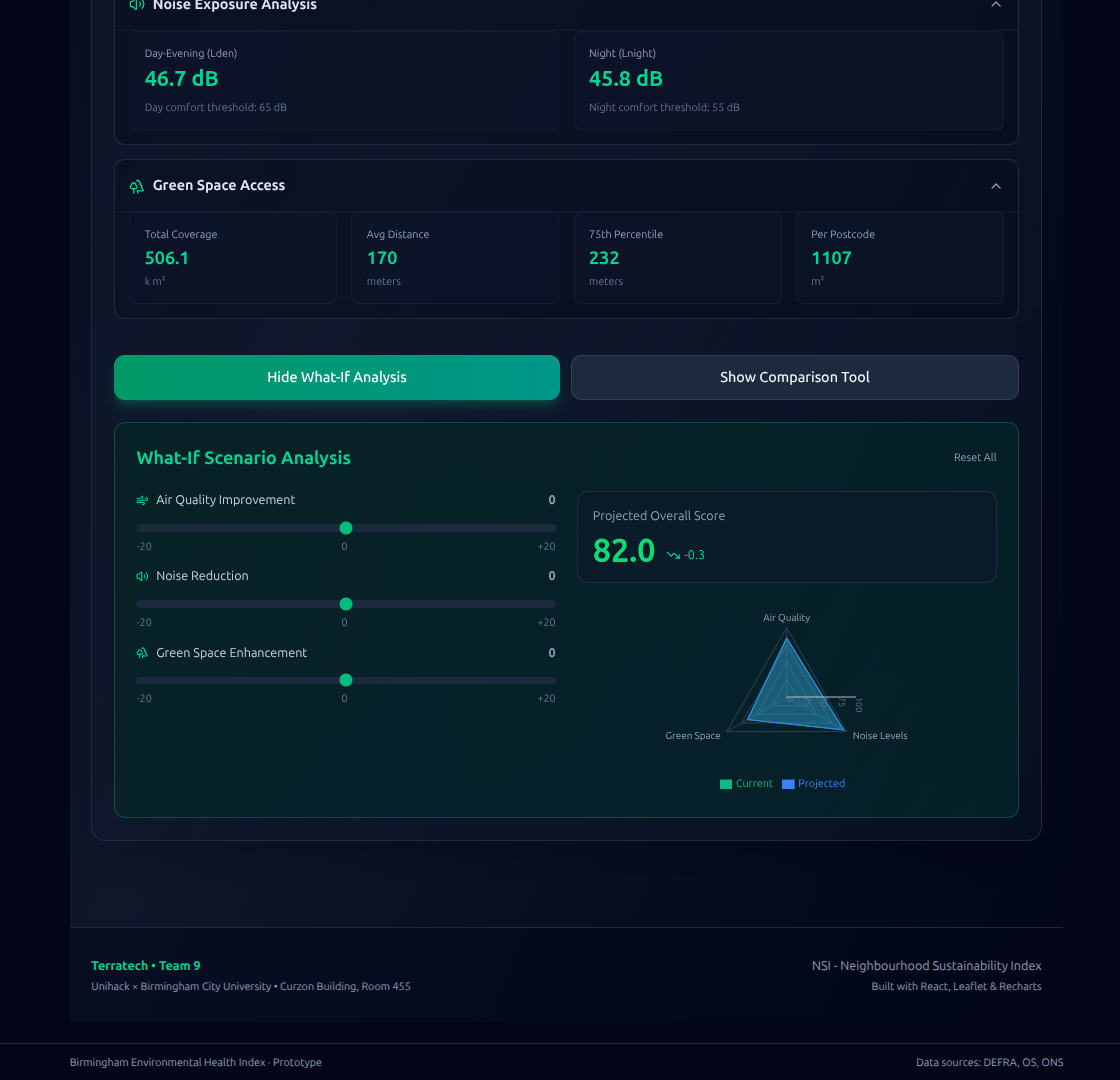
Interactive tool (what if)
-
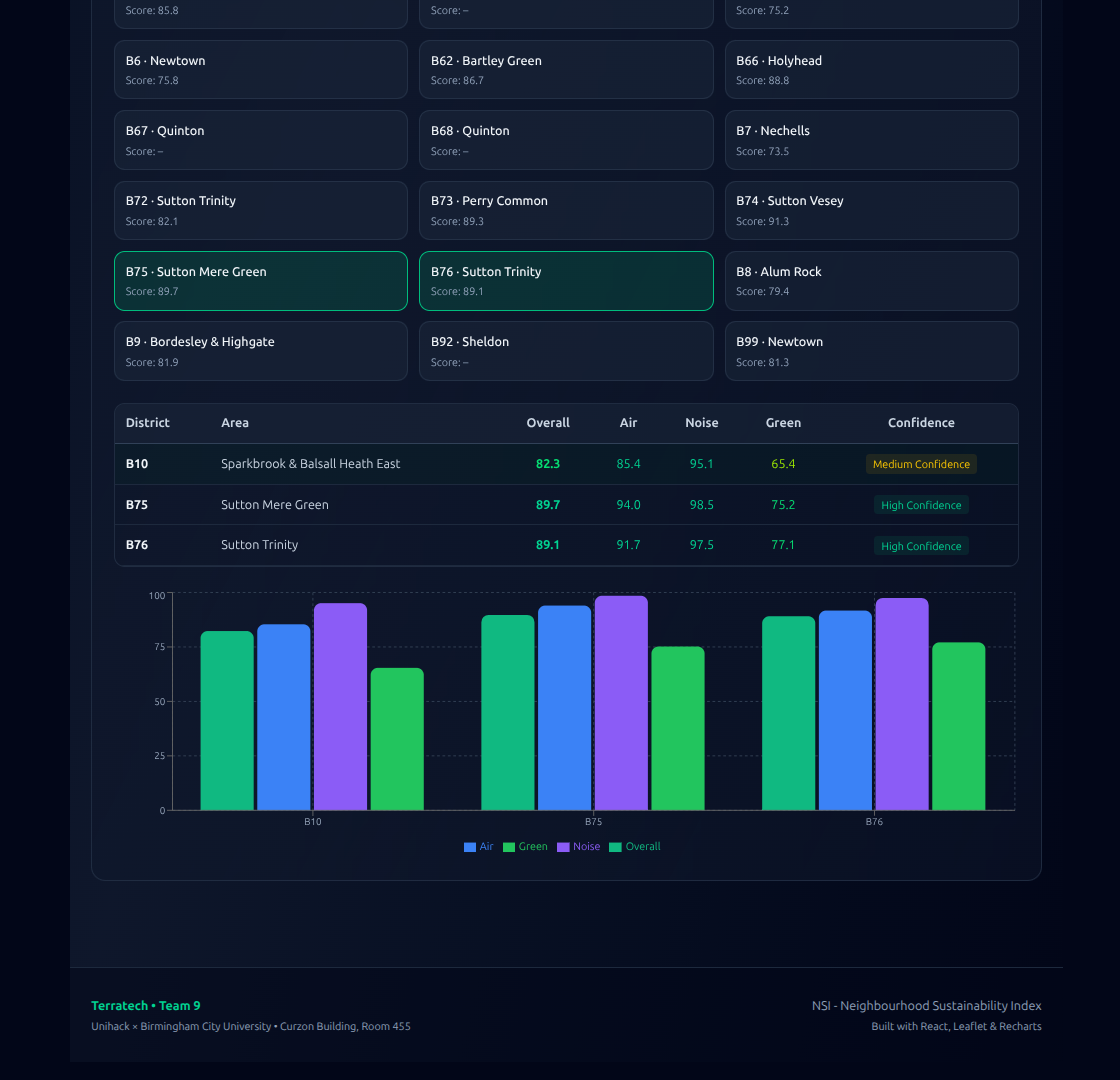
Comparison with other postcodes
-
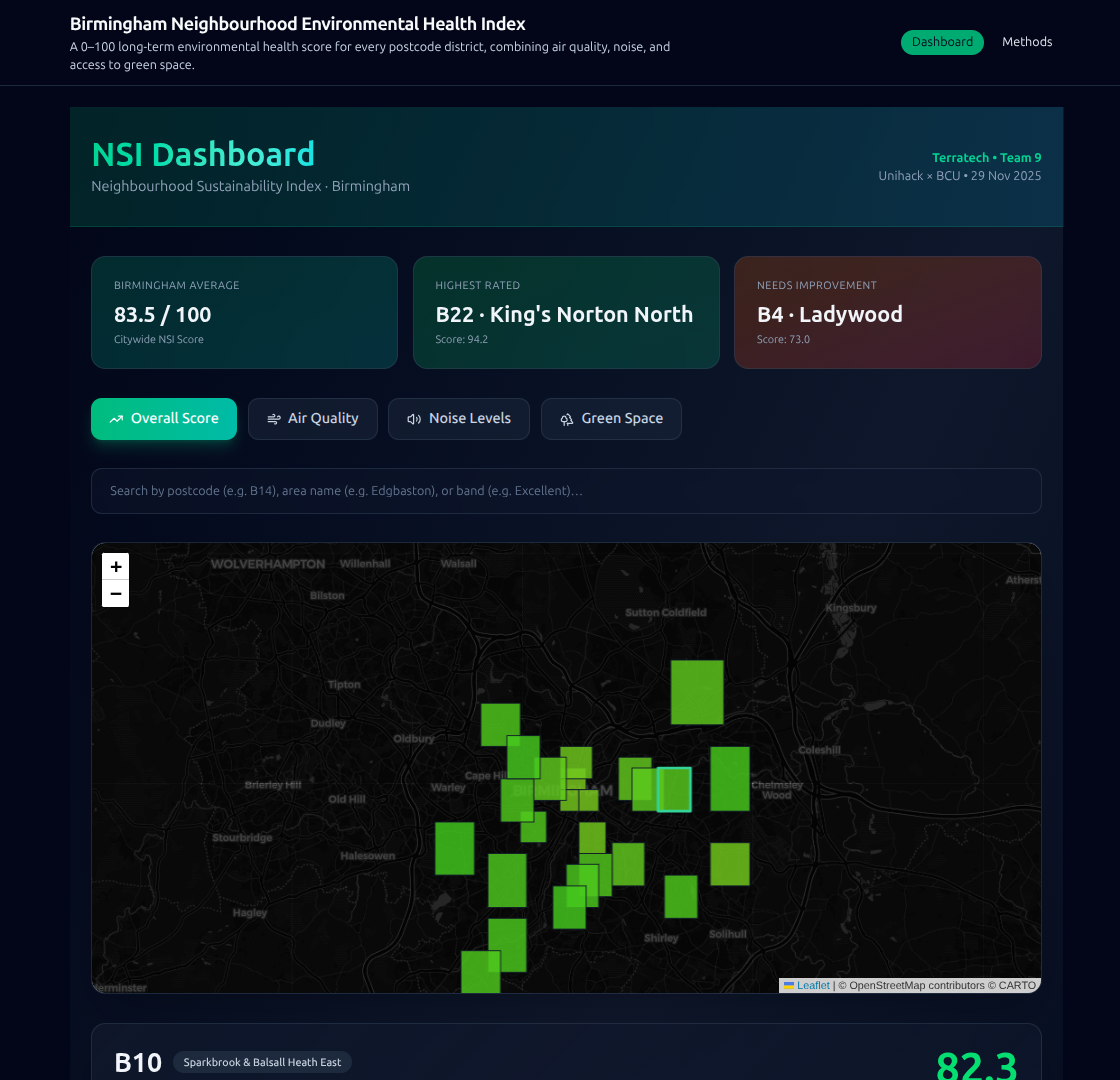
Landing page
Inspiration
Cities shape our health long before hospitals do. Where we live determines what we breathe, how much noise surrounds us, and whether we can access green space. Yet this information is fragmented across technical datasets that most people never see or understand. We wanted to turn invisible environmental risk into something visible, comparable, and actionable for everyday people, students, and policymakers.
NSI (Neighbourhood Sustainability Index) was inspired by a simple question:
If people can check food hygiene ratings before eating, why can’t they check environmental health before living somewhere?
What it does
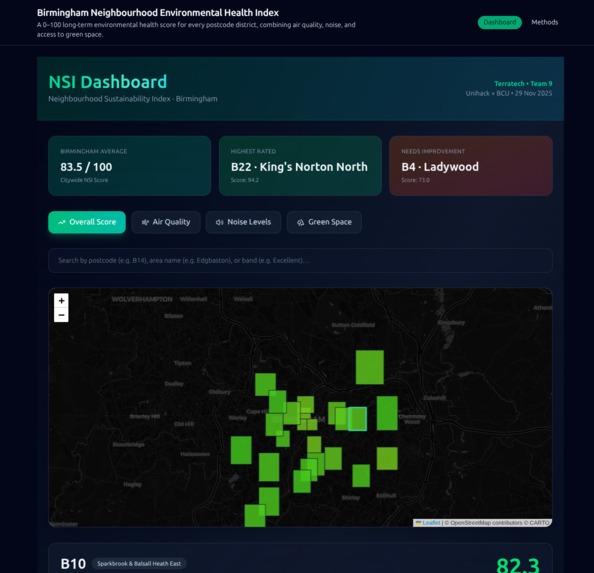
NSI is an interactive platform that assigns every Birmingham postcode district a single sustainability score from 0–100, based on three critical long-term environmental factors:
- Air Quality (NO₂, PM10, PM2.5)
- Noise Exposure (road and rail, day & night)
- Greenspace Access (area, distance, distribution)
Users can:
- Search any district instantly
- Visualise environmental health on a live map
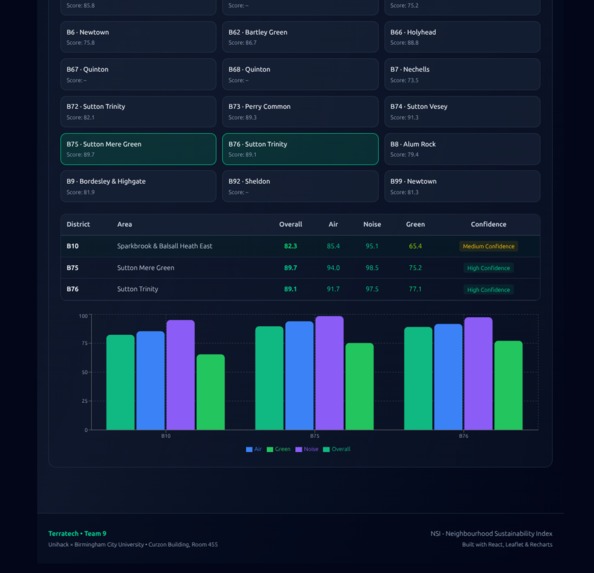
- Compare neighbourhoods side-by-side
- View detailed breakdowns of pollution, noise, and greenspace
- Run what-if scenarios to explore how improvements would change outcomes
The goal is to make urban environmental health understandable, comparable, and public-facing.
How we built it
NSI was built as a full-stack data-driven web application:
- Frontend: React, Tailwind CSS, Leaflet (interactive mapping), Recharts (data visualisation)
- Data Processing: Python (pandas, geopandas) to clean, aggregate, and normalise multi-source datasets
- Geospatial Data: Official UK government datasets (ONS, DEFRA, Ordnance Survey, noise mapping)
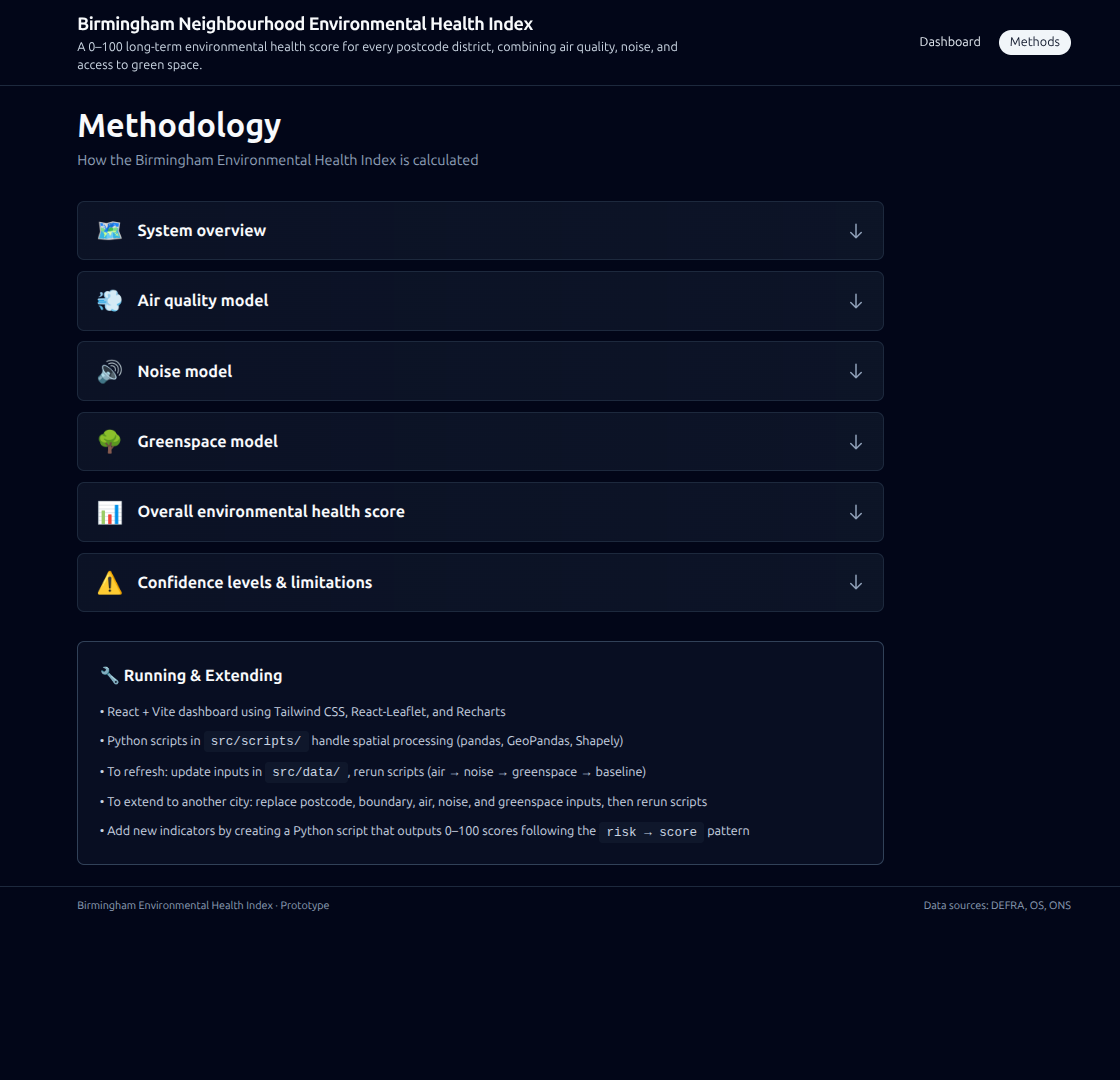
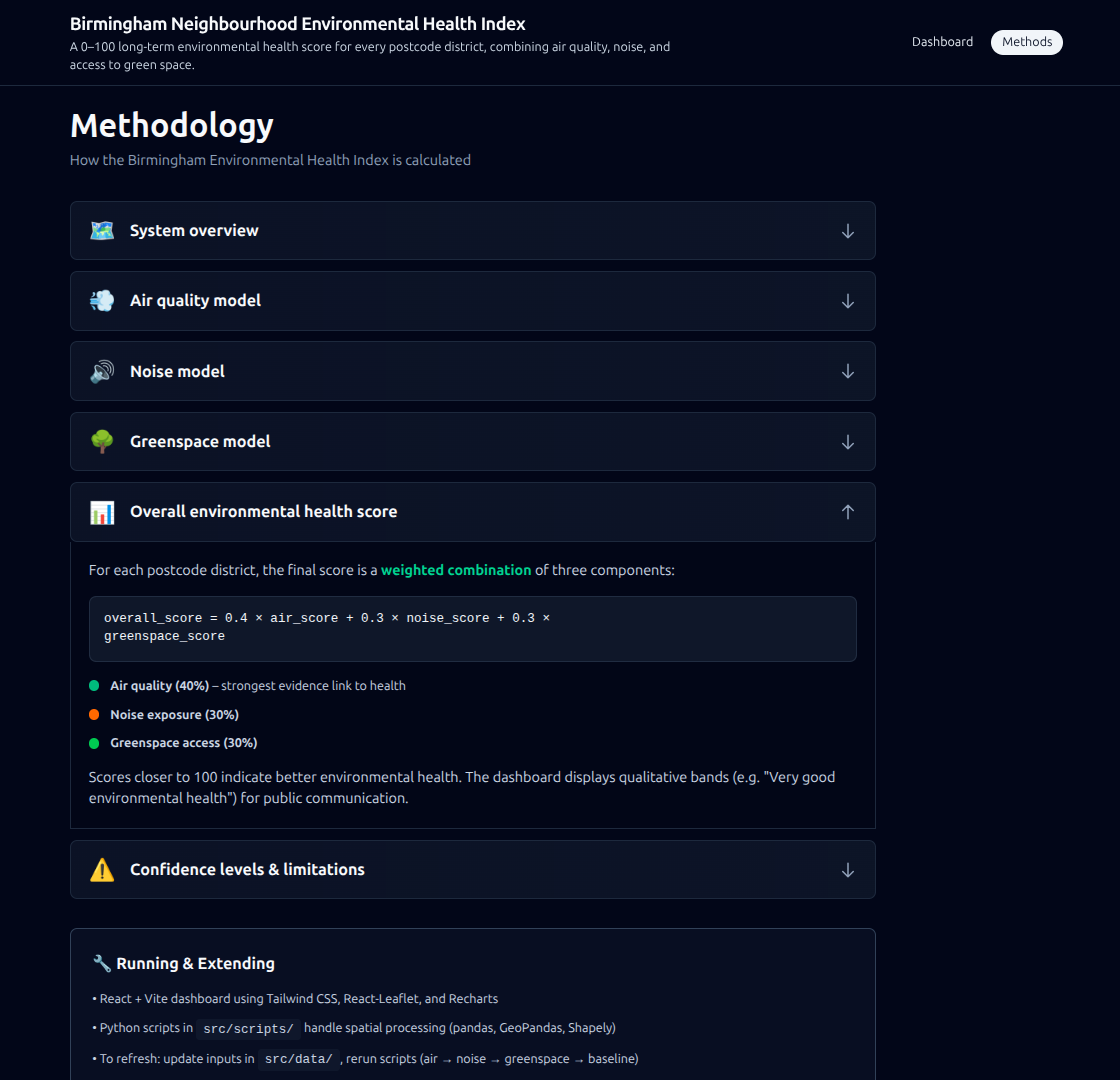
- Scoring System: Custom environmental scoring model that normalises each component into a unified 0–100 index
- Design System: Custom UI components for confidence weighting, visual grading, and comparison tools
All raw environmental data was transformed into district-level indicators before being visualised in the NSI dashboard.
Challenges we ran into
- Dirty real-world data: Government datasets came in mismatched formats (CSV, GEOJSON, shapefiles), requiring heavy cleaning and reconciliation.
- Geographic alignment: Matching pollution, noise, and greenspace data to consistent postcode districts was non-trivial.
- Normalisation: Converting different environmental units into a fair 0–100 score required careful statistical design.
- Performance: Rendering detailed geospatial data live in a browser without freezing required optimisation.
- UX complexity: Making scientific data understandable without oversimplifying it was a constant design challenge.
Accomplishments that we're proud of
- Built a fully functioning environmental health index for Birmingham
- Unified three complex environmental domains into a single, comparable score
- Created a public-facing map-based tool that is accessible, fast, and intuitive
- Implemented real-time comparisons and what-if simulations
- Used real official datasets, not mock or placeholder data
- Delivered a product that works for citizens, students, and policymakers
What we learned
- Environmental health data is powerful but deeply underutilised
- Data cleaning and preprocessing often takes longer than building the UI
- Geospatial projects demand both engineering precision and design clarity
- “Simple scores” require serious modelling behind the scenes
- Urban sustainability becomes far more important when you can actually see it
What's next for NSI (Neighbourhood Sustainability Index)
- Expand beyond Birmingham to nationwide coverage
- Add time-series trends to track improvement or decline
- Integrate health outcome correlations (asthma, cardiovascular risk)
- Introduce policy simulation tools for planners and councils
- Build a public API for researchers and developers
- Mobile-friendly deployment for renters, buyers, and communities
NSI is designed to become a long-term urban health intelligence platform, not just a one-off project.


Log in or sign up for Devpost to join the conversation.