-
-
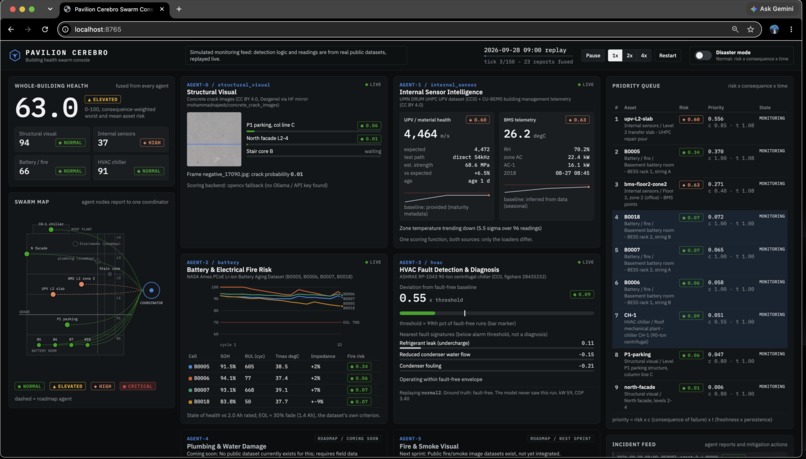
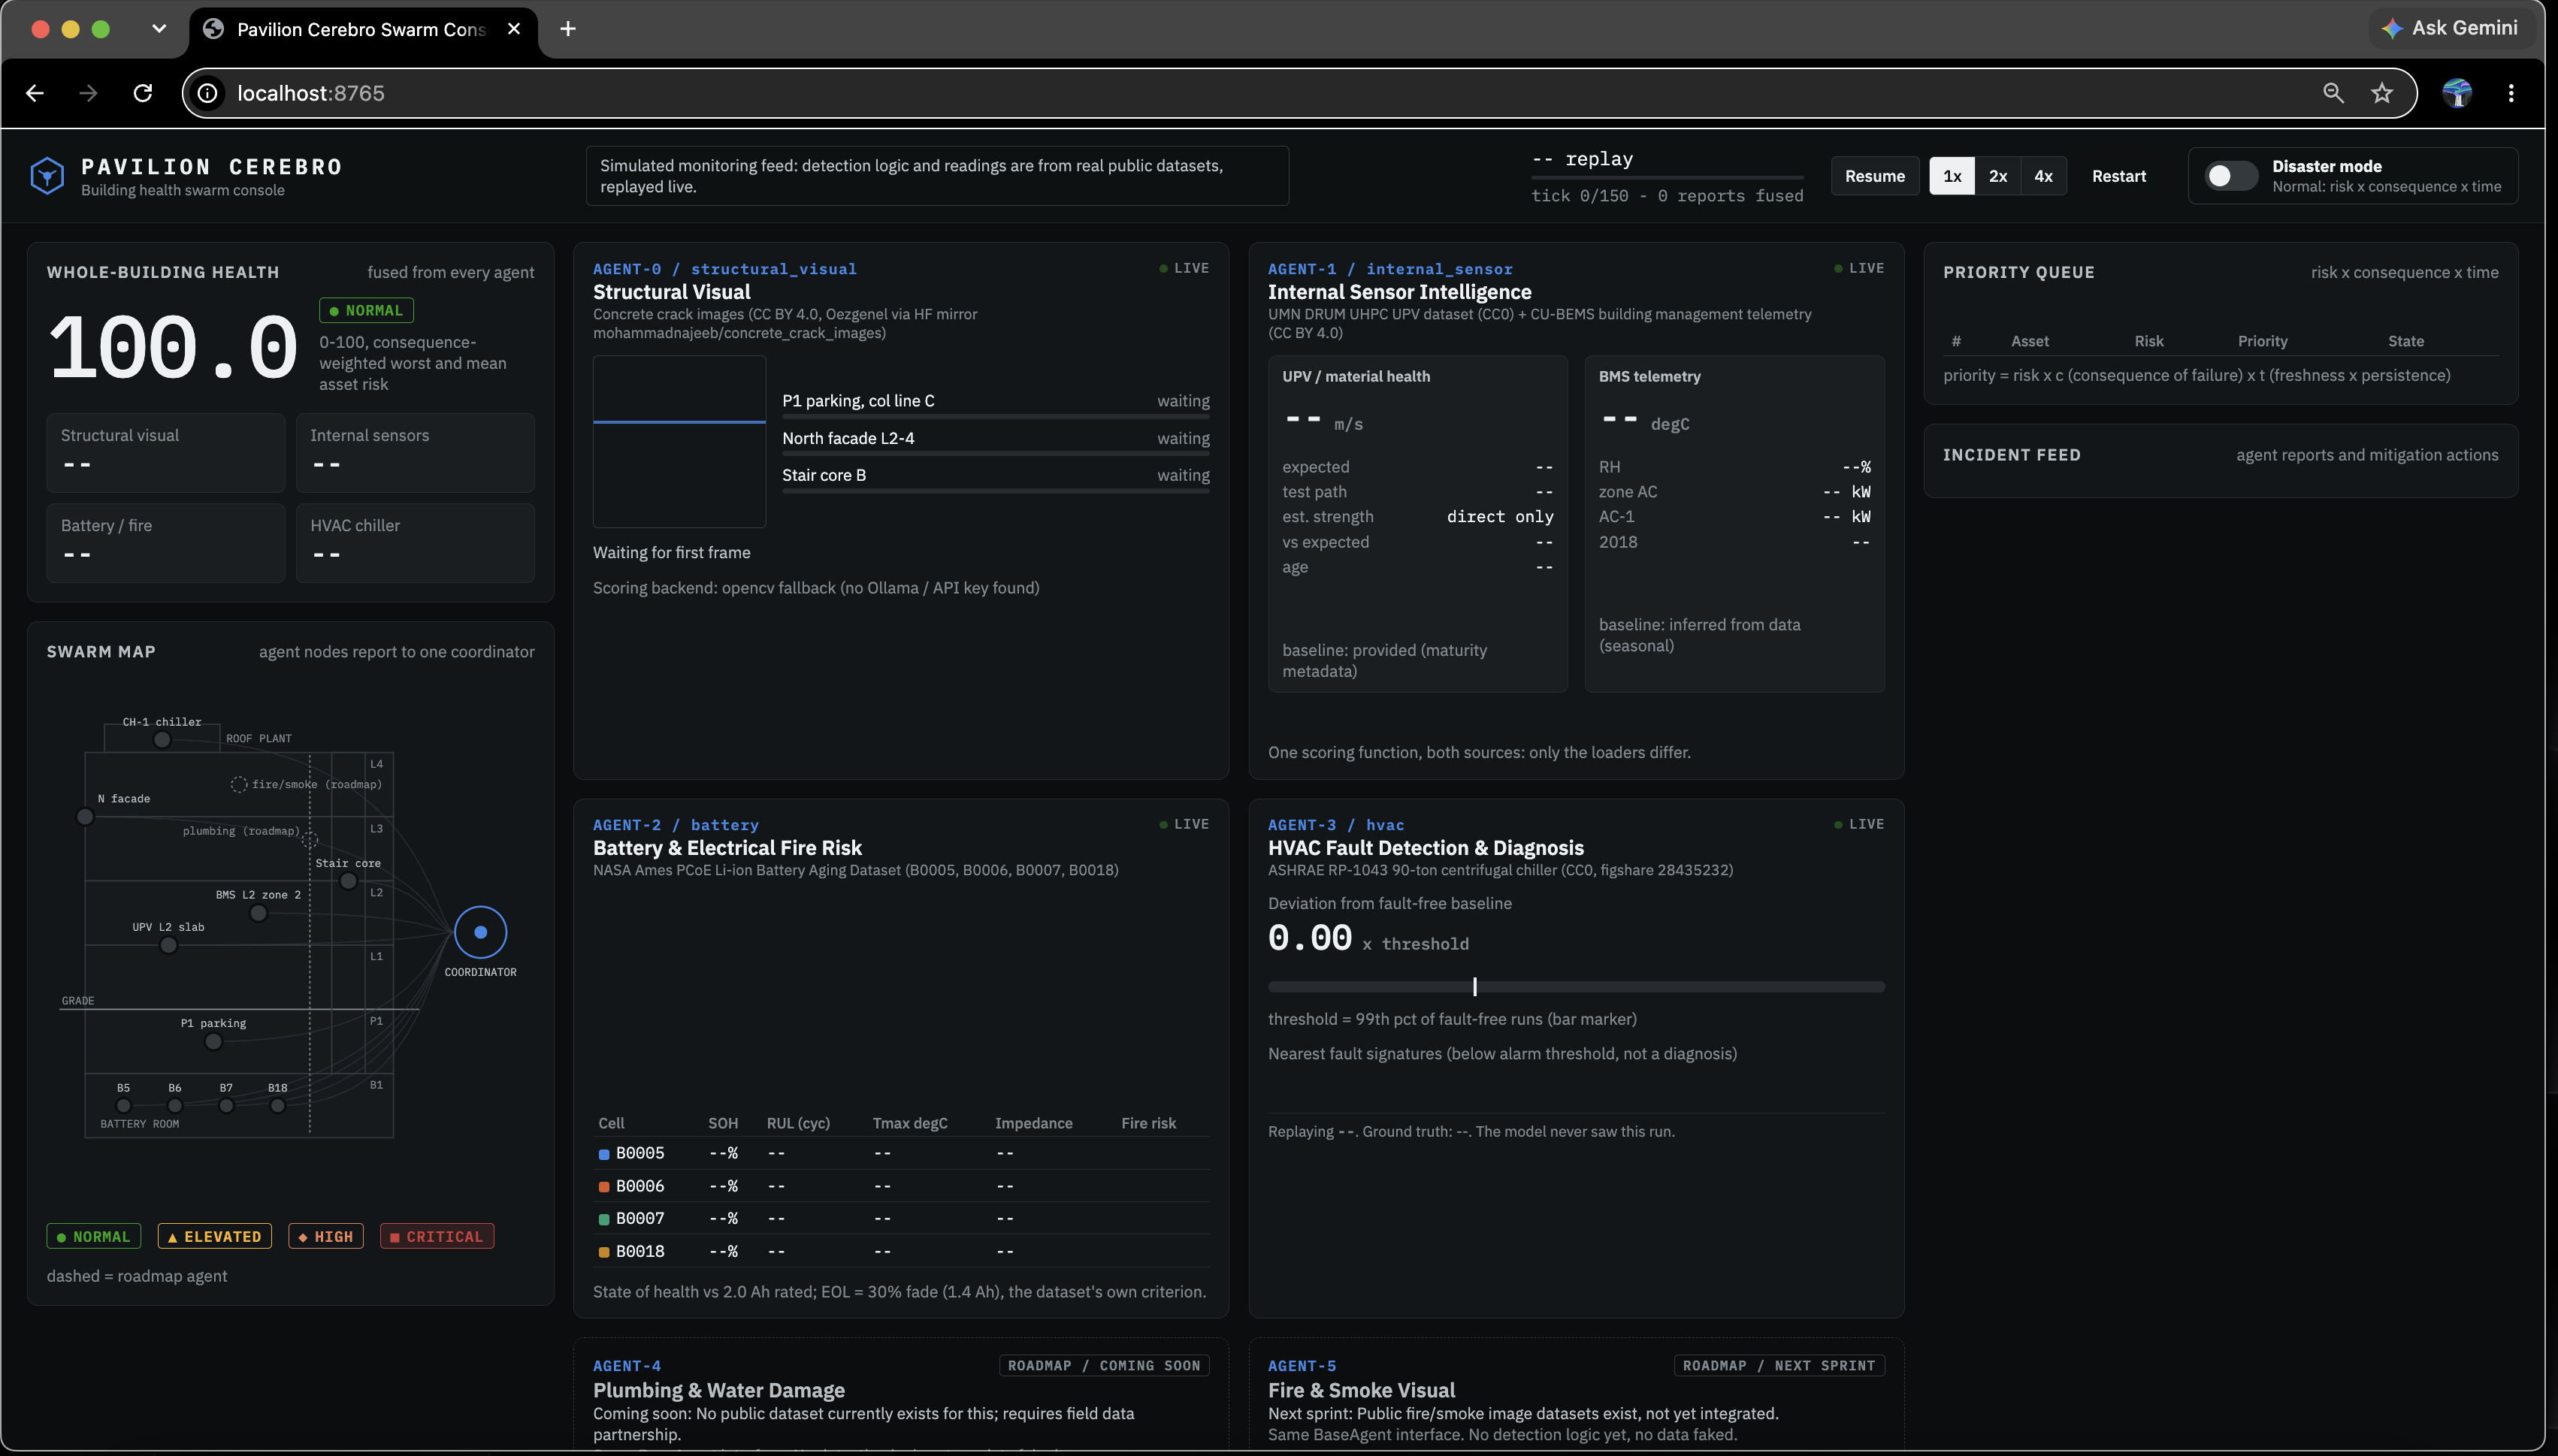
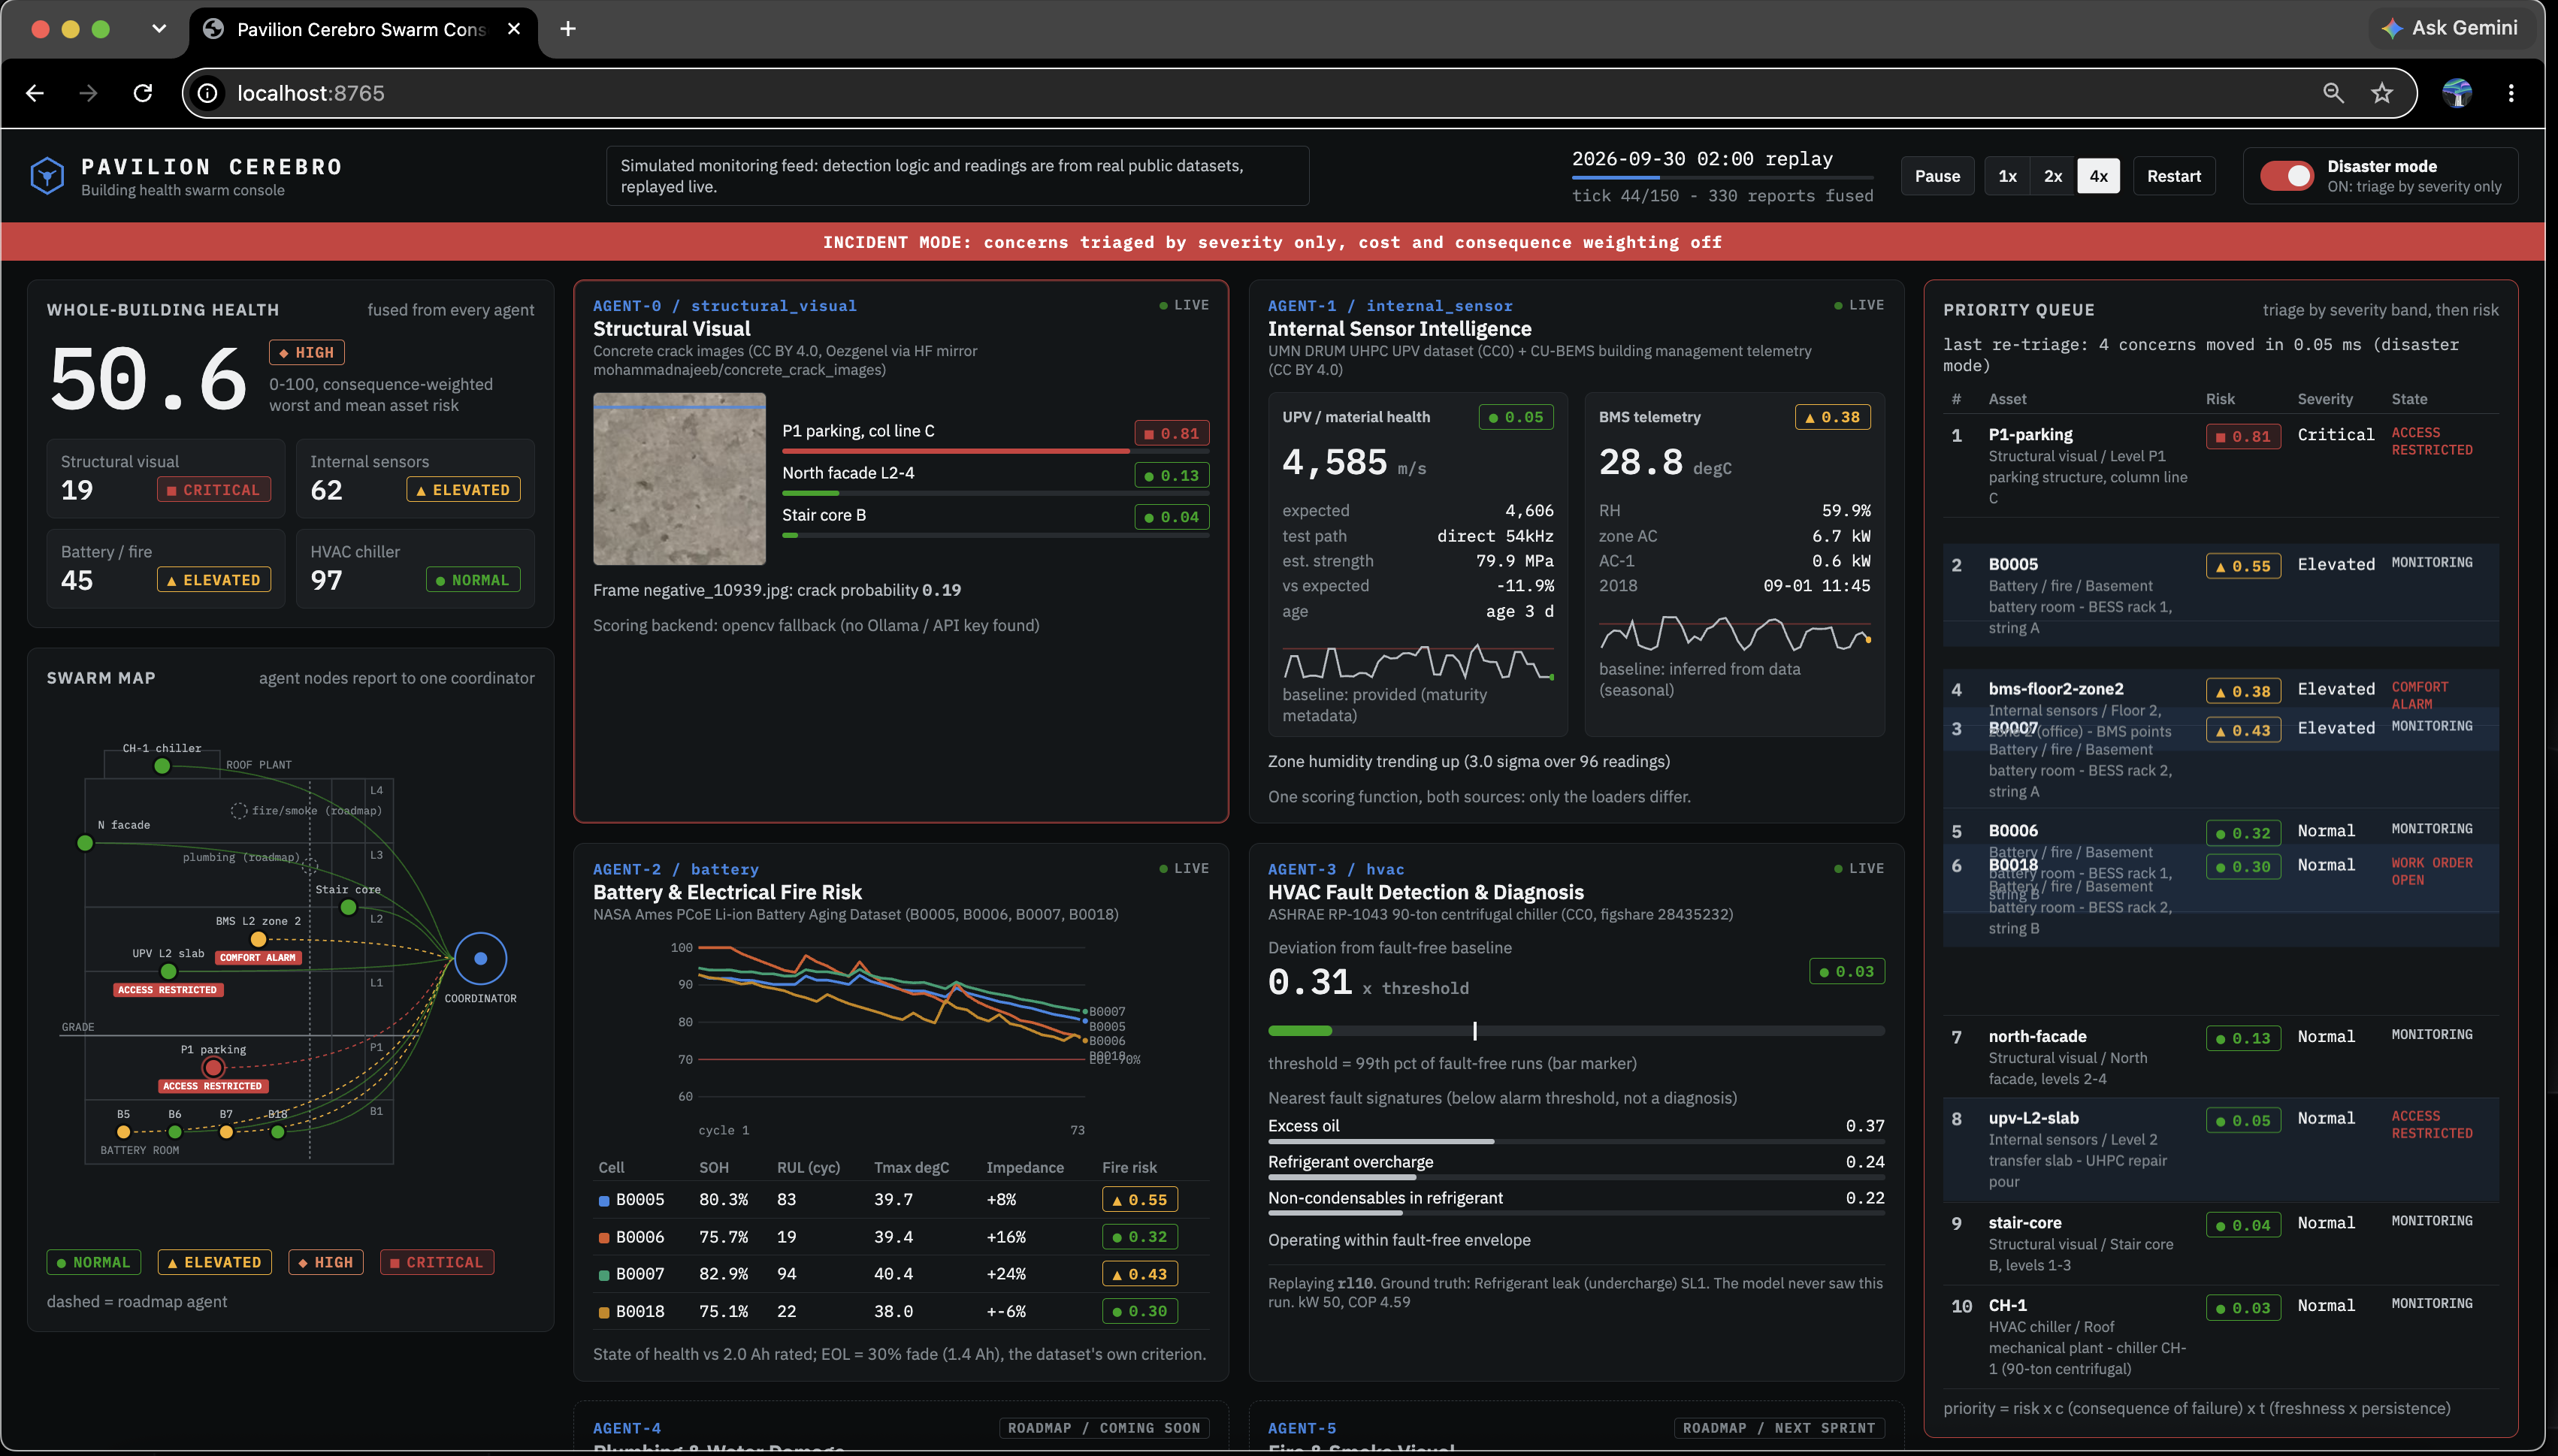
Initial dashboard
-
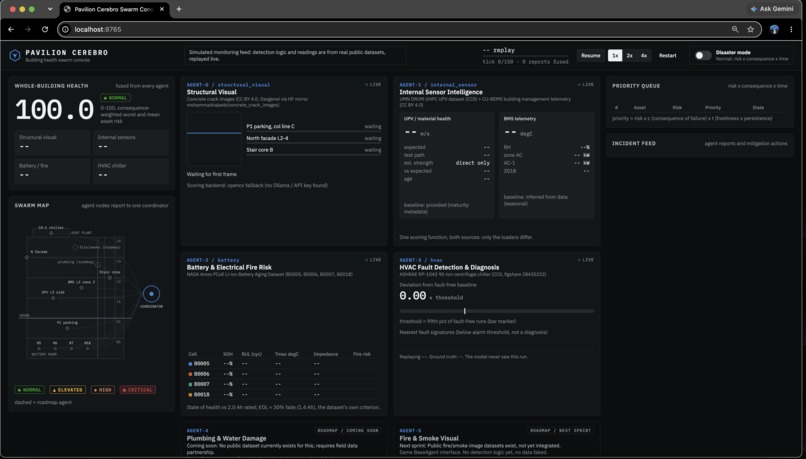
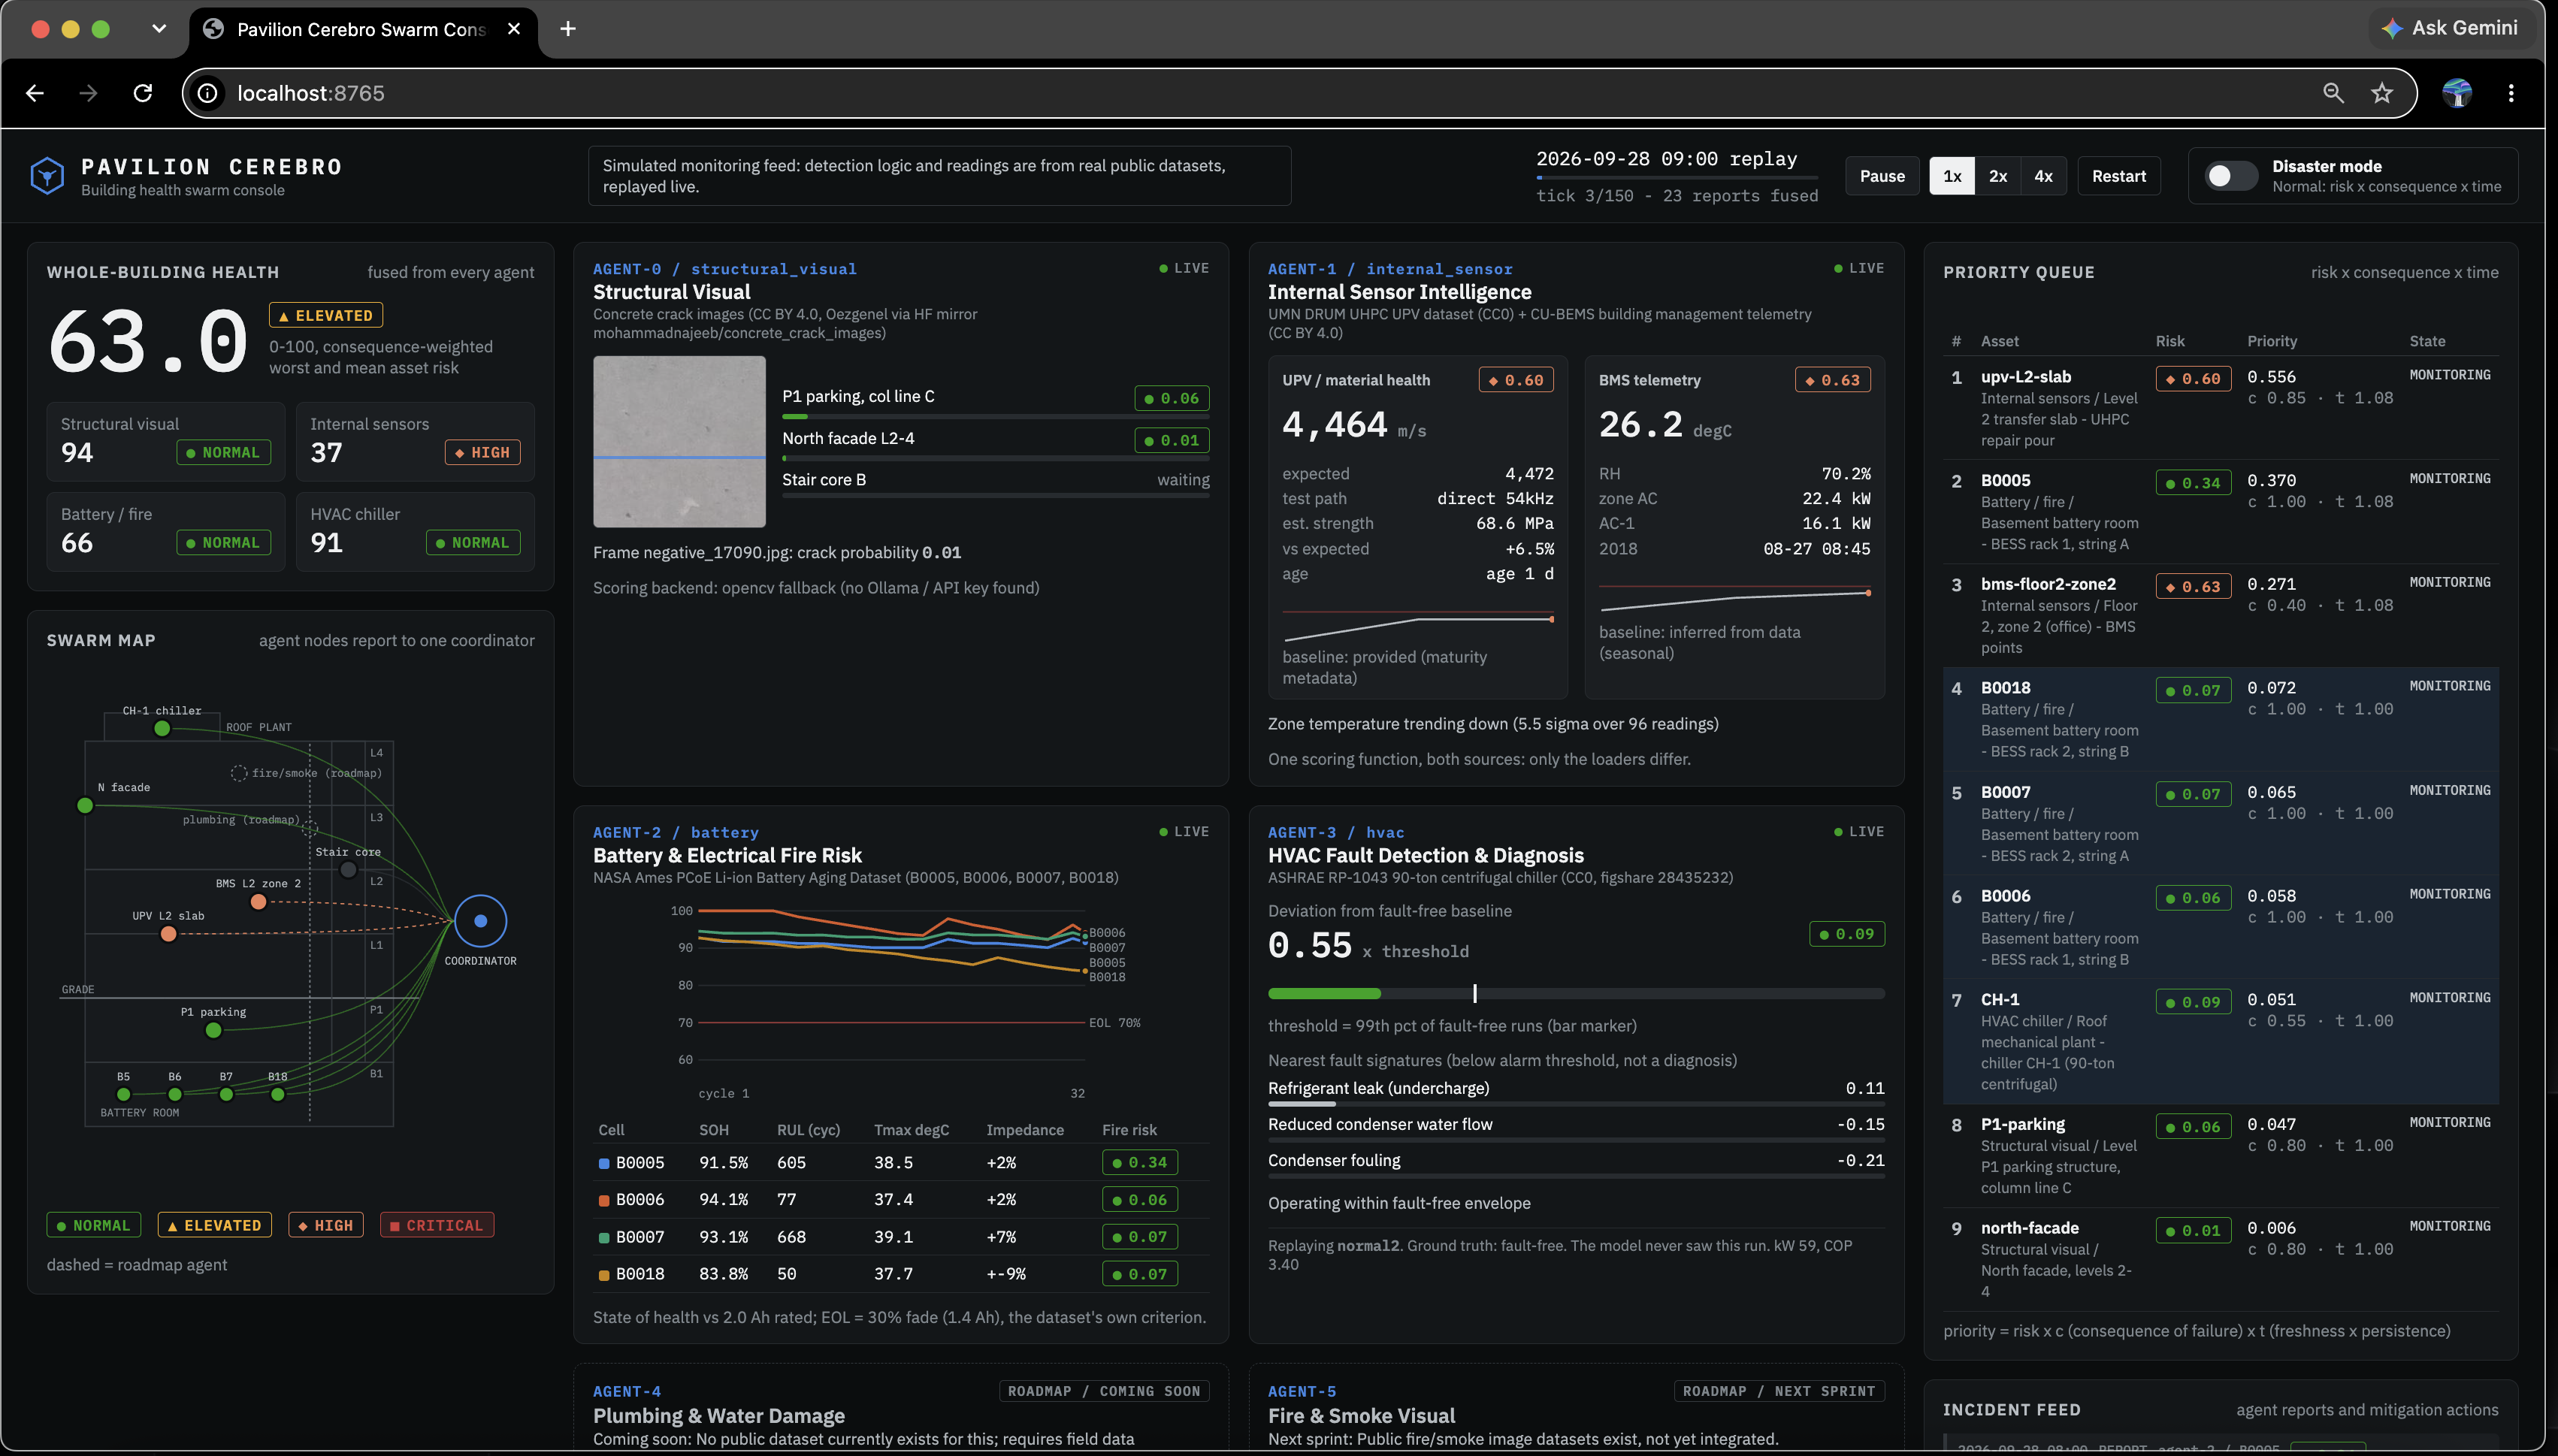
Functioning dashboard simulating 150 hours
-
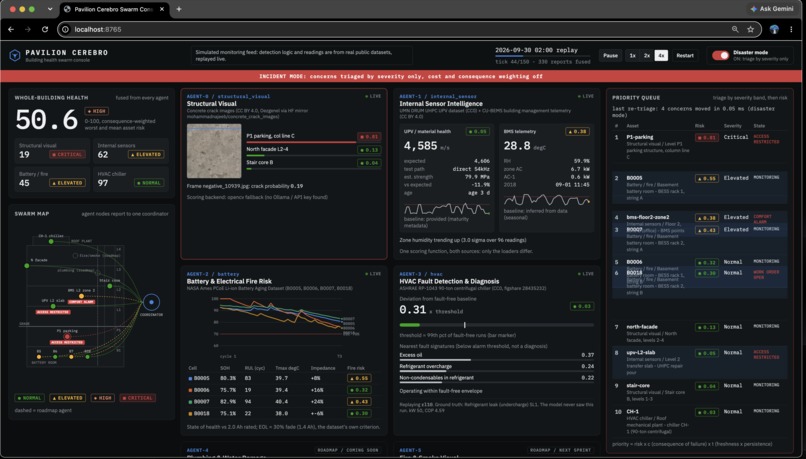
Disaster mode - priority queue
-
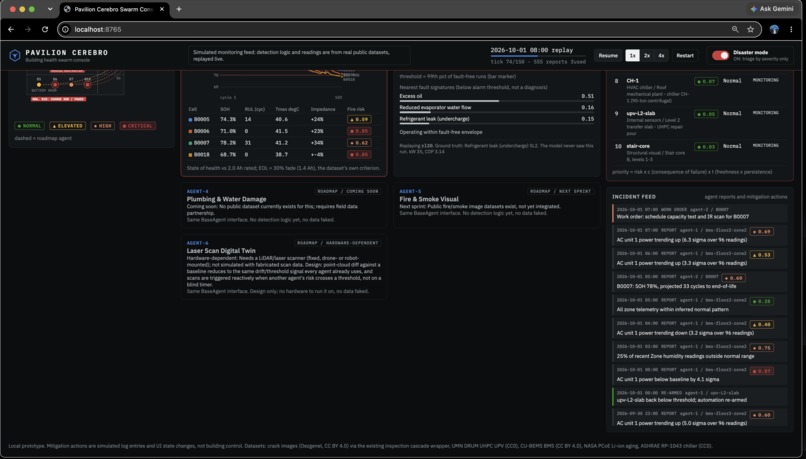
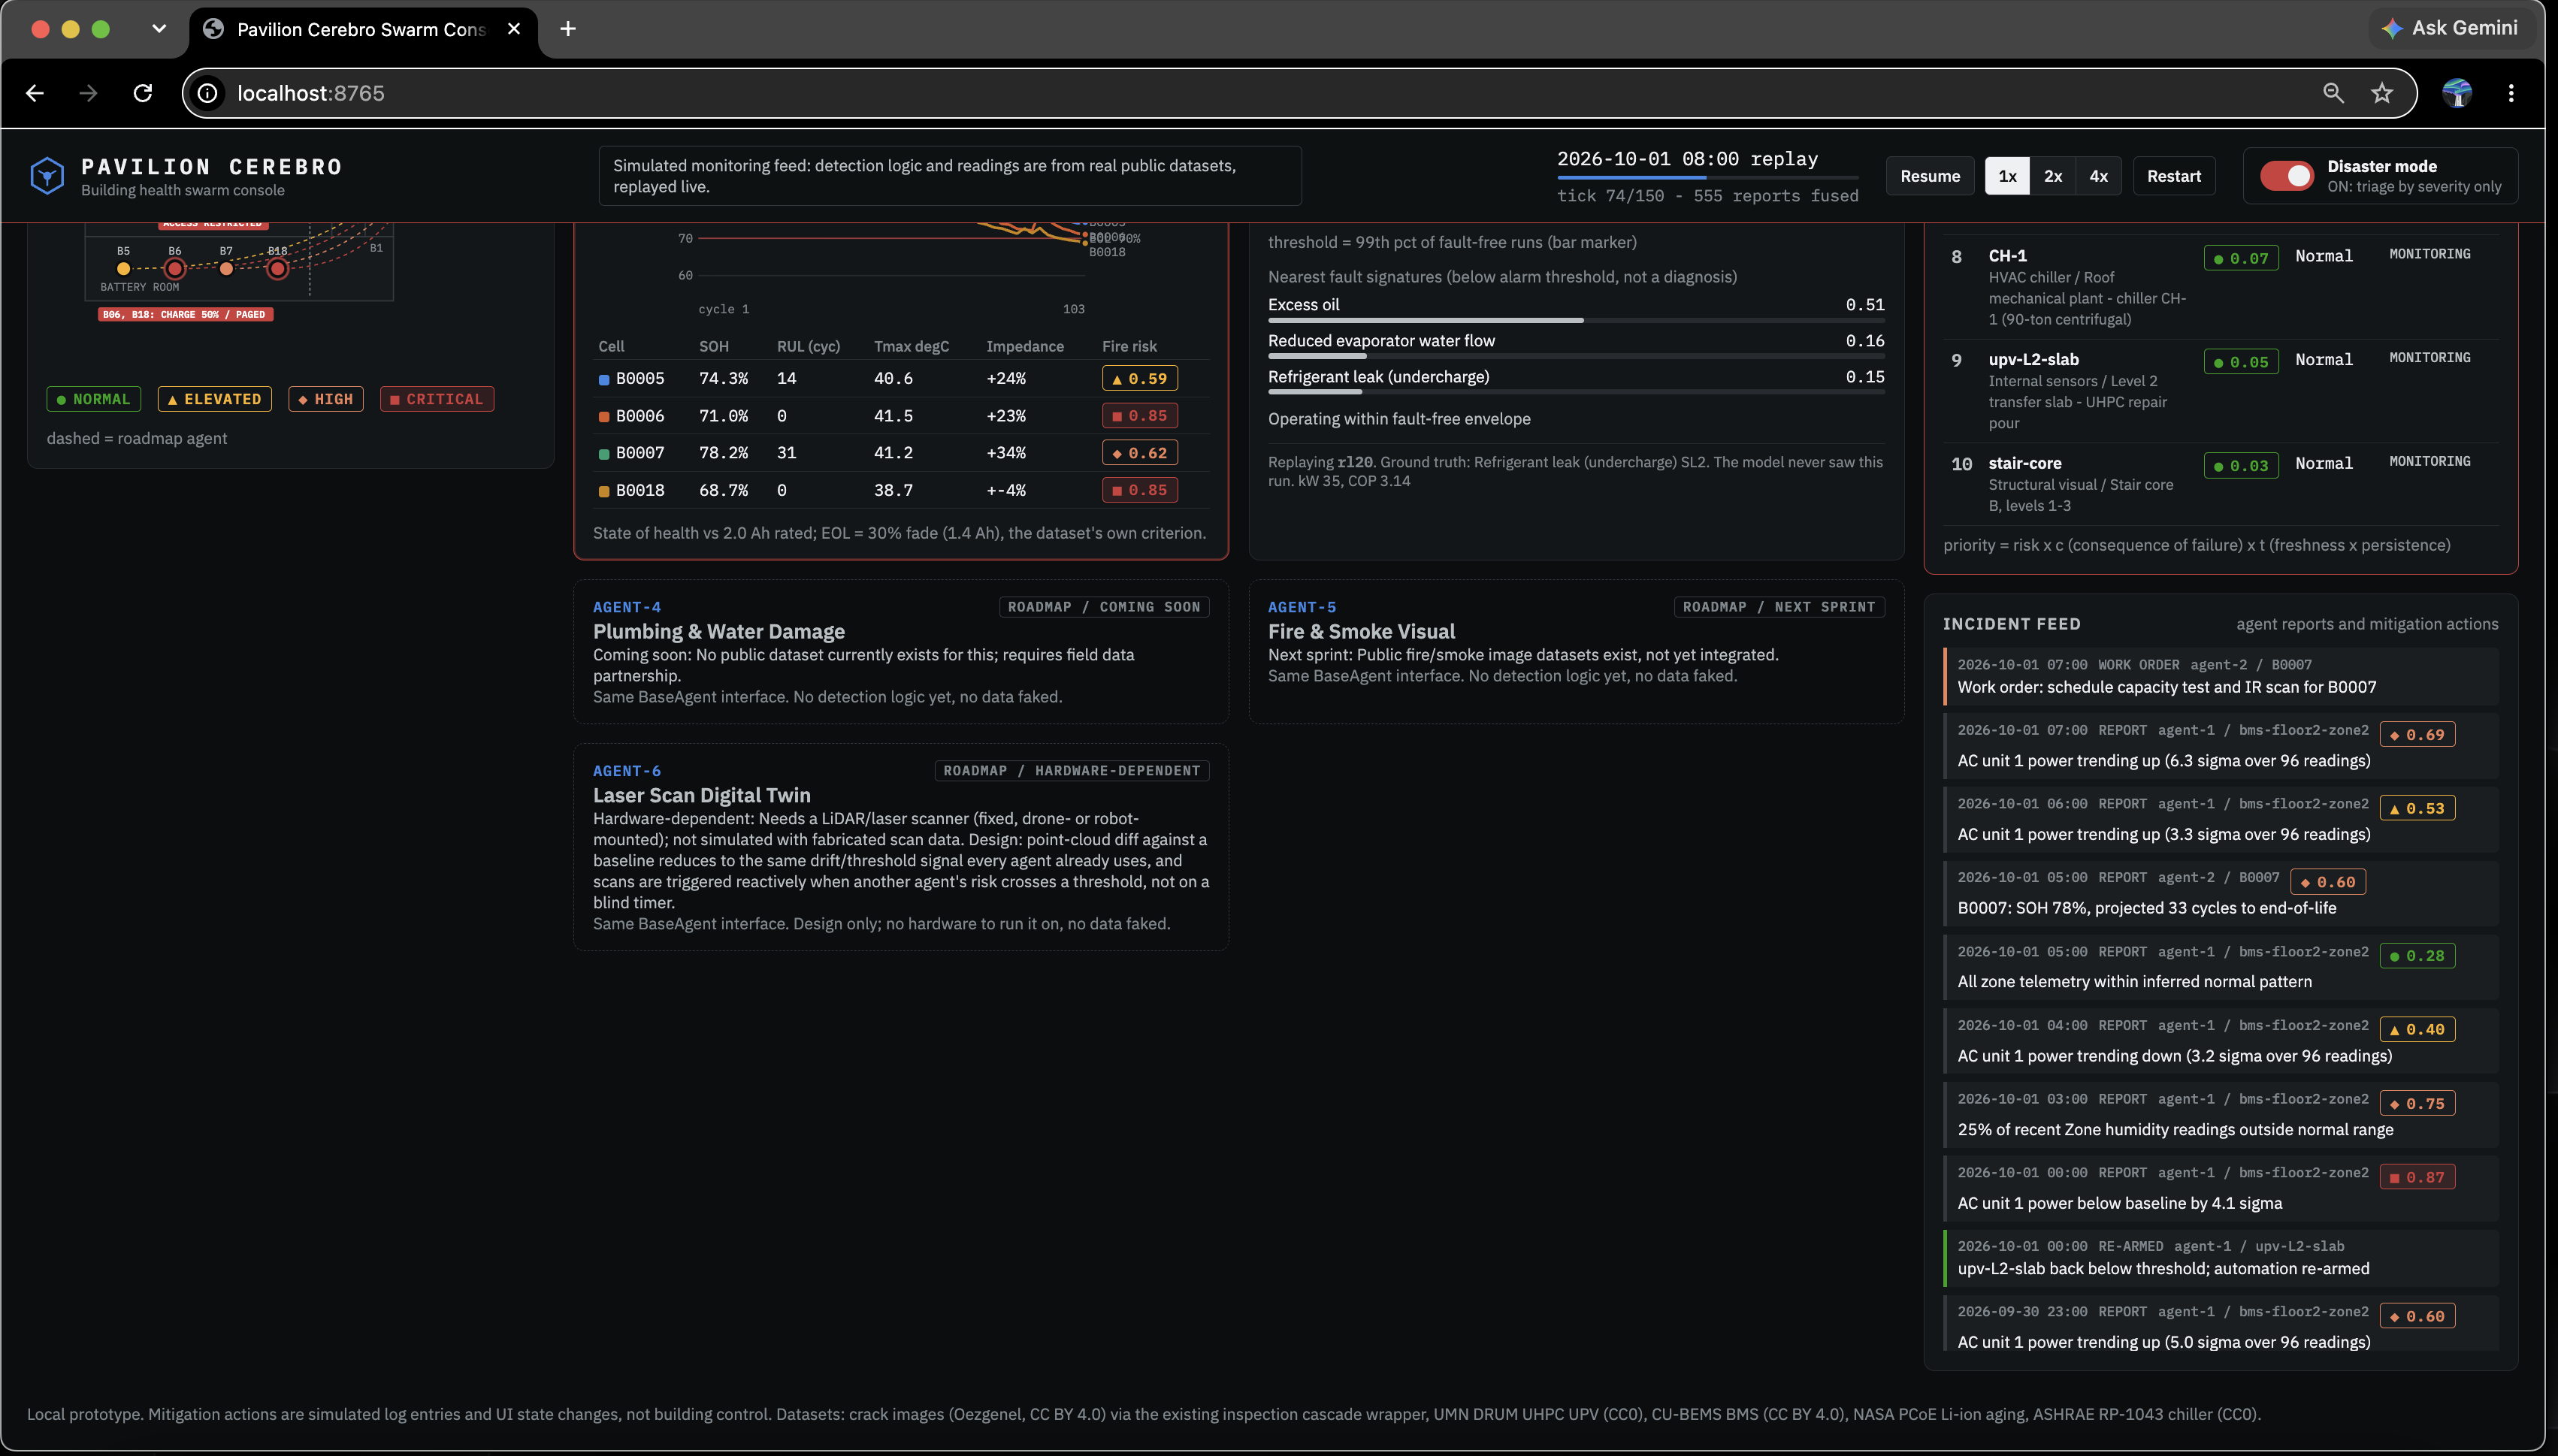
Logging incident reports
-
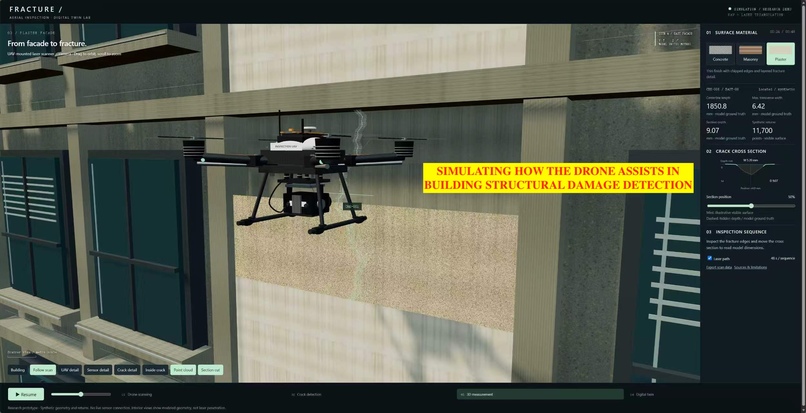
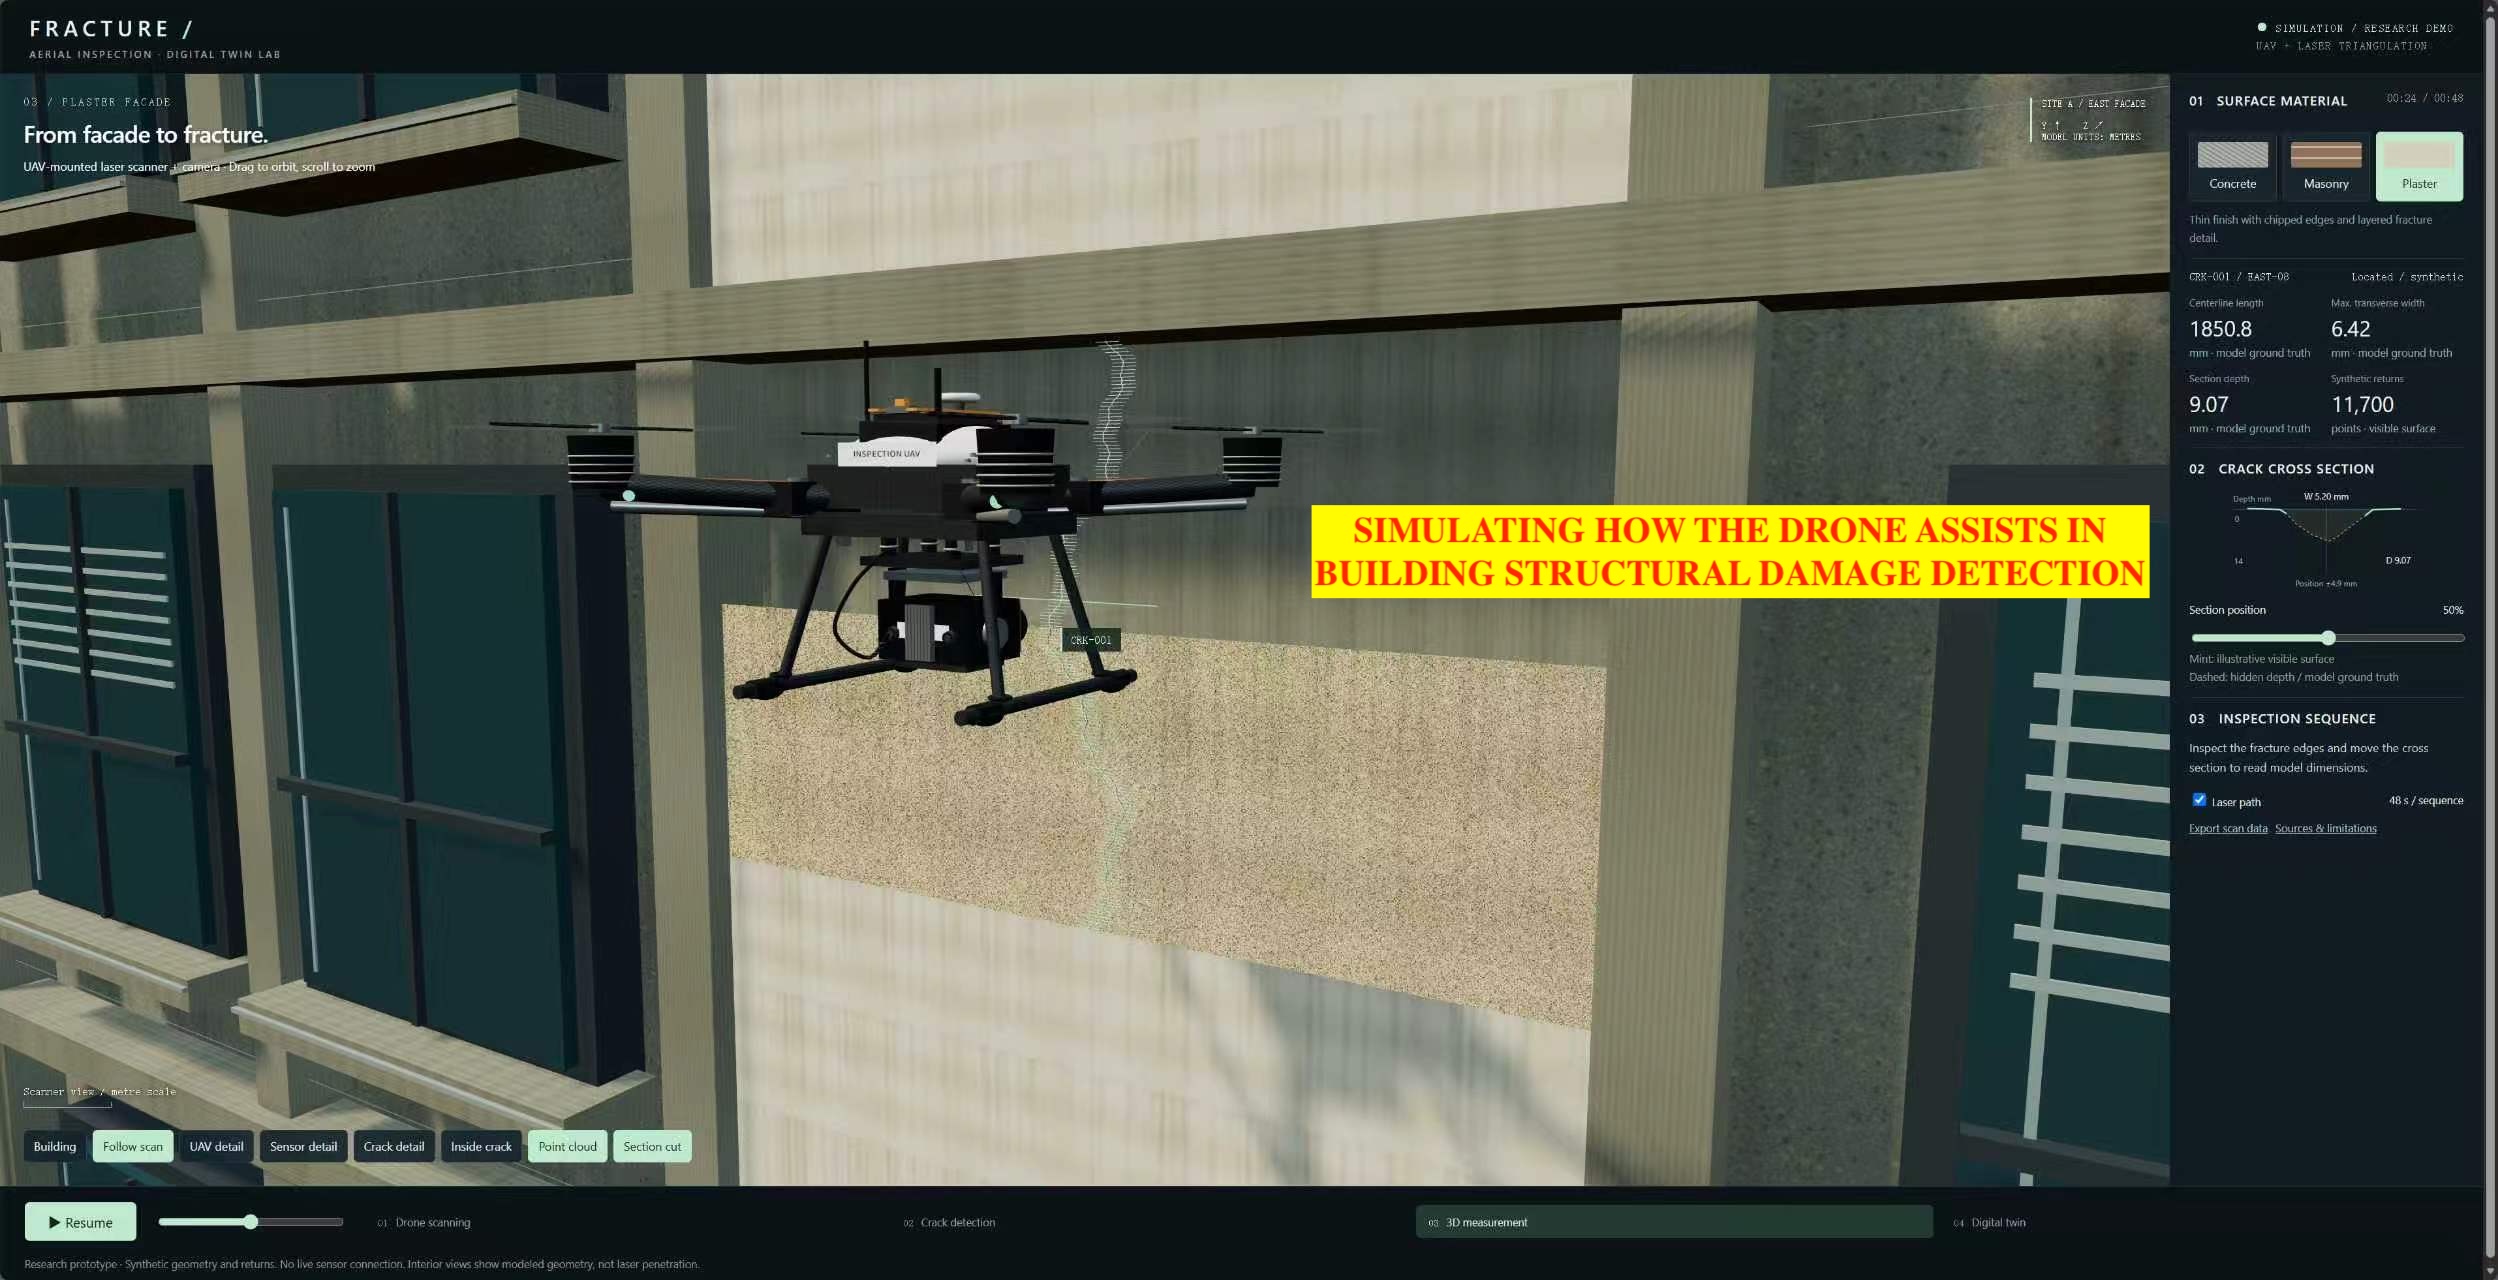
How drone captures structural damage with Laser and camera
-
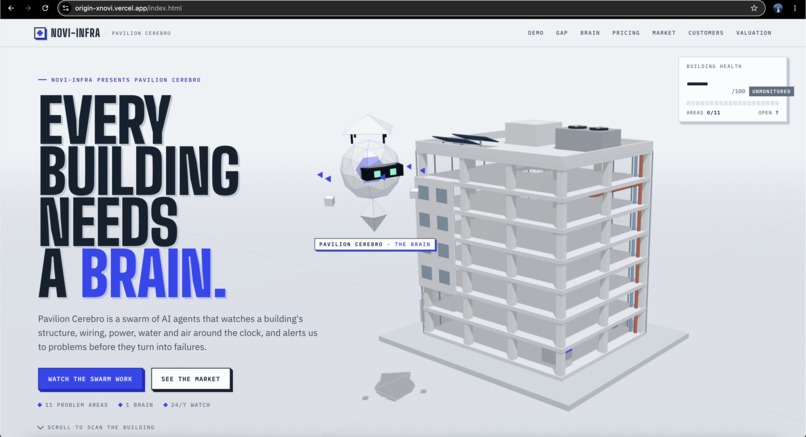
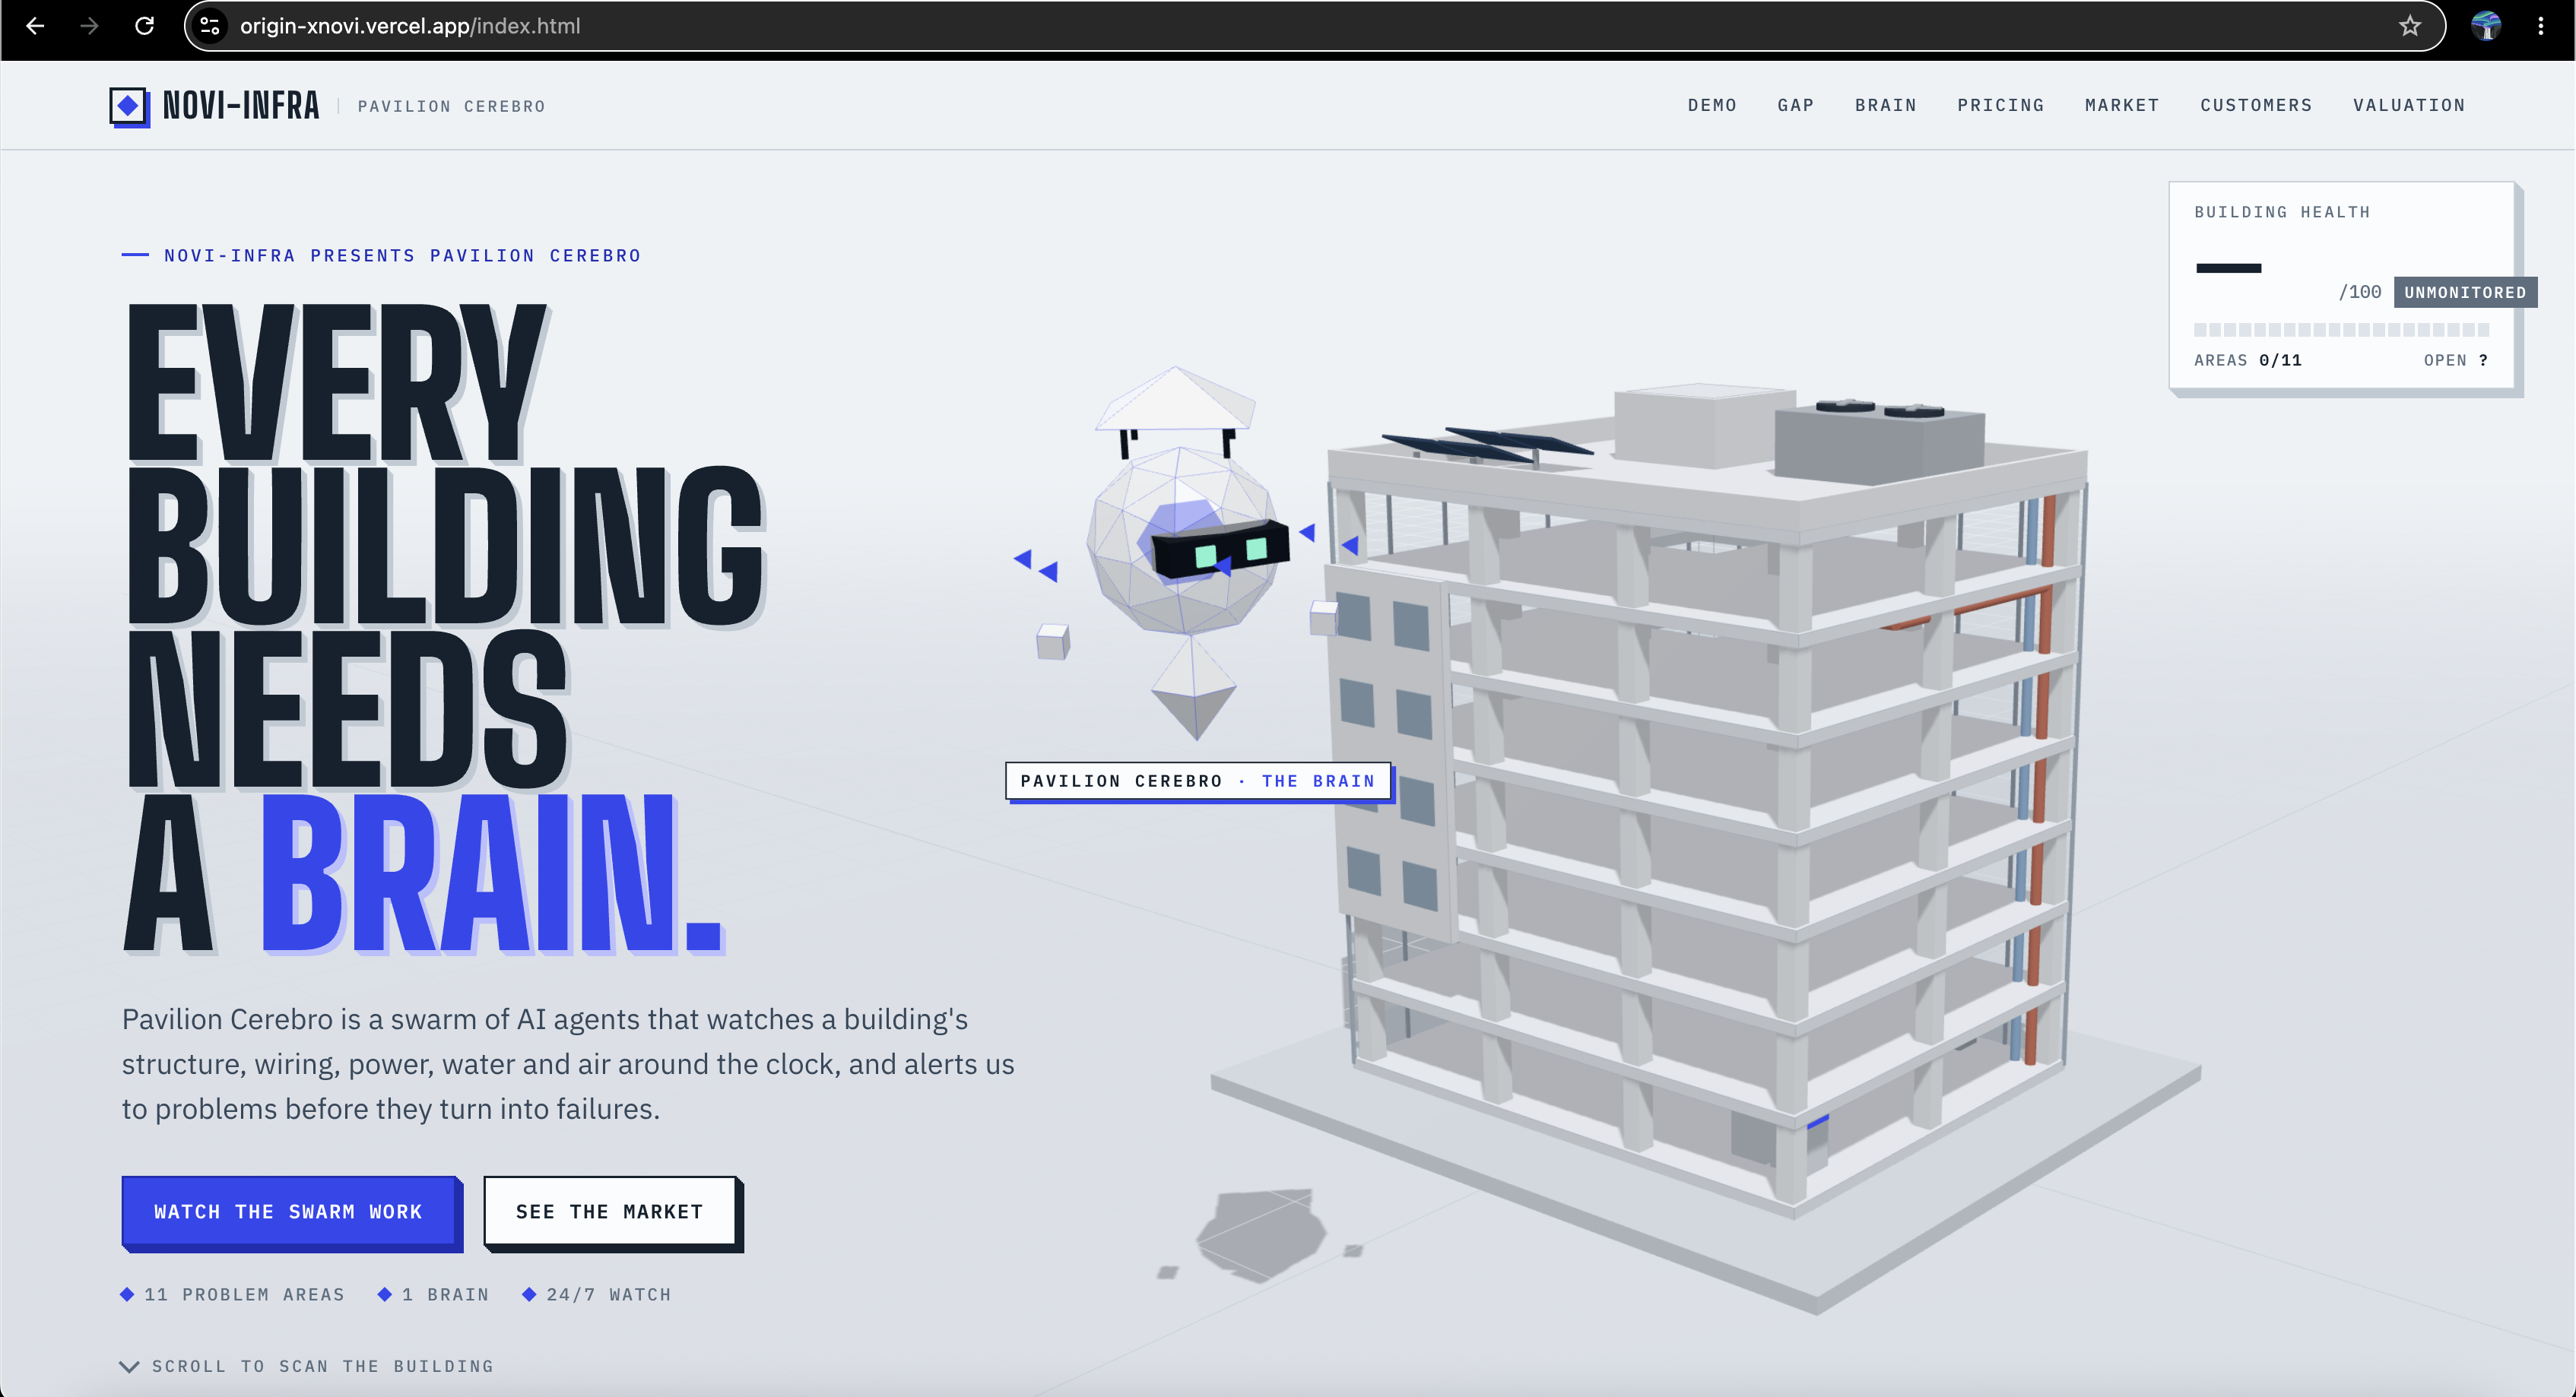
Website
-
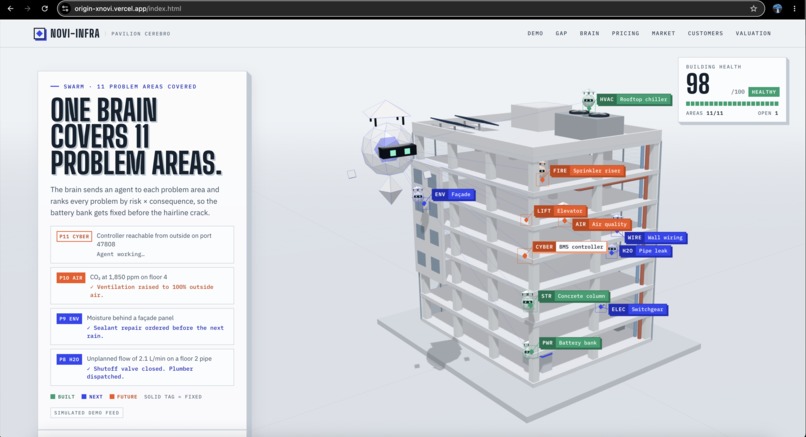
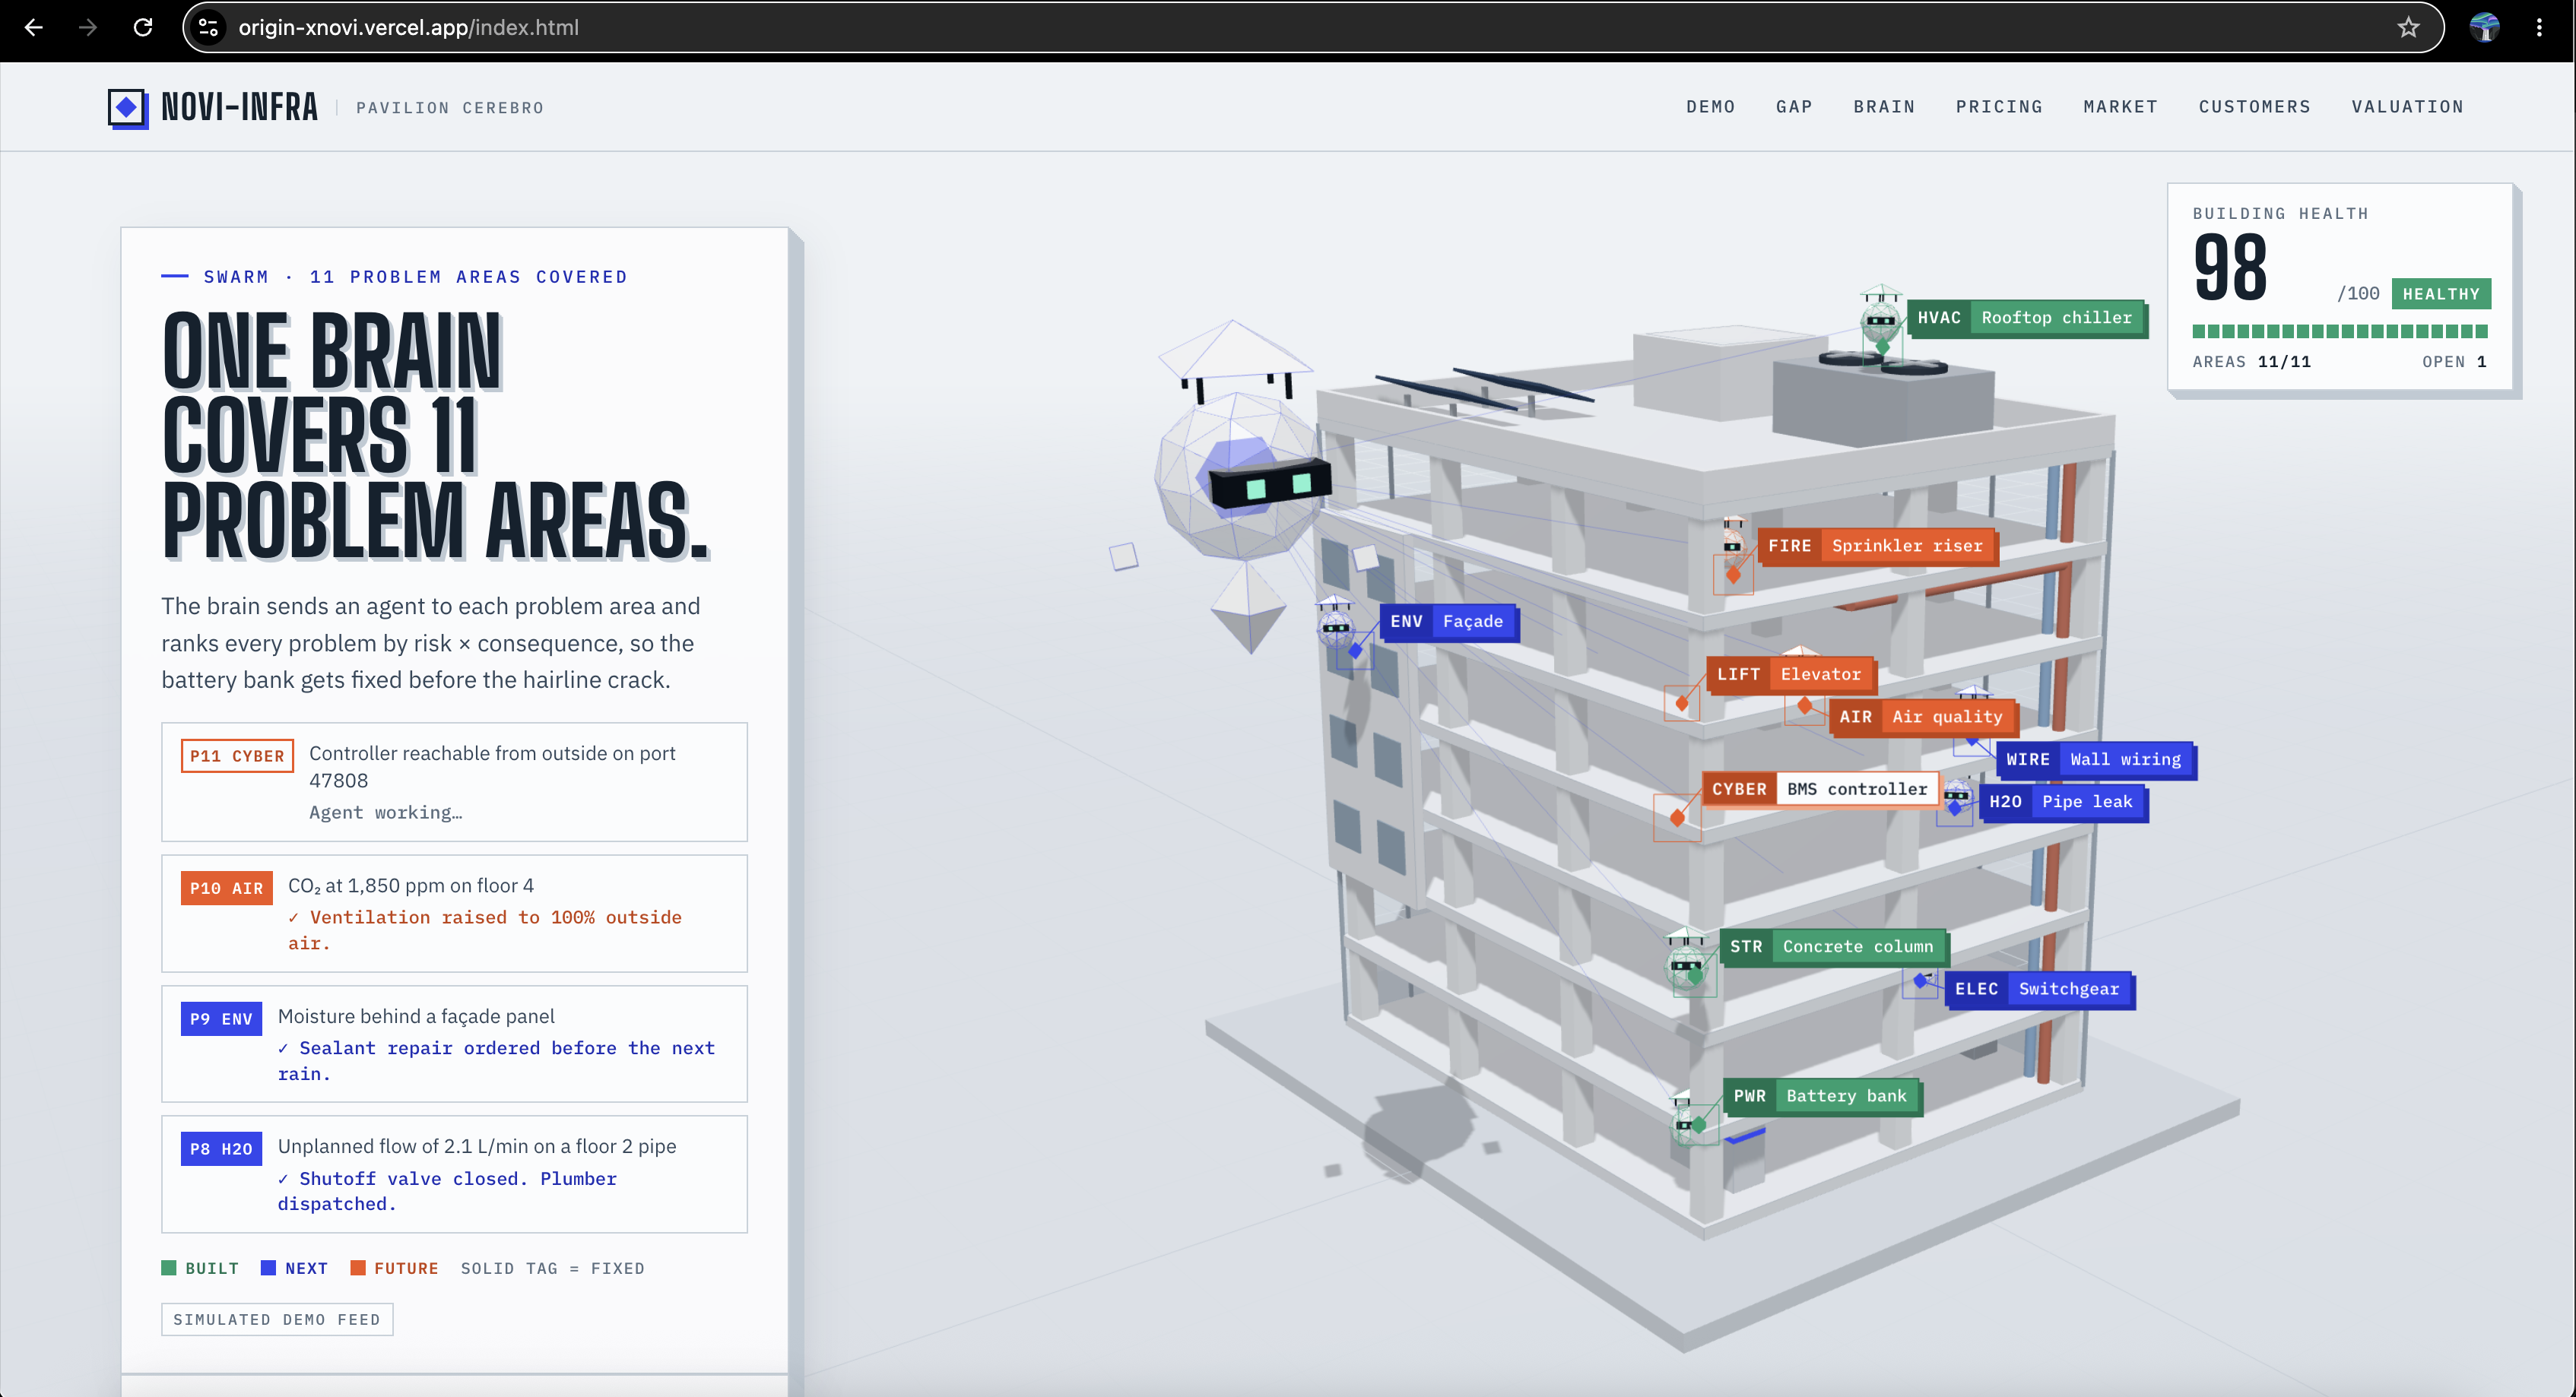
11 problem areas we focus on
-
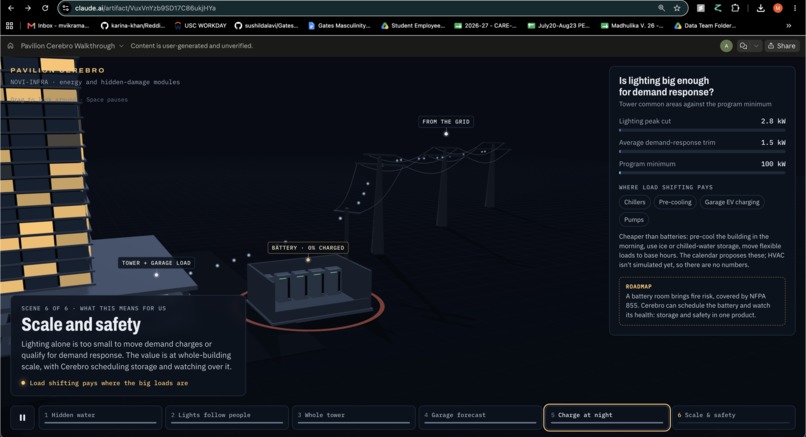
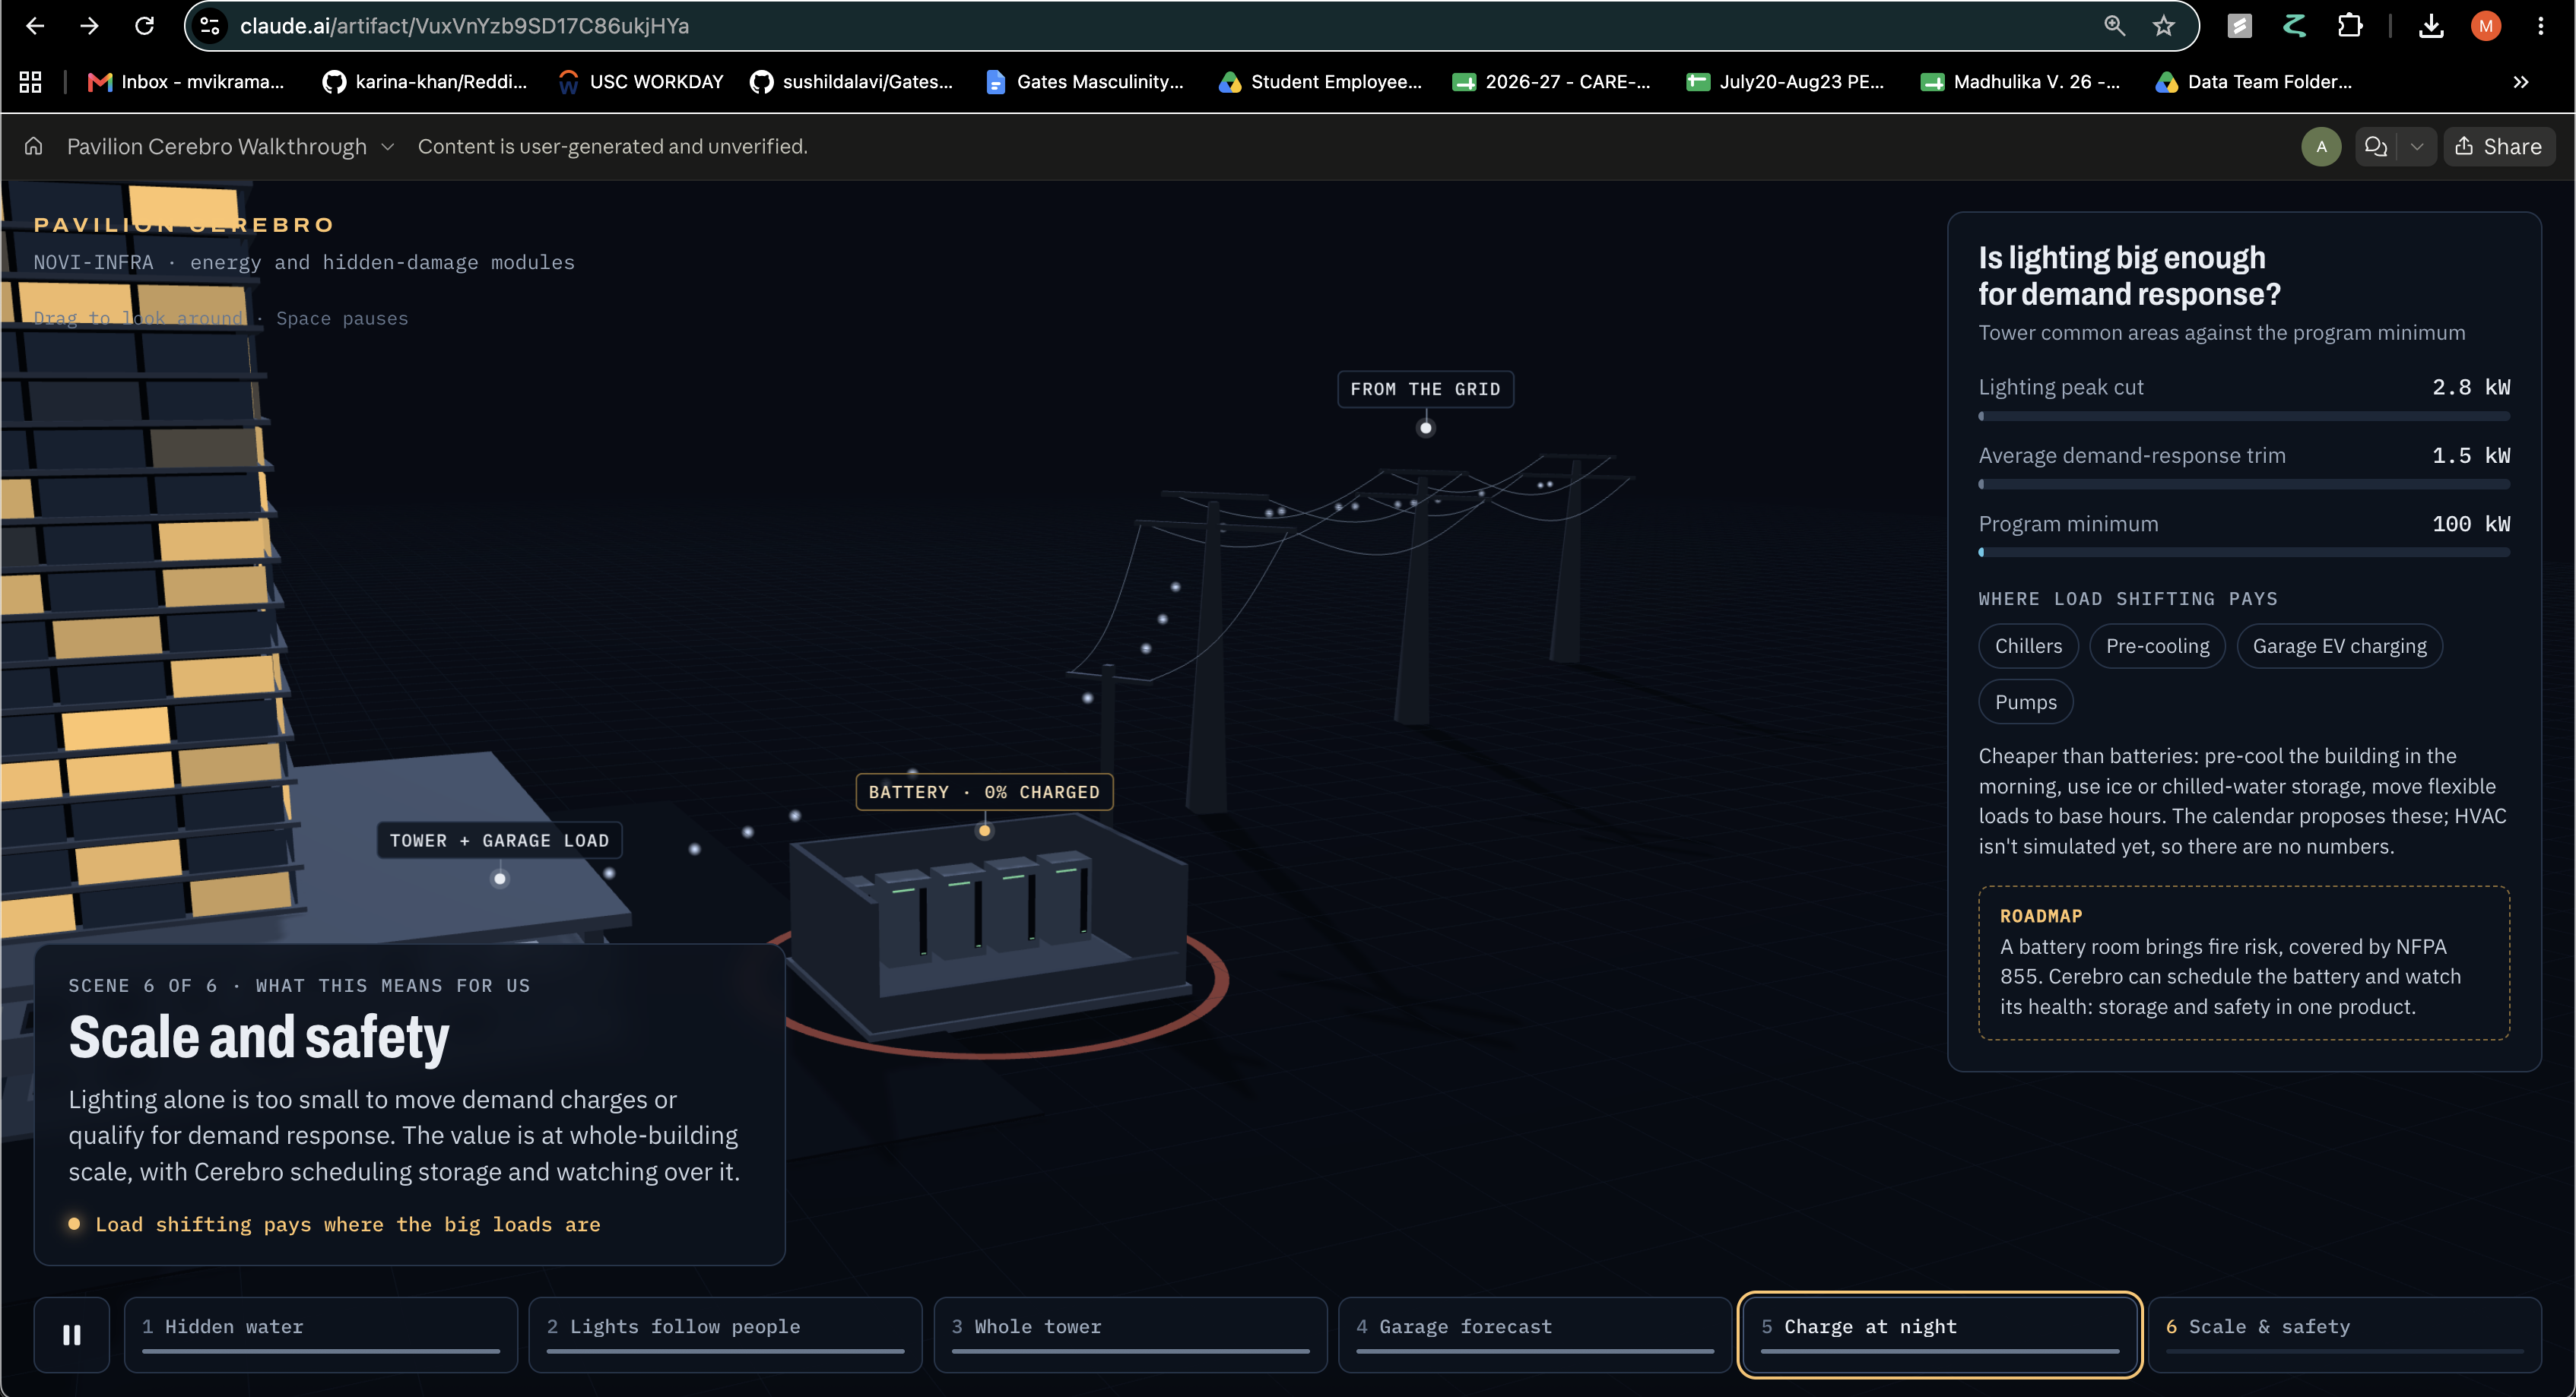
Future scope, not developed yet
-
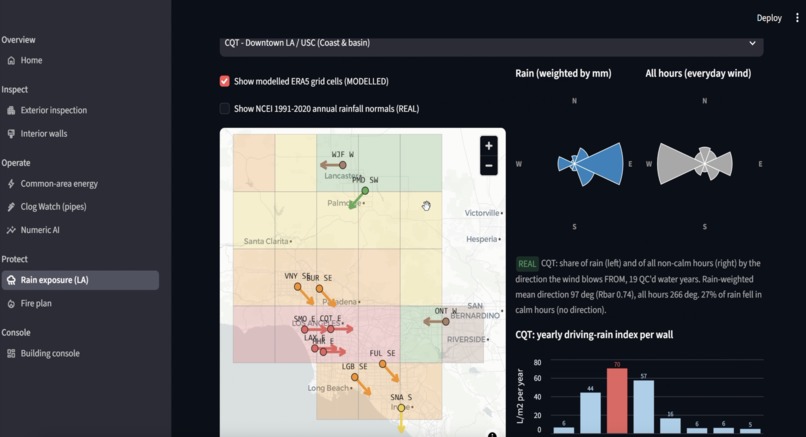
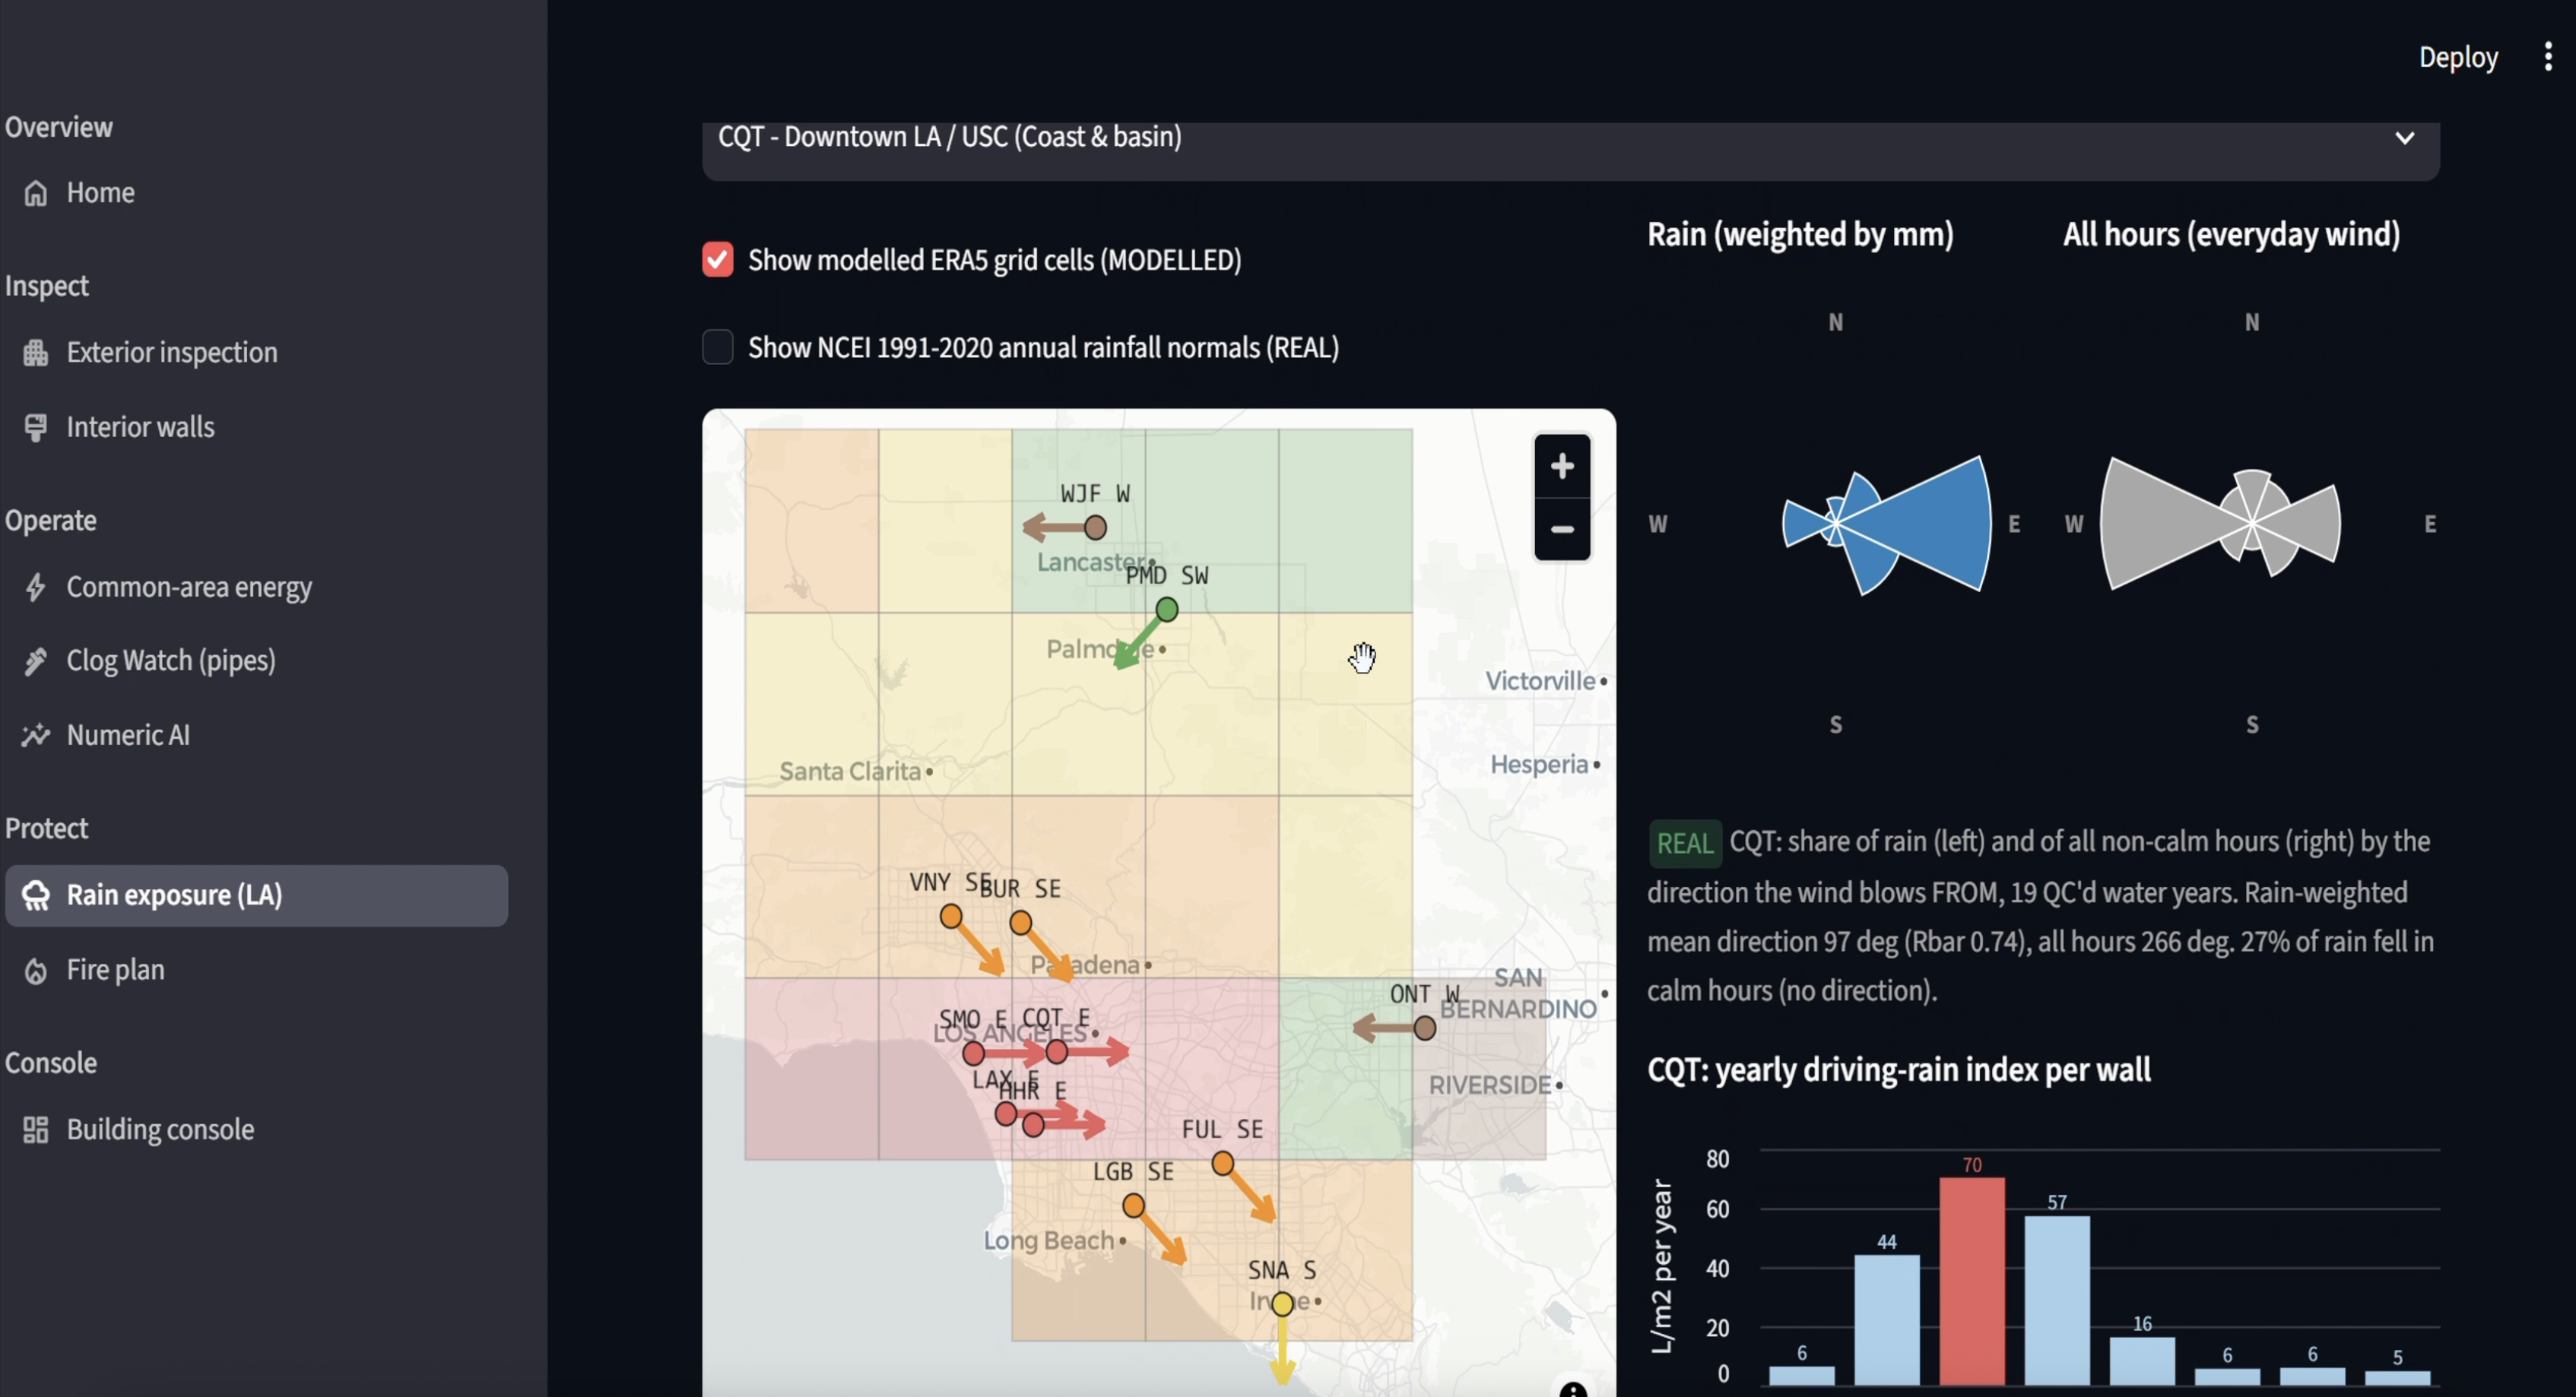
Rainfall/geographic location based potential for damage
-
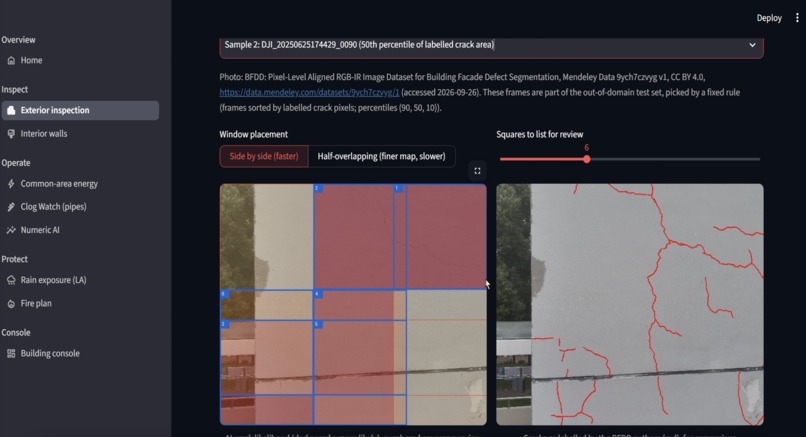
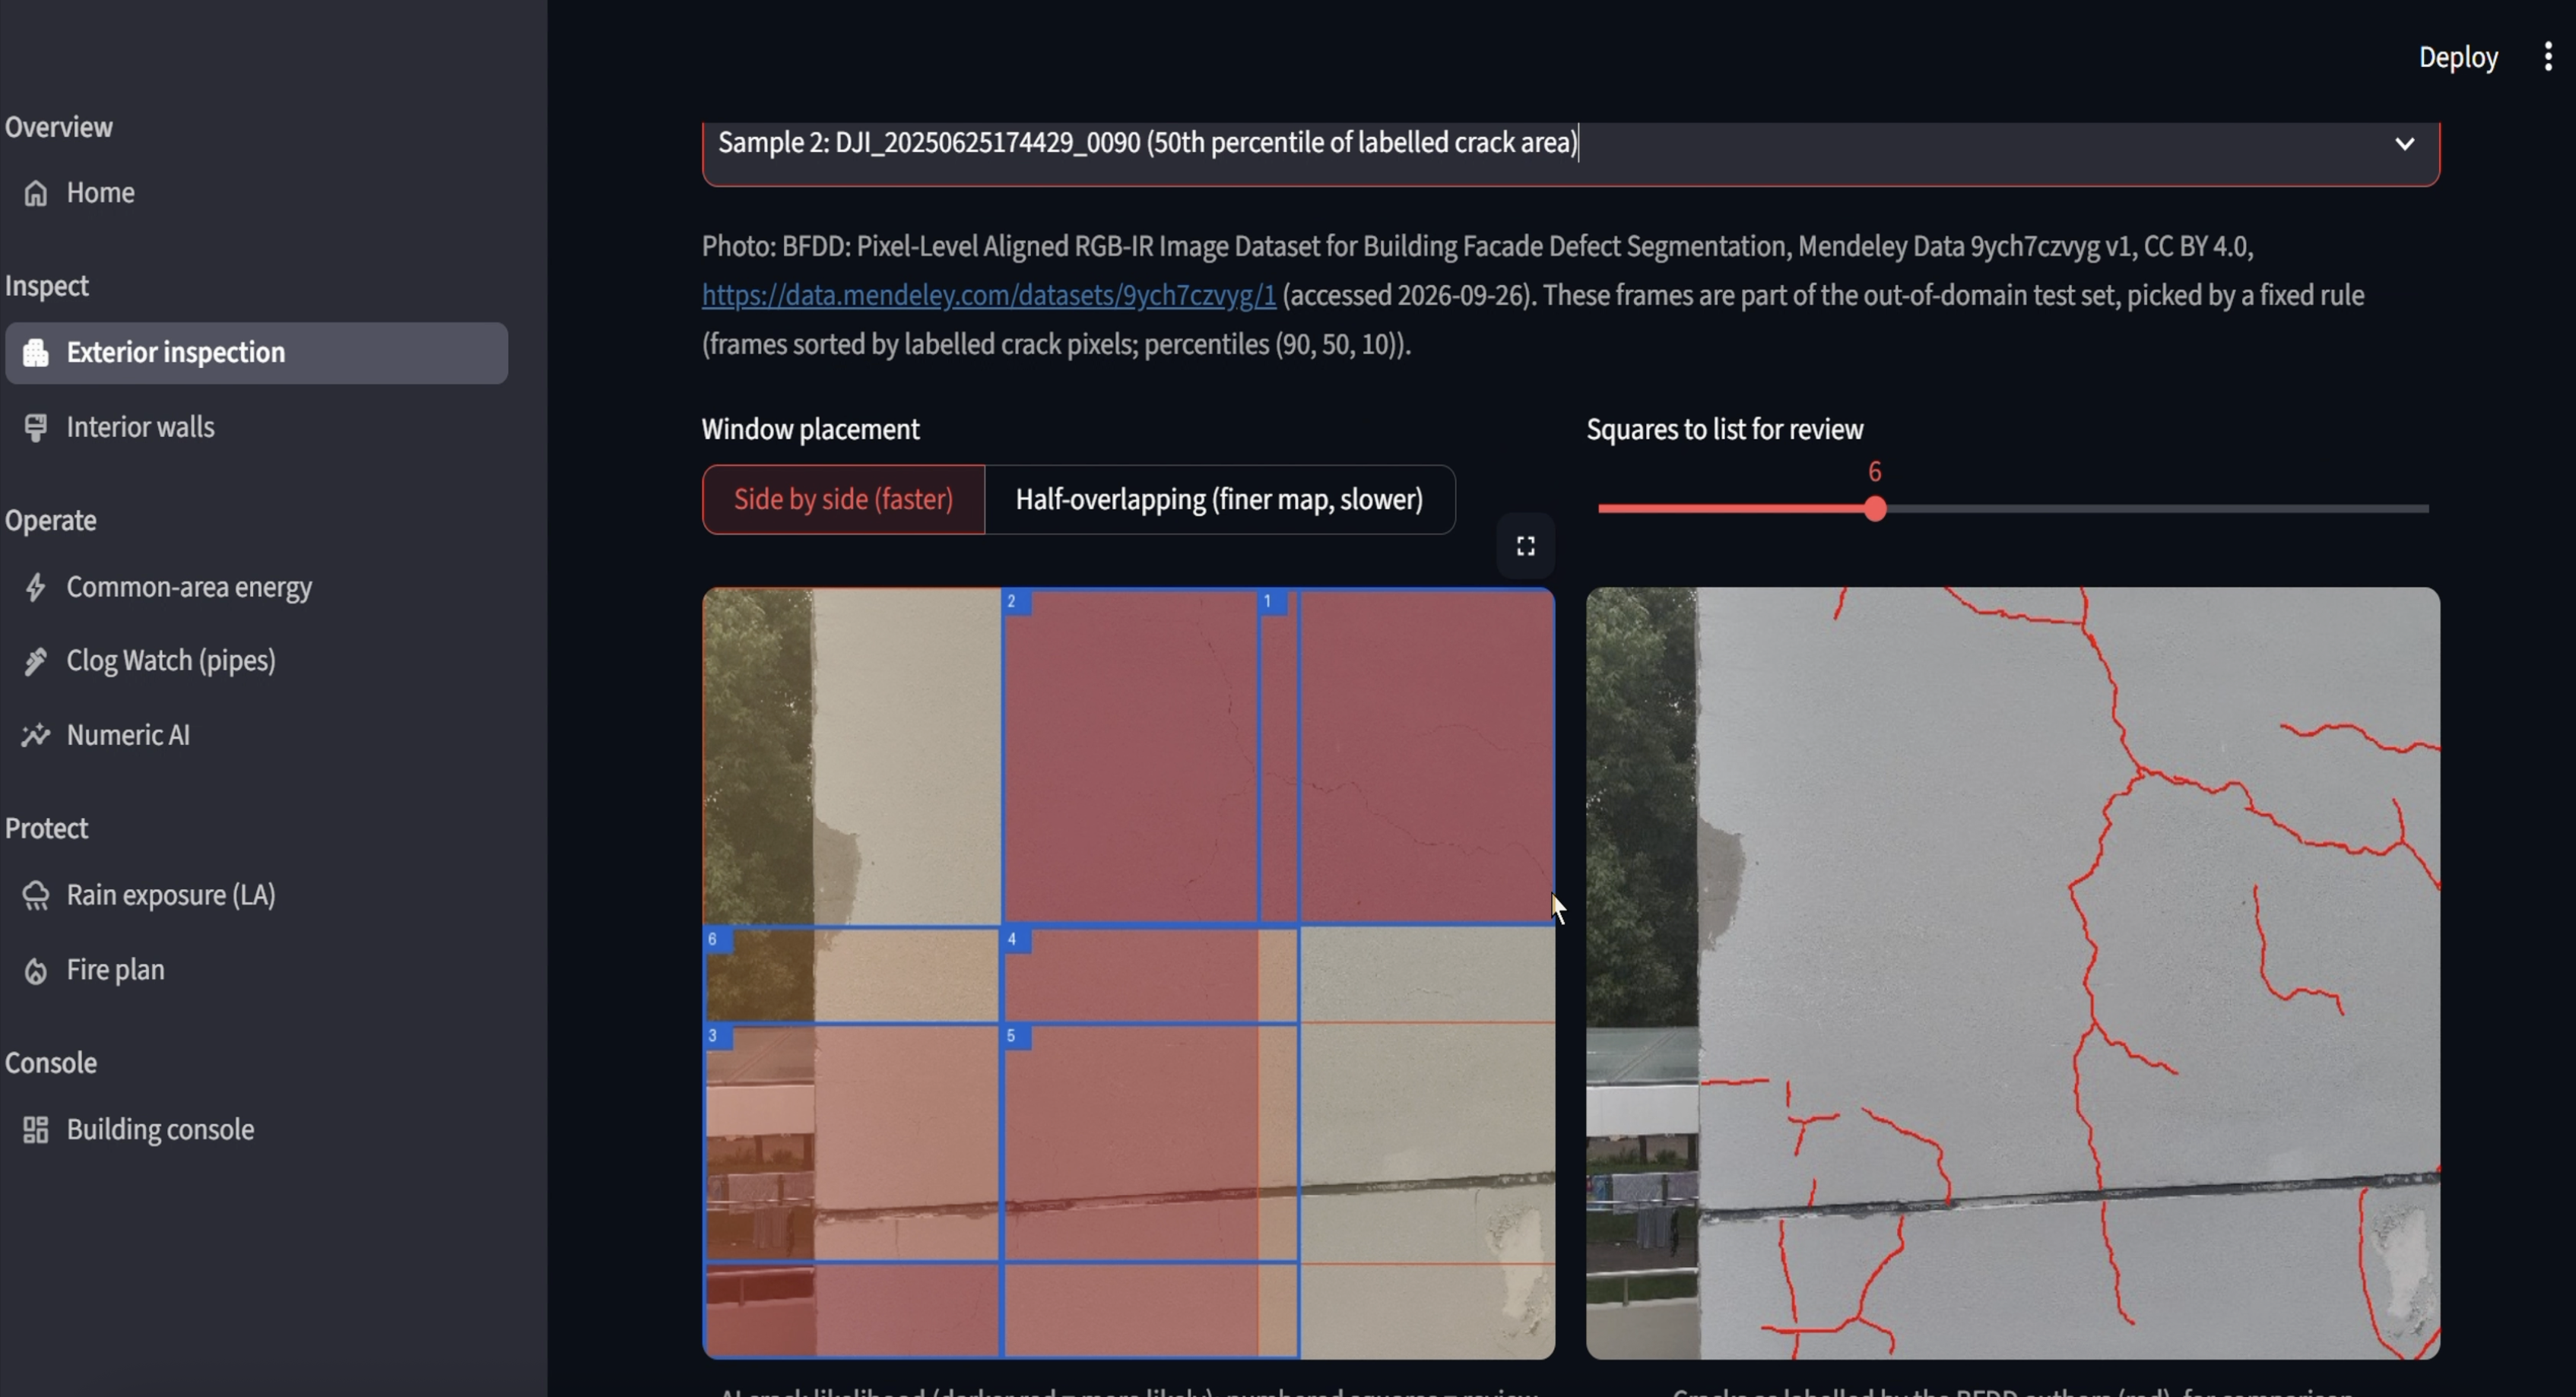
Crack/exterior damage detection
Inspiration
We took Prompt D: detect infrastructure damage before it fails, and prioritize maintenance and recovery. Before writing any code, we spoke with 11 people who work on buildings: 4 civil engineers, 3 mechanical engineers, 2 electrical engineers and 2 architects.
Two things came up again and again:
- Buildings are checked on a schedule, not continuously. An electrical panel gets a thermal scan once a year, a façade gets inspected every few years, and a problem can grow for months in between.
- Every system is watched by a different tool, or by nobody. HVAC lives in the building automation system, structure lives in inspection reports, and wiring and plumbing often aren't monitored at all. No single system looks at the whole building and decides what to fix first.
The numbers backed this up. About 39,000 fires a year in the US start with electrical faults (NFPA), and only about 10% of US commercial buildings run any building automation at all (PNNL). One mechanical engineer told us, "This is an open area with untapped potential." So we set out to build a brain for the whole building.
What it does
Pavilion Cerebro is a swarm of AI agents with one coordinator. Each agent watches one of 11 problem areas: structure, envelope, electrical, wiring, HVAC, plumbing, fire, elevators, air, power and cyber. Every agent reports in the same format, and the coordinator ranks every issue so the facility team gets one prioritized list instead of eight dashboards.
How we built it
Four working agents, each measured on public data it was not calibrated on:
| Agent | Area | Result |
|---|---|---|
| A0 | Crack detection from photos | 92.9% accuracy on 1,600 held-out lab concrete photos |
| A1 | Concrete strength (ultrasonic pulse) + building data | Caught 10 of 10 clearly weak concrete readings; found a real AC unit failure in 2018 office data from Bangkok without being told where to look |
| A2 | Batteries and backup power | Flagged all 3 failing NASA battery cells 32–43 charge cycles before end of life |
| A3 | HVAC and chillers | 96.9% correct diagnosis on ASHRAE data, 1.5% false alarms, 20 of 28 faulty runs caught |
One report format for every agent. Each agent sends agent_id, subsystem, risk_score, confidence, evidence, timestamp, so adding a new building system means adding one agent, not rebuilding the platform.
The coordinator ranks every open issue by risk, consequence and time:
$$\text{priority}_i = r_i \times c_i \times u_i$$
where $r_i \in [0,1]$ is the agent's risk score, $c_i$ is the consequence if it fails (safety, cost, downtime) and $u_i$ is the urgency, which rises as the expected failure gets closer. This is why a hot battery bank gets handled before a hairline crack.
The demo is a scroll-driven 3D website built with Three.js. You watch a building get scanned from basement to roof, see 11 problems appear, watch the mascot split into agents that handle each one, and end on a healthy building. Tags are colour-coded by stage: green is built, blue is next, orange is future. The building and the repair actions in the demo are simulated. We used Claude as a pair programmer for the website and pitch materials.
The business model is built from published prices. For a reference 100,000 sq ft office, the software plan costs
$$\$599 \times 12 = \$7{,}188 \text{ a year,}$$
which is less than the roughly \$7,500 a year that building already spends on the yearly checks Cerebro can replace. Using published benchmarks for maintenance and energy savings:
$$\$7{,}500 + \$2{,}250 + \$13{,}230 - \$7{,}188 = \$15{,}792 \text{ saved per year.}$$
The serviceable market is about 590,000 US commercial buildings that already have automation:
$$590{,}000 \times \$7{,}188 \approx \$4.2\text{B a year.}$$
Challenges we ran into
- Lab data is not the real world. Our crack model scores well on lab photos but has not been tested on real façades yet. Drone imagery is our next step, and we say so on every slide.
- Some data doesn't exist publicly. There is no open dataset of building plumbing leaks, so the plumbing agent needs a partner building before we can make any accuracy claim.
- Making different agents comparable. A crack photo, a battery voltage curve and a chiller log have nothing in common. The shared 0–1 risk score and report format took several rounds to get right.
- Not overclaiming. Our battery agent spots wear; it does not predict fires. A 1.5% false-alarm rate still matters when a facility team gets hundreds of readings a day. We kept every claim tied to a held-out measurement.
- Scope. Eleven problem areas don't fit in a weekend, so we built four agents well and published a staged roadmap for the rest instead of faking all eleven.
- Pricing research. Most monitoring vendors don't publish prices. About 8 vendors would be needed to cover everything, and 5 of them are quote-only, so building an honest cost comparison took real digging.
What we learned
- The biggest gap in building maintenance is not a missing sensor. It is that nobody combines what the existing sensors already see.
- Continuous monitoring is starting to be accepted as a substitute for some manual checks. NFPA 70B (2026) allows permanently installed temperature sensors for routine thermal inspection.
- A model's score only means something next to the data it was tested on. "92.9% on lab photos" and "92.9% on buildings" are very different claims.
- To be adopted, the price has to sit below what owners already spend, not just below what they'd save.
What's next
- A 30-day pilot on one real building's automation feed, checking our alerts against what the facility team actually fixed.
- Testing the \$599 price with 10 facility managers.
- Having civil engineers review the crack model's grades.
- Building the next agents: plumbing (with a partner building), drone façade imagery, rain intrusion, and switchgear and wiring.
Built With
- altair
- amazon-chronos
- claude
- css
- html5
- hugging-face
- javascript
- numpy
- ollama
- onnx-runtime
- open-meteo
- opencv
- pandas
- playwright
- pydantic
- pydeck
- pyswmm
- python
- pytorch
- qwen3-vl
- scikit-learn
- scipy
- streamlit
- timm
- wntr


Log in or sign up for Devpost to join the conversation.