-
-
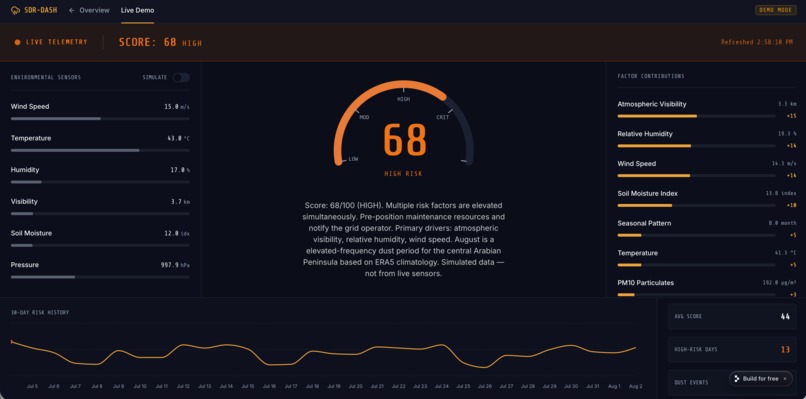
Image 1
Inspiration
I live in Saudi Arabia, so dust storms aren't an abstract weather event to me — I've seen what they cost, both economically and health-wise. A few weeks before this hackathon I built an XGBoost model that predicts dust storm onset at a given weather station using regional weather patterns and local environmental conditions. Going into this hackathon, I wanted to actually put that model to work on a real use case instead of leaving it as a standalone forecasting exercise.
What it does
The onset model tells you a dust storm is likely, but it doesn't tell you what kind of storm it is — and for a lot of industries, that's the part that actually matters. Solar farms are the clearest example: they generate huge amounts of clean energy, but in dust-prone regions they get clogged by storms, and without warning, operators lose both energy output and the resources spent on reactive cleaning.
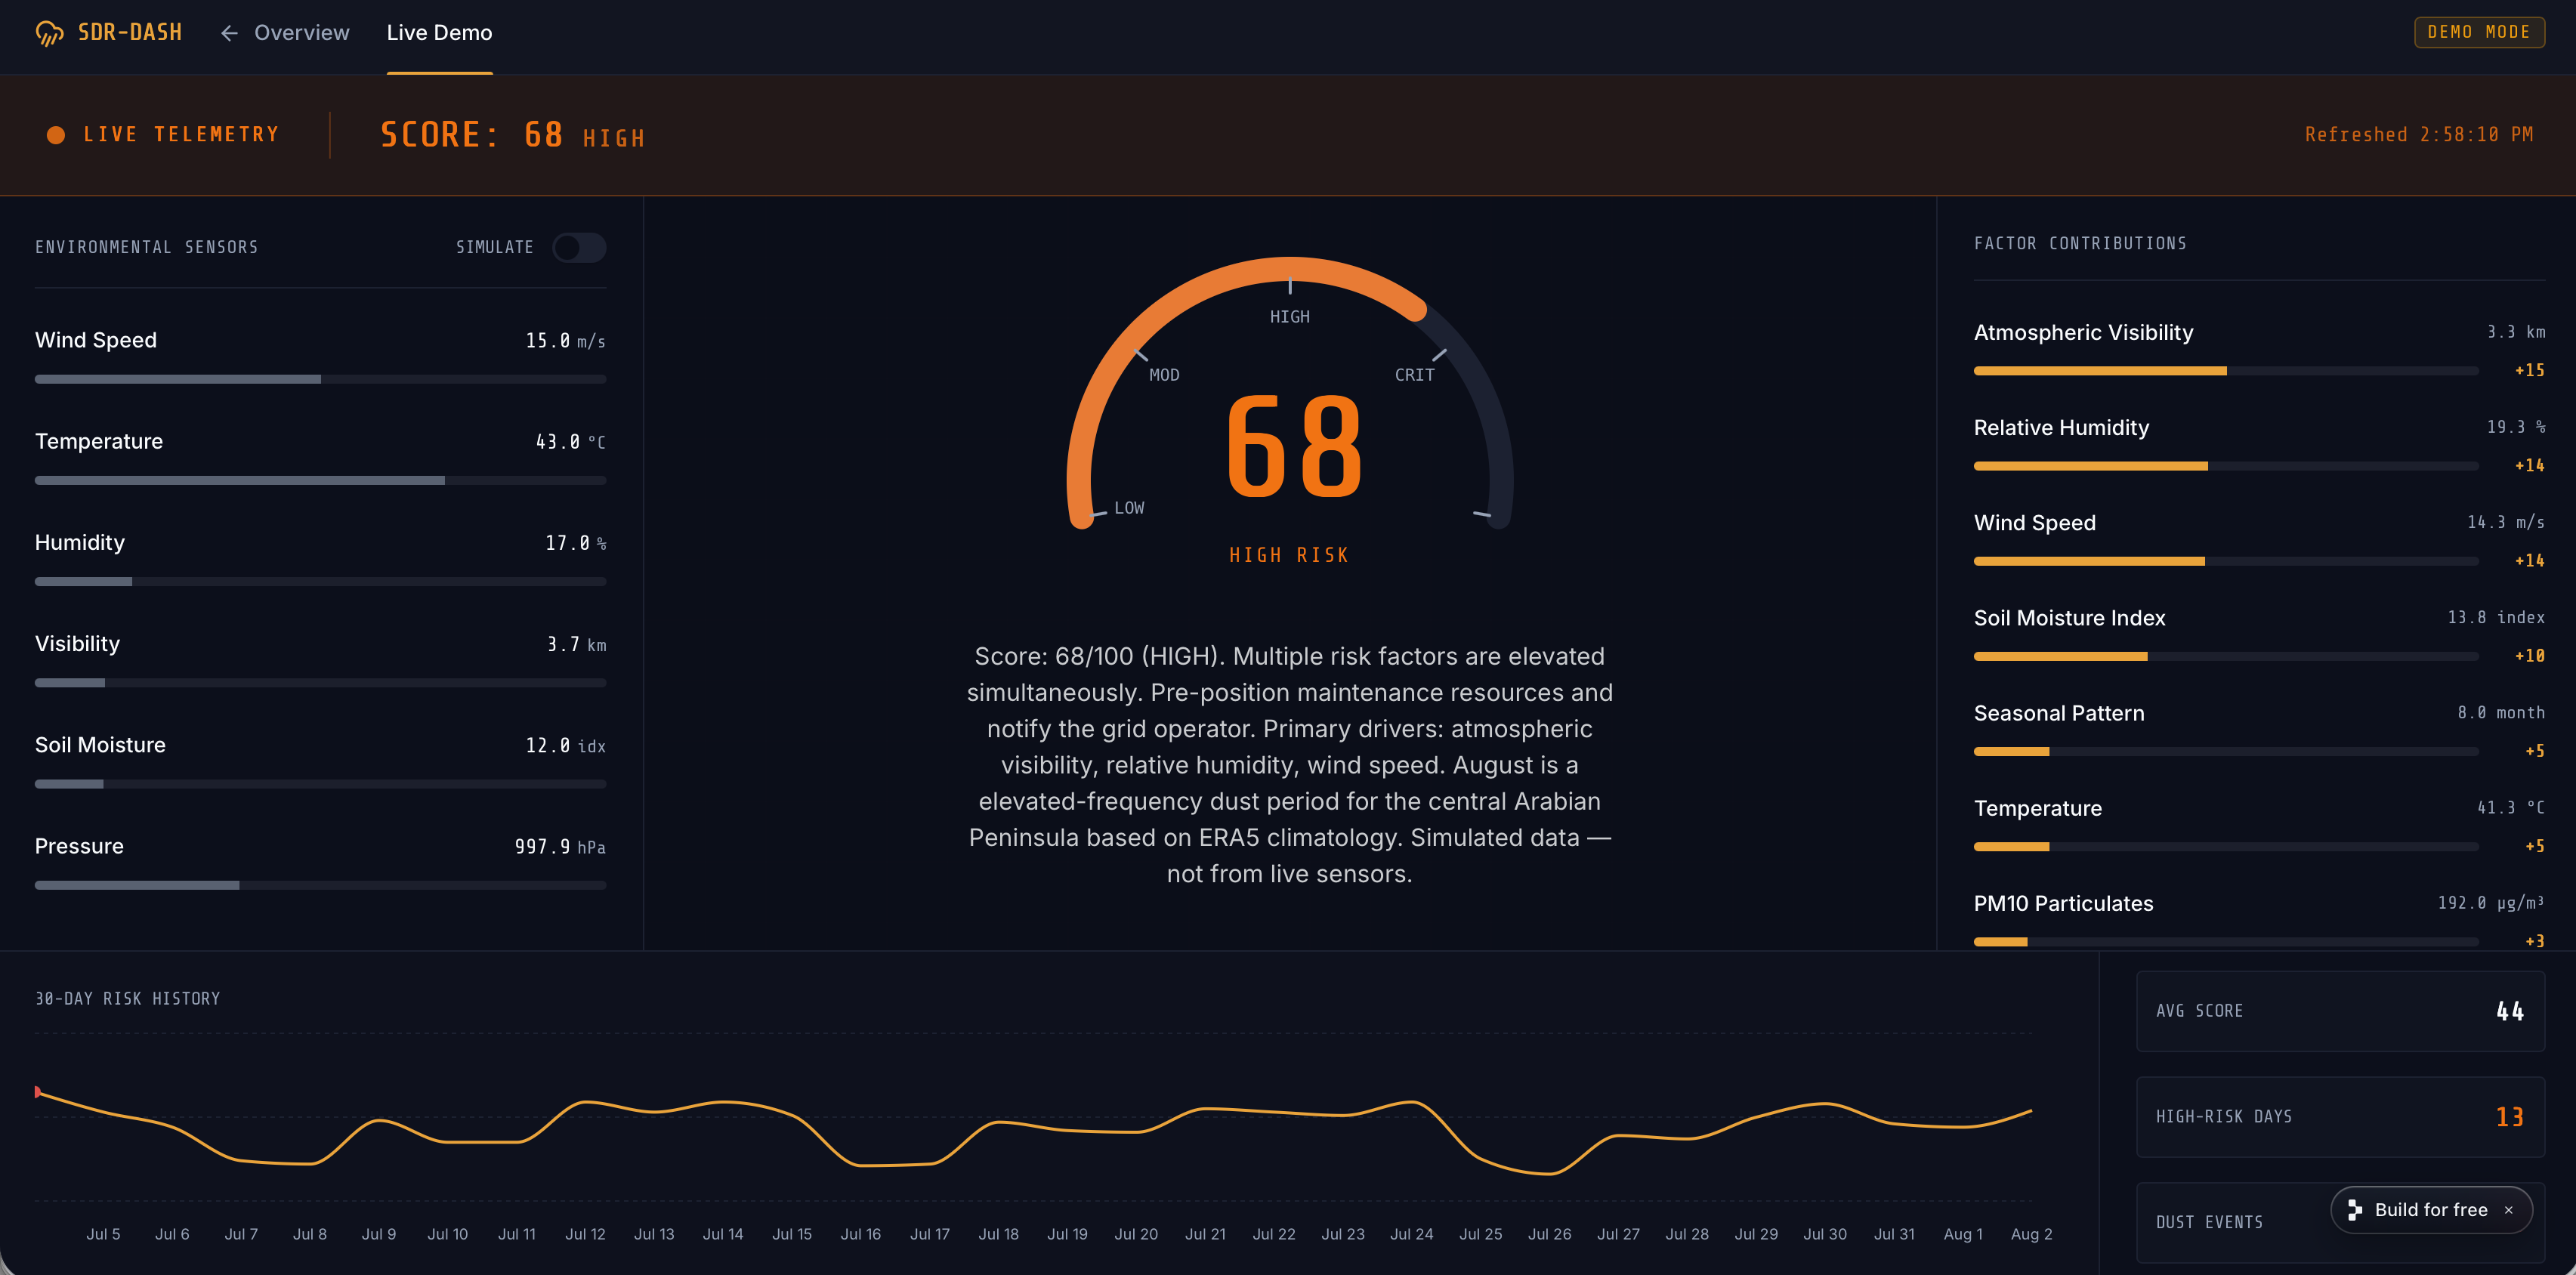
So I built a second layer on top of the onset model — the Solar Dust Risk (SDR) score — that weights dust composition (density, duration, and other features that correlate with severity, pulled from ERA5 reanalysis data alongside the original onset features) instead of just onset probability. The dashboard combines both into a single risk threshold specifically for solar infrastructure, and lets you modulate dust parameters to see how the risk shifts.
How I built it
The core model is XGBoost, trained on ERA5 data (wind speed, temperature, historical patterns, onset probability, etc.). I built the dashboard in Python and deployed it on Render. The composition scoring is a separate model layered on top of the existing onset predictions rather than baked into the same model — mainly because onset and composition are answering two different questions and I wanted to keep them interpretable separately.
Challenges I ran into
Most of the actual model-building was already done coming into this, so the real challenge was the composition side — figuring out which features actually correlate with how bad a storm is for a solar panel (not just whether it happens), since that's a much less standard thing to model than onset. Getting the dashboard to reflect that flexibly, rather than just spitting out one static number, took some iteration too.
What I learned
That prediction and impact are two different problems. It's tempting to stop at "will this happen," but for something like solar infrastructure, the useful question is "will this hurt me, and how much" — which meant building something on top of my existing work instead of just presenting the existing work again.
What's next
Real-world cost and implementation research to make sure this is actually deployable for solar farm operators, not just a hackathon demo — plus refining the composition-severity features with more targeted data.
Built With
- dashboard
- data-science
- era5
- machine-learning
- python
- render
- xgboost


Log in or sign up for Devpost to join the conversation.