-
Nova Finance — Money, in three dimensions.
Inspiration -
Every finance app we opened looked the same: a wall of flat cards, a pie chart, and a shade of blue. The tools we use to manage money — the most emotionally charged part of adult life — are visually the least interesting software on our phones.
We wanted to know whether depth could do real informational work, not just look pretty. Could a balance feel more important than a transaction list because it physically sits closer to you? Could a screen transition tell you where you came from? And could all of that happen without a 400KB framework shipping to the browser?
The reference points were less "banking app" and more: hardware product pages, 3D keycap renders, and the glass panels of a concept-car dashboard. Nova Finance is what happens when you apply that language to a budget tracker.
What it does Nova Finance is a complete front-end prototype of a personal finance platform — auth, dashboard, budgeting, savings goals, analytics and notifications — with a persistent dark/light theme and true 3D interaction.
Authentication — Log in or sign up, with an email or phone identifier toggle, live password-strength meter, inline validation, password reveal, and a one-click demo session for reviewers.
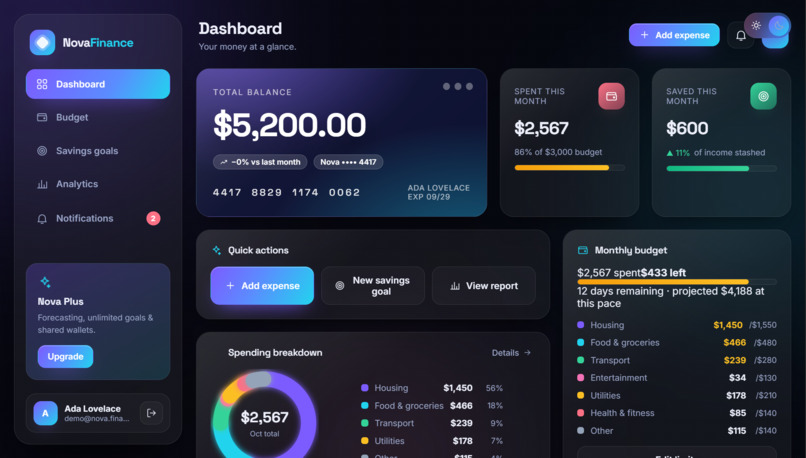
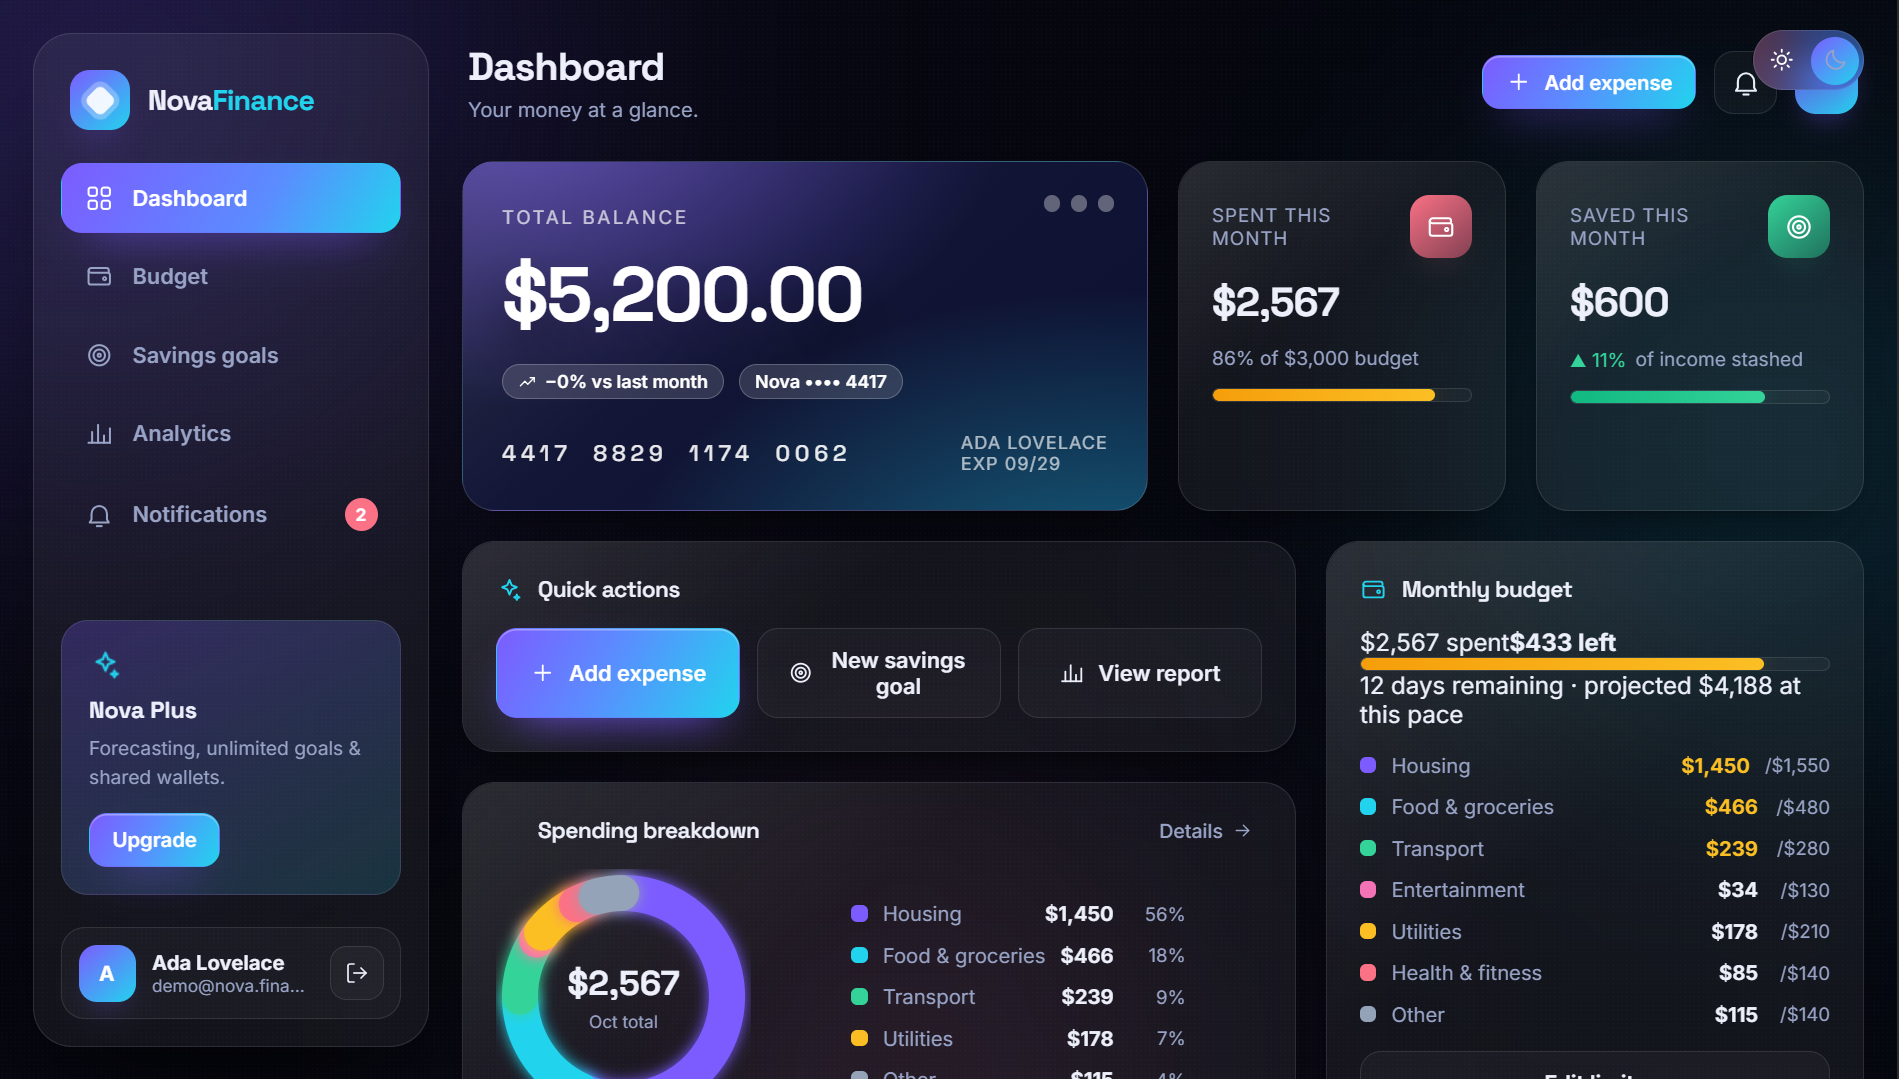
Dashboard — Total balance on a floating 3D card, spend and savings stats with animated progress bars, an animated donut showing where this month's money went, per-category budget status, and the six most recent transactions.
Budget management — Set a monthly limit, then set a cap for each of seven categories (housing, food & groceries, transport, entertainment, utilities, health, other). Every row shows live usage with an On track / Watch / Over chip, plus projected month-end spend against your budget.
Savings goals — Name a target, an amount and a deadline. Goals render as SVG progress rings with a pace verdict: "Behind pace — save $340/mo to hit the 210-day deadline." Contribute funds and milestones at 50 / 75 / 90 / 100% fire automatically.
Analytics — A 6-month spending trend area chart with 3M/4M/6M ranges, an 8-week bar chart, a KPI strip (average spend, biggest category, savings rate, safe-to-spend), and a generated insights panel that interprets your data in plain English.
Notifications — The app watches your budgets for you. Add an expense and it immediately tells you if that category has crossed its cap or if the monthly budget is blown. Unread badges show on the bell and the sidebar.
Everything persists to localStorage — budgets, goals, transactions, notifications and your theme choice all survive a refresh.
How we built it Three files. No framework, no charting library, no build step.
index.html — auth screen, app shell, SVG icon sprite, modal + toast layers styles.css — theme tokens, glass surfaces, 3D scene, responsive breakpoints app.js — state, canvas charts, views, auth, notification engine Styling is entirely CSS custom properties. There are two token sets — html[data-theme="dark"] and html[data-theme="light"] — and every component reads from them. One attribute swap re-themes the whole application. 3D is real CSS 3D, not a canvas engine. perspective on the stage, preserve-3d on cards, and a pointer listener that writes rotateX / rotateY custom properties per element. Screen transitions rotate in on the Y-axis; modals drop in on the X-axis. Under 8° of rotation everywhere — enough to feel dimensional, not enough to hurt readability. Charts are drawn by hand on , scaled by devicePixelRatio, and redrawn on a debounced resize. The donut uses rounded stroke caps with gaps; the area chart uses a vertical gradient fill with a shadowed line and a value pill on the last point; bars use a two-stop gradient keyed to whether a week is above or below average. State is a single plain object with selector functions derived from it (spentIn, spentByCat, savedIn), saved to localStorage after every mutation. The insight engine is a rules function, not hardcoded copy. It projects month-end spend from your daily average, ranks categories, compares against last month, and evaluates goal pacing — then chooses which of its findings are worth saying. Seeded data is generated with a deterministic PRNG (mulberry32) over seven months, structured like real life: rent on the 1st, subscriptions mid-month, bills staggered through the month, grocery runs weighted toward weekends, and the current month generated only up to today. Challenges we ran into Making 3D feel expensive instead of gimmicky. The first pass rotated cards 20°+ and it was nauseating. We settled on a rule: rotation caps at 4–8°, depth comes from light (layered gradients, glow shadows, glass highlights) rather than angle, and tilt only engages on hover with a fast spring-back.
Charts that fight CSS. Canvas sizing is a trap — the CSS width, the width attribute and the backing-store width are three different numbers. We wrote a prep() helper that reads the bounding rect, multiplies by DPR, sets both pixel dimensions and then resets the transform, so drawing coordinates always stay in CSS pixels.
Believable demo data. Our first generator produced $574 of utilities and $0 of rent in a single month — technically valid, visibly wrong. We replaced weighted-random sampling with recurring-event modeling (bills on fixed days, variable spend distributed by count and range), and prorated the current month by the day of the month. The numbers now survive being inspected.
Percentages that lie. A handful of bars were computed as pct(p * 100, 1), quietly multiplying by 100 twice — so 35% progress rendered as a full bar. Caught it during browser verification, which is also when we learned to check rendered values, not just "no console errors."
Notifications without being annoying. The obvious approach — notify on every expense — produces a spam machine. We gated alerts on thresholds instead: category at 85% is a warning, crossing 100% is an alert, monthly budget breach is an alert, and goals only speak at milestones. Everything else is a toast that disappears on its own.
Responsive without a rewrite. The desktop sidebar and the mobile bottom nav are the same DOM node — a single media query changes it from a vertical rail to a horizontal bar, plus a drawer variant for when labels are needed. No duplicated markup, no JS layout switching.
Accomplishments that we're proud of Zero dependencies. No React, no Chart.js, no animation library, no bundler. The entire app is three files that open by double-clicking index.html. Every feature on the spec list actually works end-to-end — add an expense and the balance drops, the donut re-draws, the category chip flips to Over, a notification appears, the badge increments, and the insight panel rewrites its projection. All in one synchronous pass. The dark/light toggle is total. Not a background swap — borders, shadows, glass opacity, chart gridlines, input fills, the modal backdrop and even the card highlights all shift. And it persists. Hand-drawn, retina-correct charts that resize with the window and stay crisp on high-DPI displays. A pace algorithm that's actually useful — goals tell you the required monthly savings rate and compare it to your real contribution history, then render green or amber accordingly. Verified in a real browser, not just written. Every view, the auth flows, the expense modal, theme persistence and session restore were exercised programmatically with zero console errors. What we learned Depth is a hierarchy tool. The balance card doesn't need a bigger font when it sits forward in Z-space and the cards behind it are softer. We started using translateZ the way designers use whitespace.
Constraints produced the aesthetic. Committing to "no dependencies" meant no chart library — which forced hand-drawn canvas charts — which turned out to look better than anything we'd have picked off npm, because they use the exact theme tokens.
Demo data is a design problem. Nobody opens a prototype and thinks "nice seed function." But they absolutely notice when utilities cost more than rent. Credible data is what makes a mock feel like a product.
Read the rendered number. Syntax checks and empty console logs told us the app was healthy while two progress-bar calculations were silently wrong. Now the standard is: assert the value you'd screenshot.
Threshold-based alerting beats event-based alerting. In a finance app, the user wants to be told when something needs a decision — not that a transaction happened. Every notification in Nova answers "does this require me to do something?"
Animation should explain, not decorate. The bar-growth animation shows a value filling toward a limit. The screen rotation shows where you came from. The toast's progress bar shows how long until it leaves. If we couldn't name the job, we cut it.
What's next for Nova Near term
Transaction search, filtering and category editing Recurring transactions and subscription detection CSV / OFX import and a working export Drag-and-drop category reassignment Custom categories with user-picked colors and icons Product
Budget envelopes — roll unspent money forward into next month Forecasting — project your balance 90 days out from current trends and recurring bills Shared budgets — split a household budget with a partner, with per-person caps Goals with auto-sweeps — automatically move a percentage of income into savings the day you're paid Real notifications — Web Push alerts and a browser-notification opt-in, so milestones reach you when the tab is closed Engineering
A REST or Firebase adapter behind a thin data layer, so the mock's state shape becomes a real API contract — swap localStorage for a network client and nothing else changes PWA packaging: service worker, install prompt, offline shell Multi-currency with live FX rates and locale-aware formatting Biometric / WebAuthn login to replace the mock auth Visual regression tests and axe accessibility audits in CI Design
Micro-interactions on transaction add — the balance card physically dipping as money leaves A true WebGL layer for the hero card with real reflections and material Per-user theming: accent color pickers and light/dark schedules Localization-ready layouts for RTL languages


Log in or sign up for Devpost to join the conversation.