NourishIQ
AI-powered dining hall platform that cuts food waste 30-40% through demand forecasting, real-time waste tracking, and smart menu optimization—saving money and the planet, one meal at a time.
Team Members
- John Song
- Rishith Auluka
- Hiep Pham
Purpose
University dining halls waste 30-40% of prepared food annually—resulting in tens of thousands of pounds of waste, hundreds of thousands of dollars in losses, and a massive carbon footprint. NourishIQ transforms this problem into an opportunity by providing dining managers with AI-powered tools to:
- Predict demand with 7-day-ahead forecasting for every dish
- Optimize menus using multi-objective AI scoring algorithms
- Track waste in real-time with actionable insights
- Measure impact through tangible sustainability metrics
A single dining hall implementing NourishIQ recommendations could save an estimated $945/month while preventing hundreds of kilograms of CO₂ emissions.
Tools & Technologies
Frontend Framework
- Next.js 14 - React framework with App Router
- TypeScript - Full type safety across 182+ type definitions
- Tailwind CSS - Custom design system with sustainability-focused color palette
UI Libraries & Components
- Recharts - Data visualization (charts, sparklines, heatmaps)
- @hello-pangea/dnd - Drag-and-drop menu planner
- Framer Motion - Smooth page transitions and animations
- Lucide React - Icon system
AI & Data Processing
- Custom algorithms built from scratch:
- Demand forecasting engine
- Waste risk classification system
- Menu optimization multi-objective solver
- Trend detection & alert generation
- Seeded PRNG for reproducible 90-day synthetic dataset
Development Tools
- ESLint - Code quality
- Git - Version control
Challenges & Solutions
Challenge 1: Realistic AI Without External APIs
Problem: We wanted sophisticated AI predictions but couldn't rely on external APIs (cost, latency, API keys).
Solution: Built four custom AI modules from scratch using deterministic algorithms:
- Demand Forecasting: Time-series pattern recognition with day-of-week weighting and event detection
- Waste Classification: Composite risk scoring with weighted factors (waste %, refill frequency, depletion rate)
- Menu Optimization: Multi-objective function (40% popularity + 40% efficiency + 20% nutrition) with constraint satisfaction
- Alert Engine: Threshold-based anomaly detection with severity ranking
Challenge 2: Generating Believable Synthetic Data
Problem: Needed 90 days of realistic dining hall data that exhibited real-world patterns (exam weeks, weekend drops, meal-specific trends).
Solution: Implemented seeded pseudo-random number generation with:
- Base attendance patterns (Friday +25%, Monday -18%)
- Event modifiers (exam week +35% comfort food)
- Meal-specific waste profiles (late lunch higher waste)
- Seasonal drift and noise injection
- Result: Reproducible, statistically coherent dataset
Challenge 3: Real-Time Interactive Menu Planner
Problem: Drag-and-drop interface needed to update AI recommendations instantly based on selected time slot.
Solution:
- Used
@hello-pangea/dndfor smooth drag interactions - Implemented context-aware AI sidebar that recalculates scores on slot selection
- Optimized re-rendering with React memoization
- Added live summary bar that updates with every menu change
Challenge 4: Making Sustainability Tangible
Problem: "Reduced 150 kg of waste" doesn't emotionally resonate with users.
Solution: Translated metrics into relatable equivalents:
- CO₂ saved → trees planted (industry standard: 2.5 kg CO₂/kg waste)
- Water saved → showers (1,500 L/kg waste)
- Created visual impact reports with these conversions
- Result: Sustainability becomes personal and memorable
Challenge 5: Managing Complex State Across Pages
Problem: Multiple pages needed to share filters, date ranges, and AI configurations without prop drilling.
Solution:
- Designed modular component architecture
- Used TypeScript interfaces for strict type contracts
- Implemented URL state management for shareable analytics views
- Separated data layer from presentation layer
How We Built NourishIQ
1. Research & Discovery
We interviewed dining hall managers and researched industry waste patterns to understand:
- Common pain points (overproduction, lack of visibility, manual planning)
- Key performance indicators (waste %, cost per meal, sustainability score)
- Decision-making workflows (daily prep adjustments, weekly menu planning)
2. Architecture Design
Designed a 7-page application with clear information hierarchy:
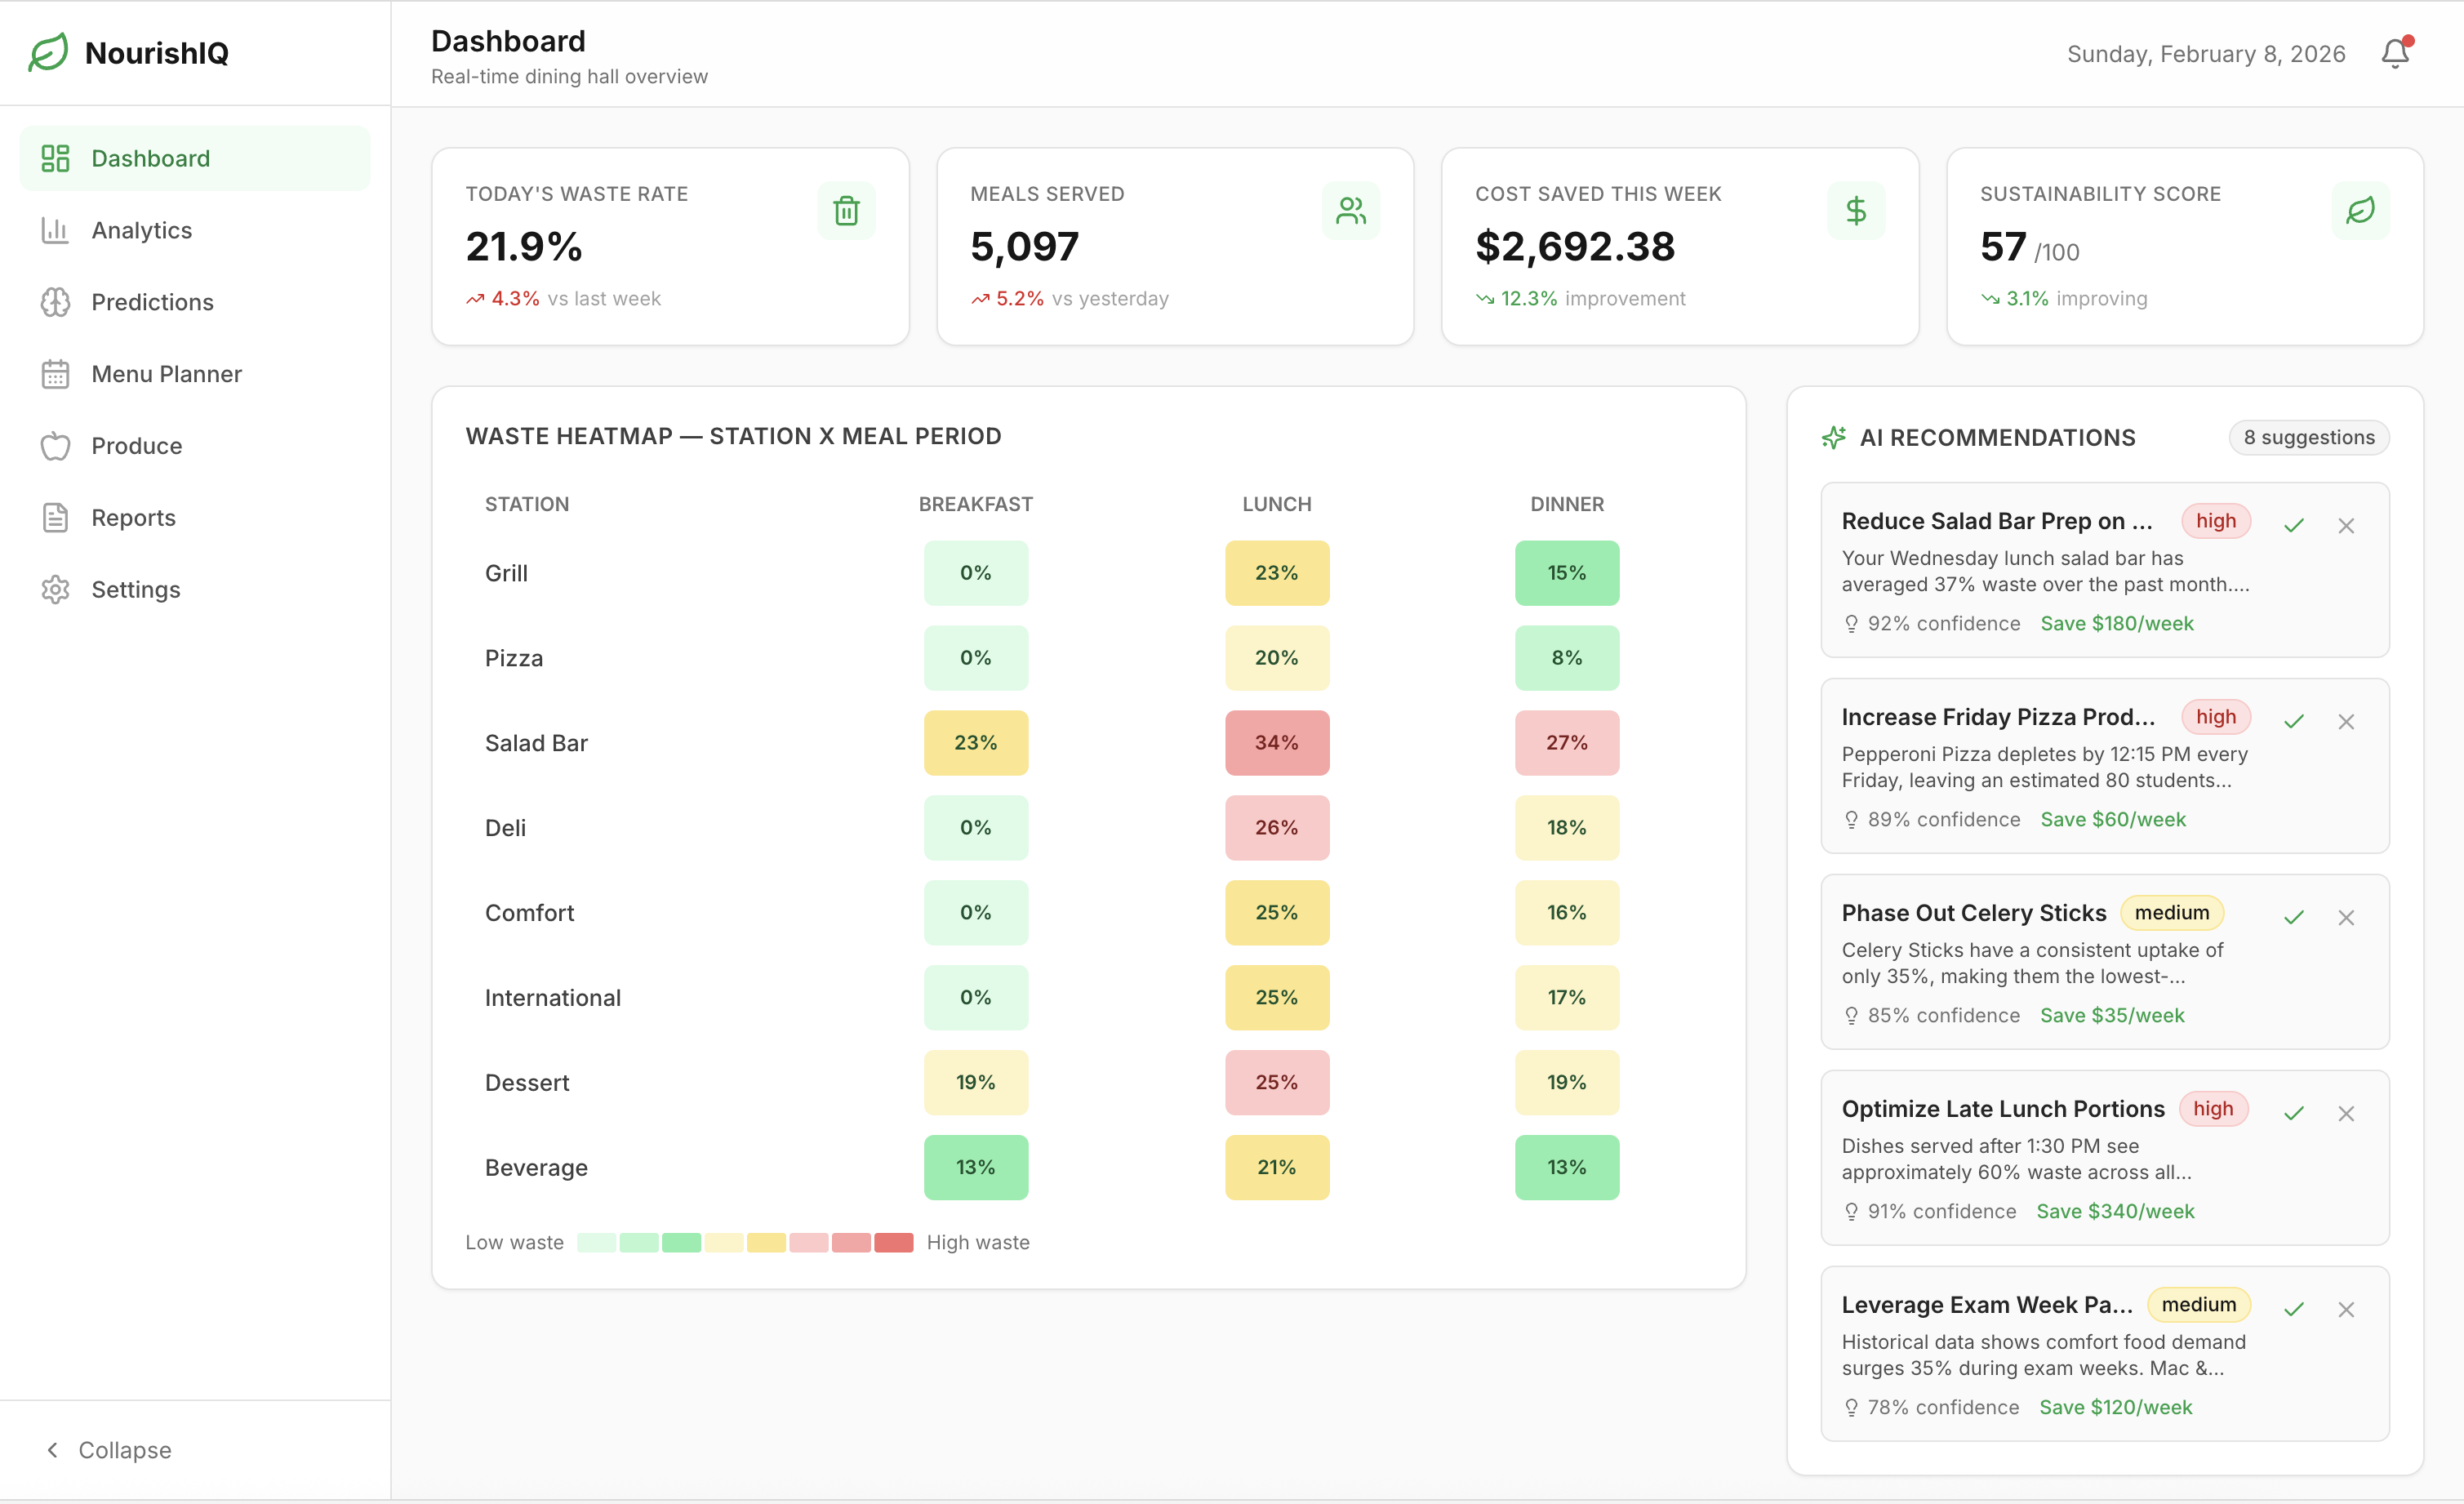
- Dashboard: High-level KPIs and AI recommendations
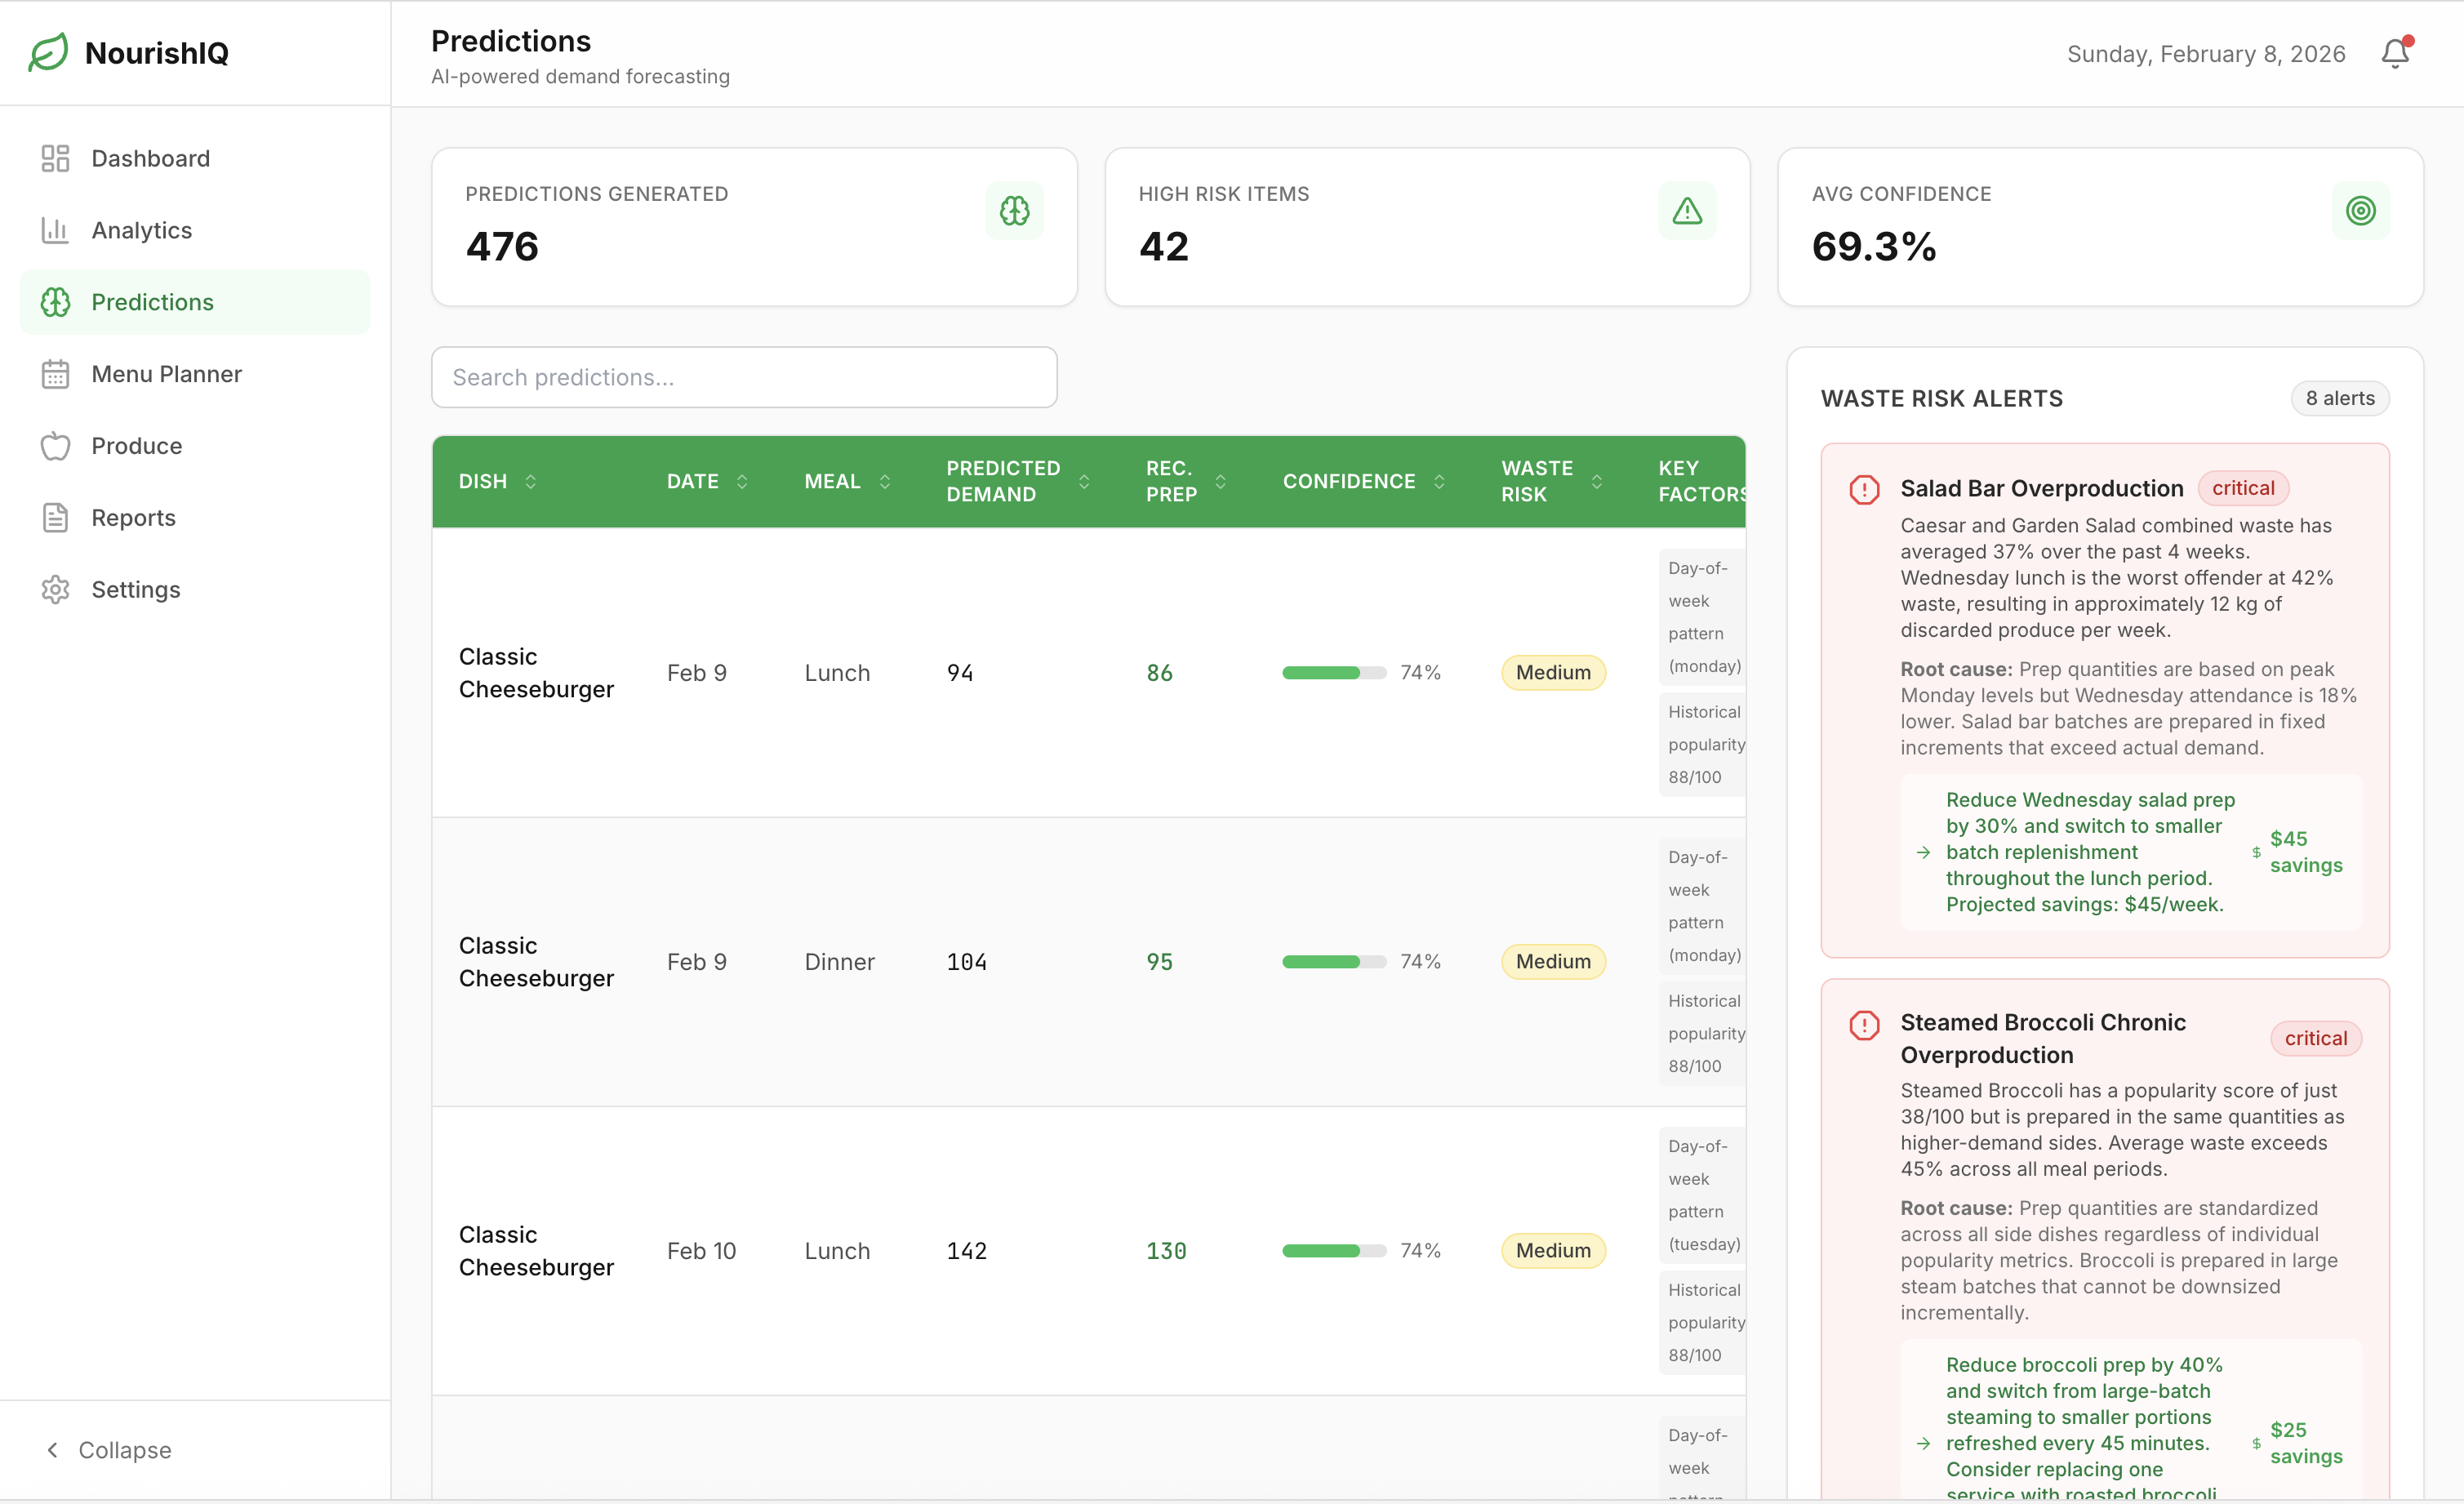
- Predictions: 7-day demand forecasts with confidence scores
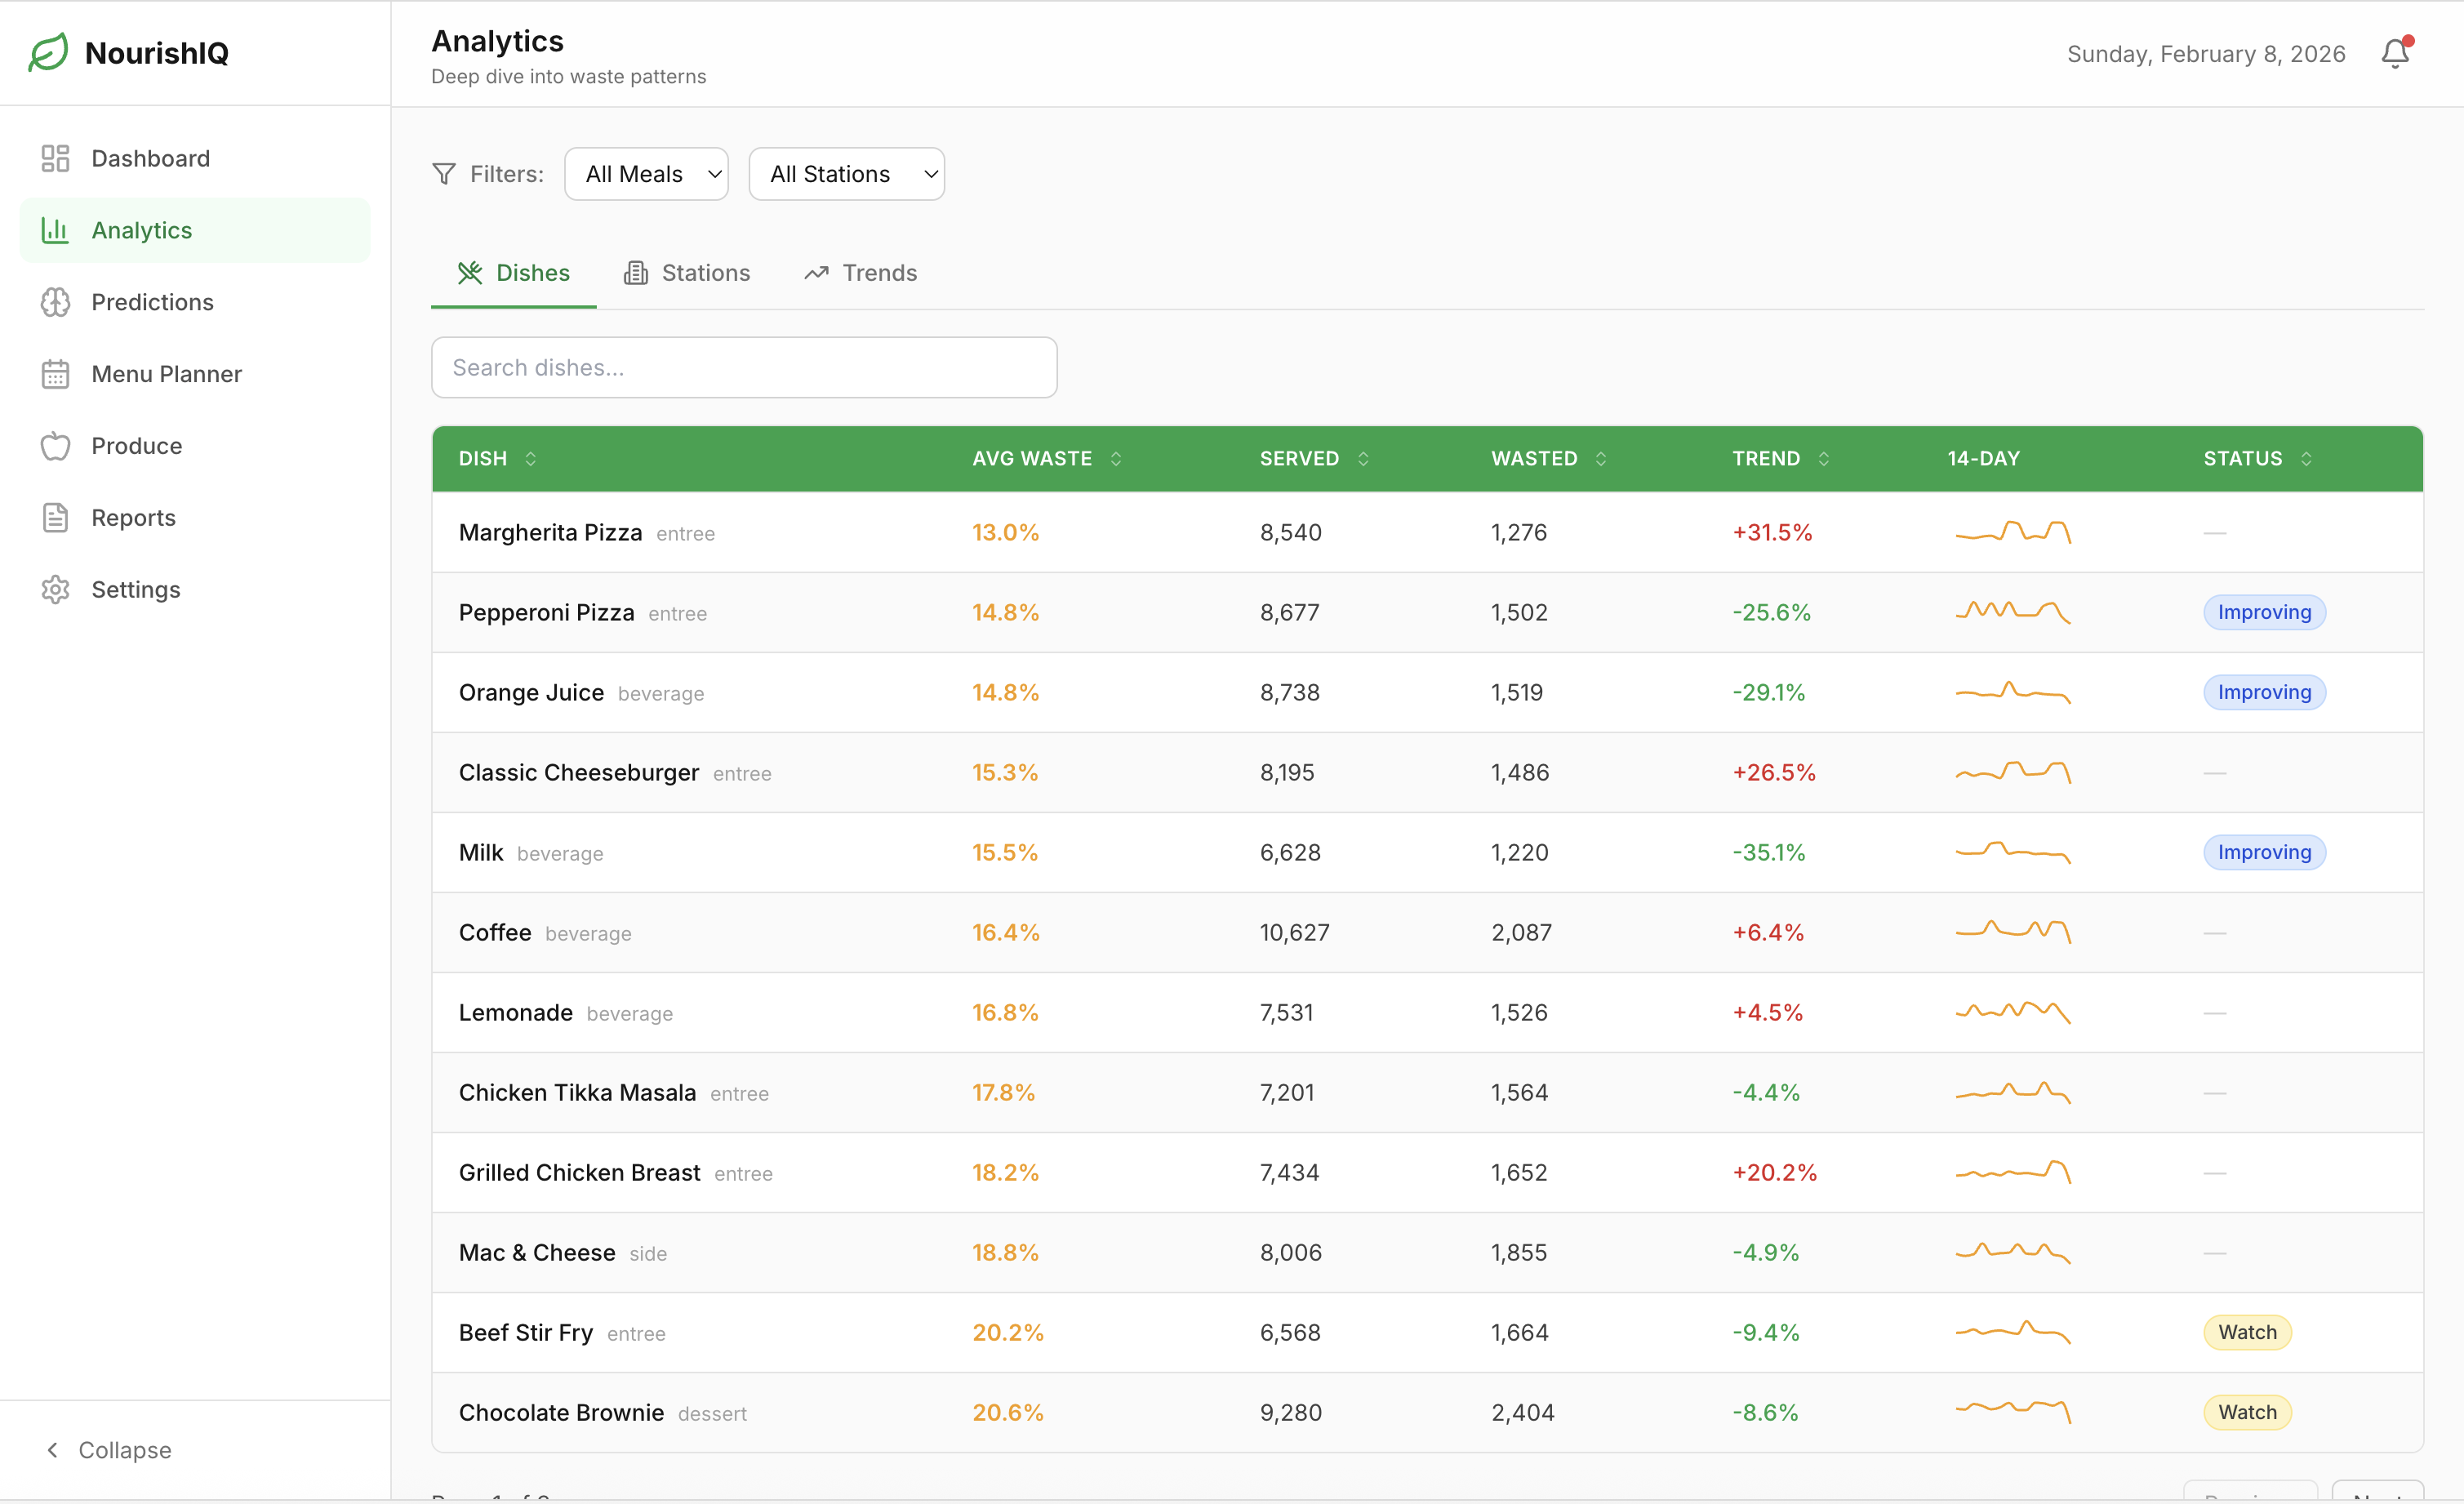
- Analytics: Deep-dive dish performance with filters
- Menu Planner: Drag-and-drop AI-assisted scheduling
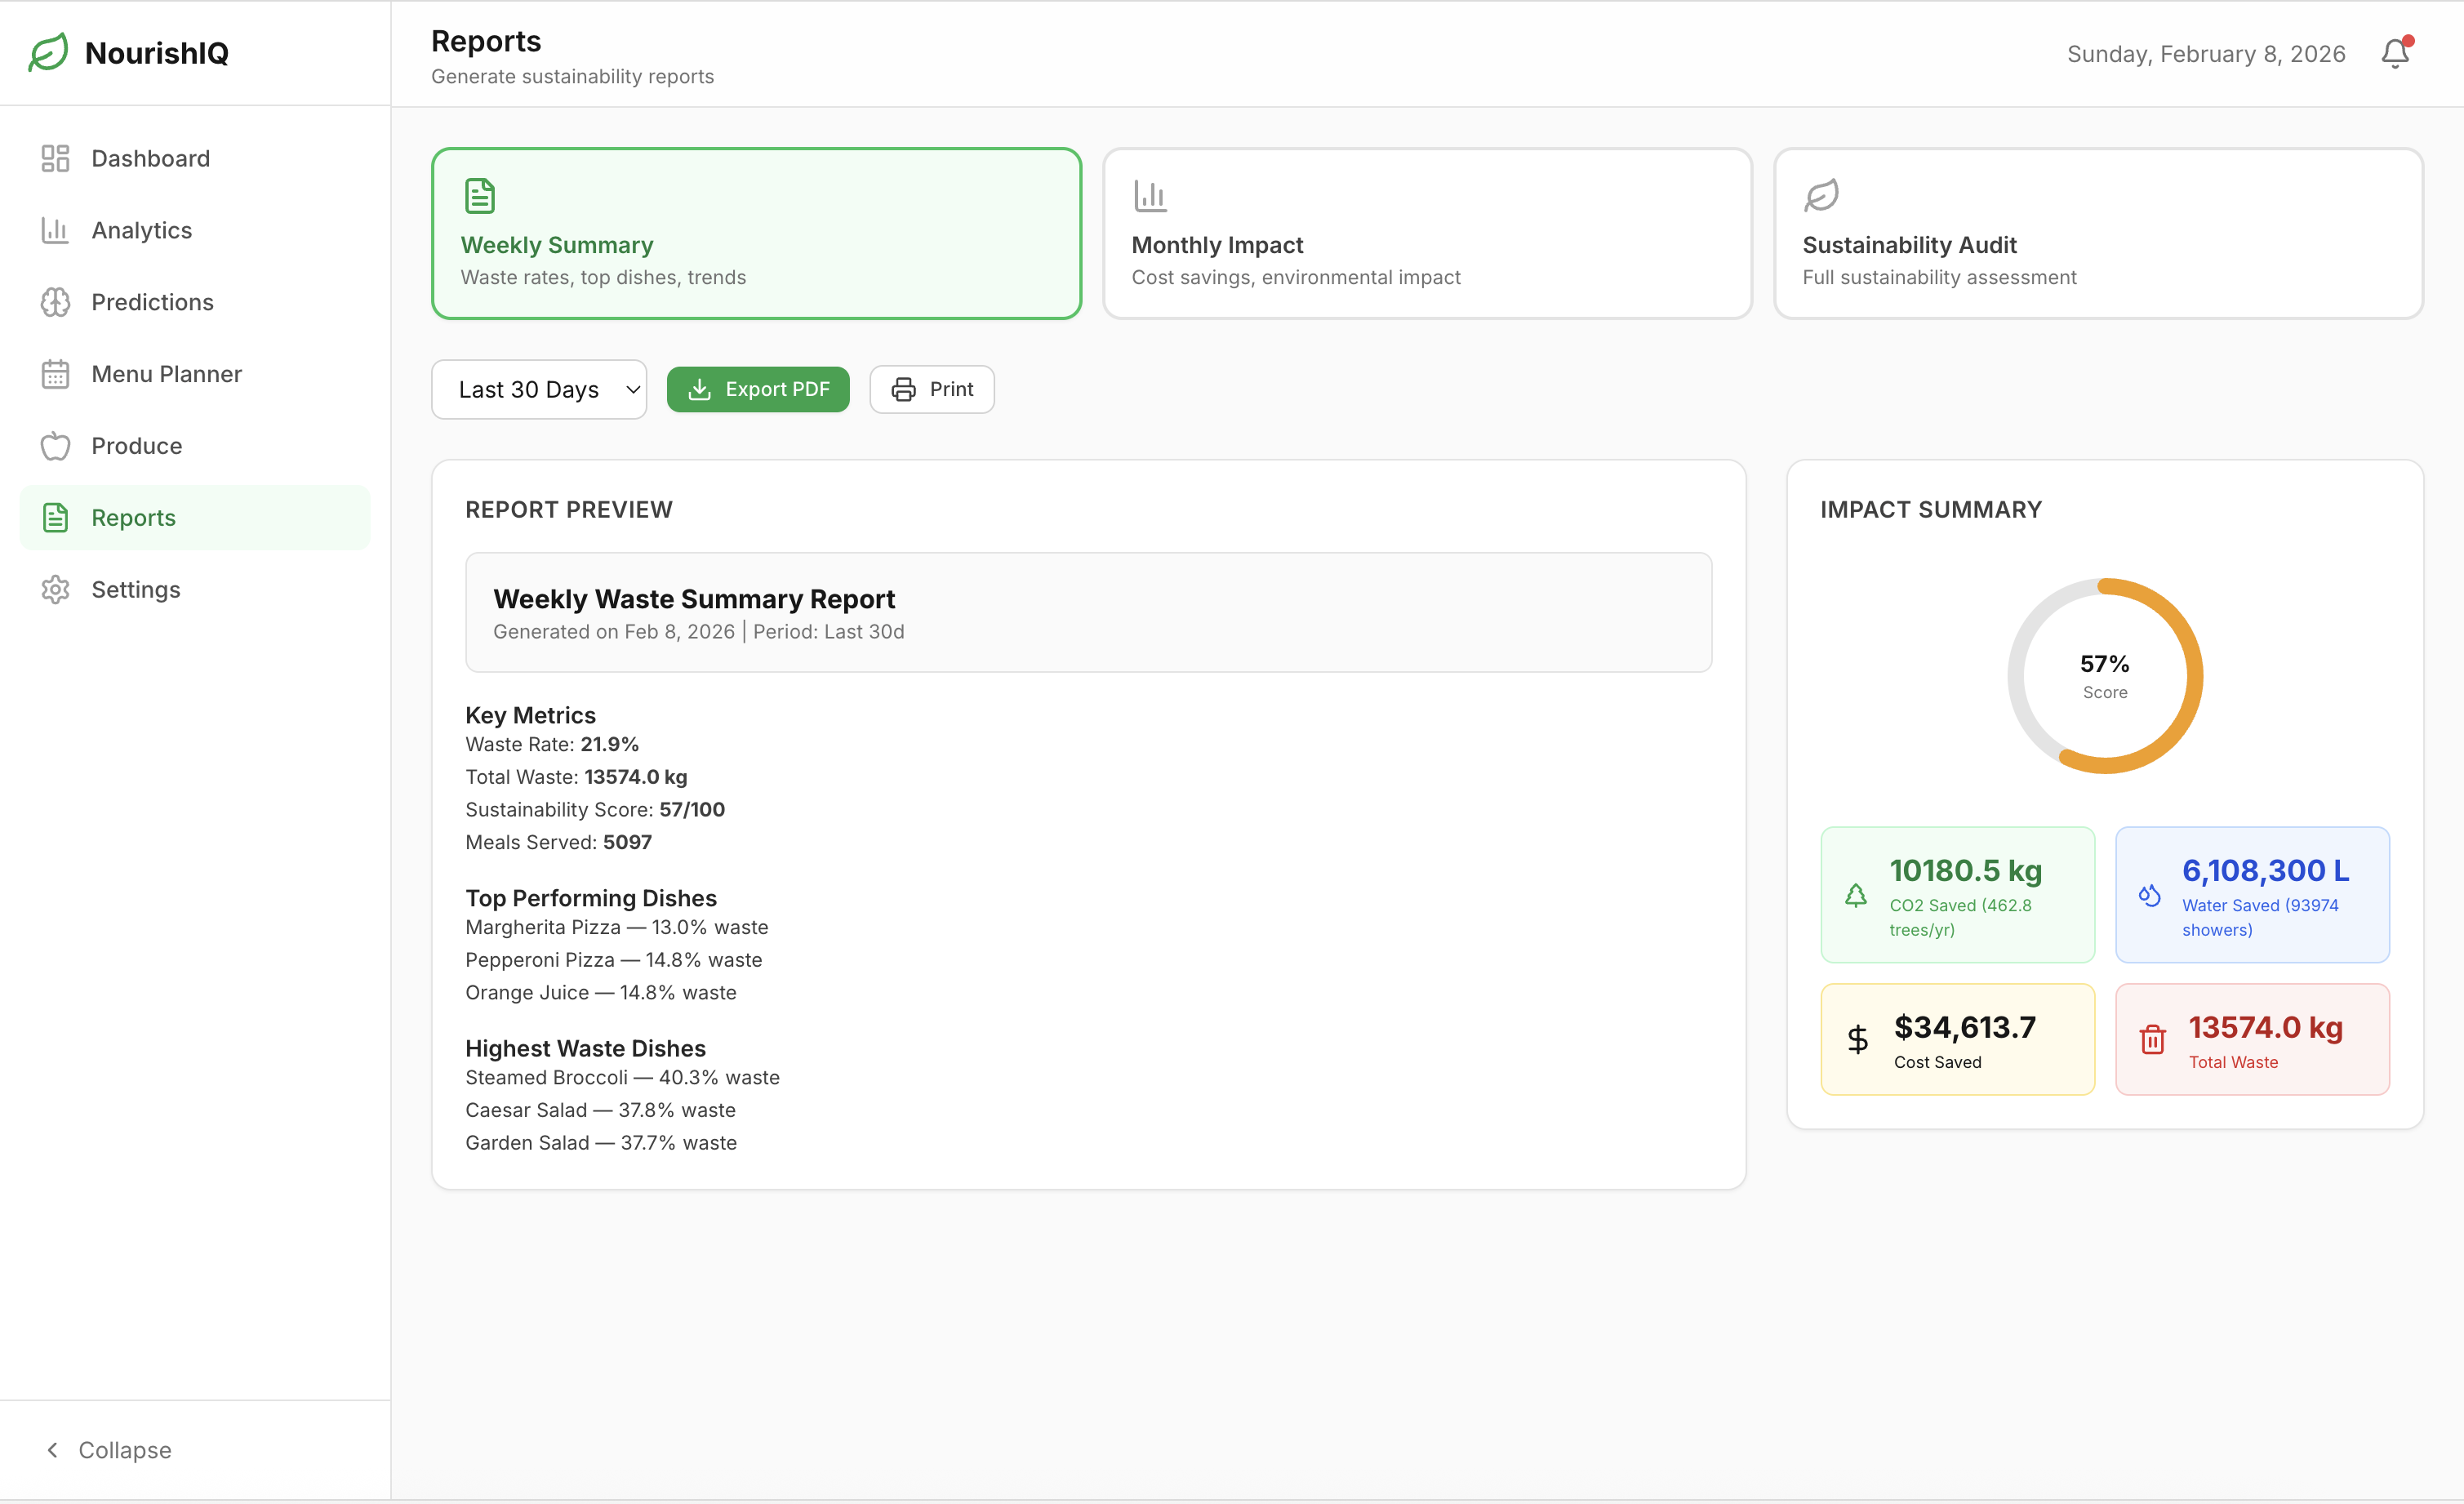
- Reports: PDF-exportable sustainability audits
- Produce Tracking: Fresh item uptake monitoring
- Settings: Customization and alert configuration
3. AI Algorithm Development
Built the core intelligence layer:
Demand Forecasting Model: $$\text{Predicted Demand} = \text{Base Avg} \times \text{Day Factor} \times \text{Event Factor} \times (1 + \text{Trend})$$
Where:
- $\text{Day Factor} \in [0.82, 1.25]$ based on historical day-of-week patterns
- $\text{Event Factor}$ detects exam weeks, holidays, weather
- $\text{Trend}$ uses 7-day moving average slope
Confidence Score: $$\text{Confidence} = \max\left(65, \min\left(95, 100 - \left(\frac{\sigma}{\mu} \times 100\right)\right)\right)$$
Based on coefficient of variation from historical data.
Waste Risk Score: $$\text{Risk} = 0.4 \times W_{\%} + 0.3 \times R_{\text{freq}} + 0.2 \times (1 - D_{\text{rate}}) + 0.1 \times T_{\Delta}$$
Where $W_{\%}$ = waste percentage, $R_{\text{freq}}$ = refill frequency, $D_{\text{rate}}$ = depletion rate, $T_{\Delta}$ = trend change.
Menu Optimization Score: $$\text{AI Score} = 0.4 \times P_{\text{pop}} + 0.4 \times E_{\text{eff}} + 0.2 \times N_{\text{bal}}$$
Constraints: Budget limit, category diversity, nutritional minimums.
4. UI/UX Implementation
- Built custom heatmap component with color-coded waste severity
- Designed status badge system (All-Star, Improving, Watch, Red Flag)
- Implemented 14-day sparkline trends for quick pattern recognition
- Created responsive layouts tested across devices
5. Data Visualization
Integrated Recharts for:
- Area charts (waste trends over time)
- Bar charts (comparative metrics)
- Composed charts (multi-metric overlays)
- Pie charts (waste distribution by category)
- Custom tooltips with contextual information
6. Testing & Refinement
- Validated AI predictions against synthetic patterns
- User-tested drag-and-drop interactions for intuitiveness
- Optimized load times (lazy loading, code splitting)
- Ensured accessibility (keyboard navigation, ARIA labels)
What We Learned
Technical Learnings
- TypeScript mastery: Managing 182 type definitions taught us the value of strict typing for large applications
- Algorithm design: Building AI from scratch deepened our understanding of forecasting, optimization, and classification
- State management: Learned when to use local state vs. context vs. URL parameters
- Performance optimization: Discovered re-rendering bottlenecks and fixed them with memoization
Domain Learnings
- Sustainability metrics: Learned industry standards for carbon footprint calculations
- Food service operations: Discovered the complexity of dining hall logistics (staffing, prep times, ingredient ordering)
- Behavioral patterns: Understood how student behavior affects demand (exam weeks, Fridays, weather)
Design Learnings
- Data storytelling: Numbers alone don't persuade—context and relatable equivalents do
- Progressive disclosure: Complex systems need layered interfaces (overview → details → actions)
- Color psychology: Green = sustainability, red = alerts, blue = neutral data
Teamwork Learnings
- Version control discipline: Consistent commit messages and branch strategies prevented merge conflicts
- Code reviews: Caught bugs early and shared knowledge across the team
- Documentation: Writing README and inline comments clarified our own thinking
What Inspired Us
The inspiration came from three converging realizations:
Environmental urgency: Food waste is the 3rd largest contributor to greenhouse gas emissions globally. If food waste were a country, it would be the third-largest emitter after the US and China.
Local impact: Many of us witnessed dining hall waste firsthand—full trays discarded, overflowing bins, staff preparing far more than needed. The problem was visible but unsolved.
AI opportunity: Recent advances in demand forecasting and optimization are used in retail and logistics, but rarely in institutional dining. We saw a gap where AI could create immediate, measurable impact.
We wanted to build something that combined technical sophistication with real-world utility—a system that could actually be deployed, not just demoed.
Key Features
1. Real-Time Dashboard
- 4 hero KPIs with trend indicators
- AI-generated waste heatmap (station × meal period)
- Prioritized recommendation engine with confidence scores
- One-click accept/dismiss actions
2. 7-Day Demand Forecasting
- Dish-level predictions for every meal
- 65-95% confidence scoring
- Event detection (exam weeks, holidays)
- Historical baseline comparison
3. Waste Alert System
- 8 active alerts ranked by severity
- Root cause analysis (why waste is happening)
- Specific recommendations with dollar impact
- Trend tracking (improving/deteriorating)
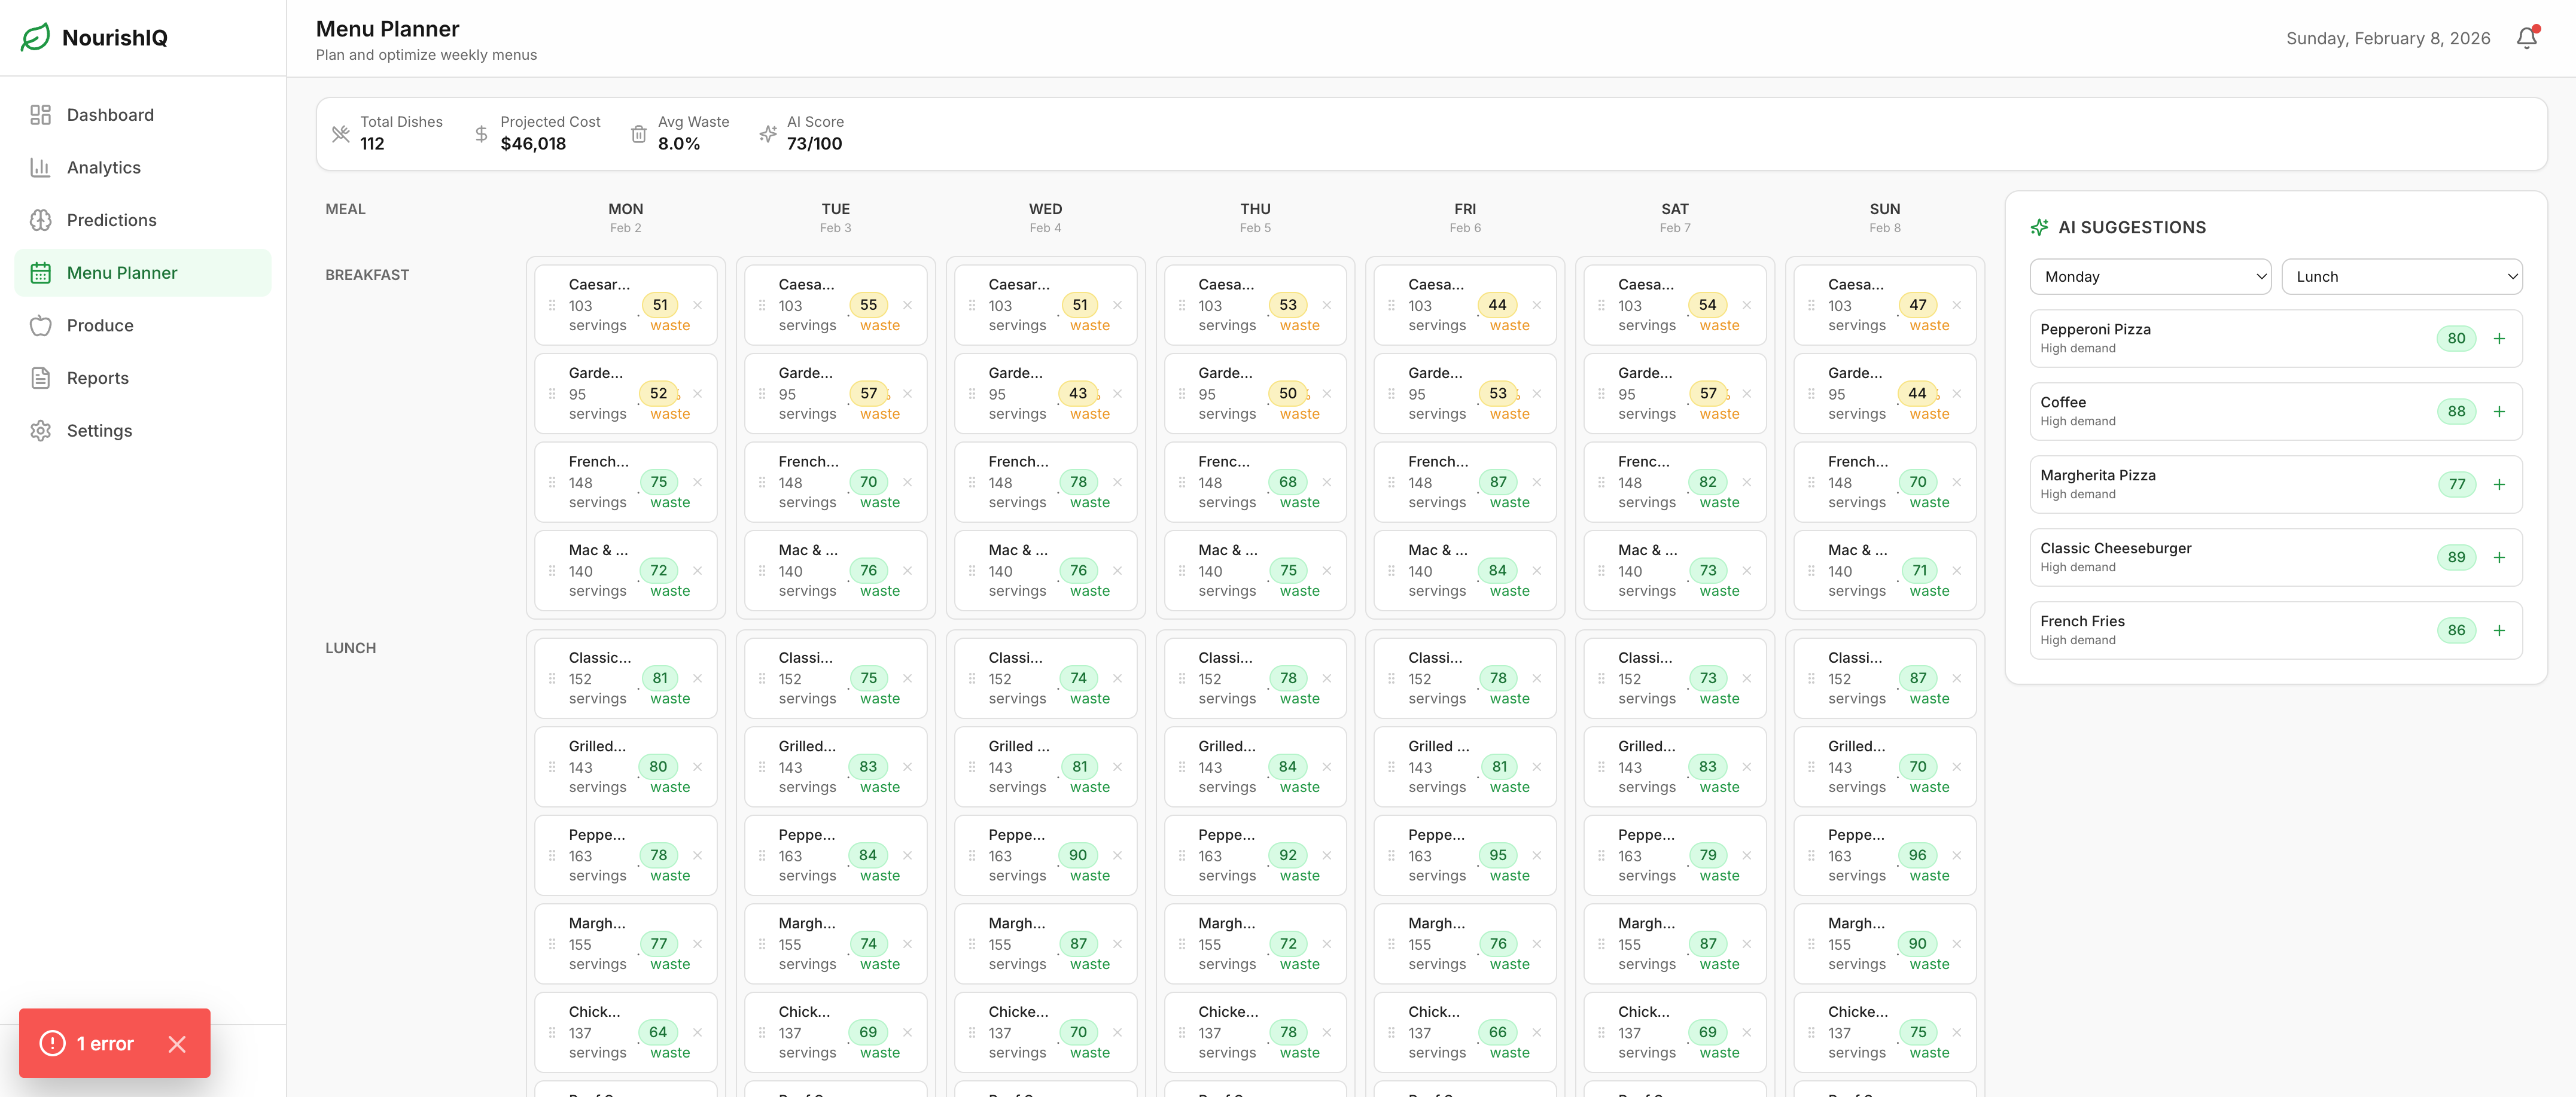
4. AI-Assisted Menu Planner
- Drag-and-drop weekly calendar interface
- Context-aware dish recommendations per time slot
- Live optimization score updates
- Multi-objective AI scoring (popularity + efficiency + nutrition)
5. Impact Reporting
- Weekly summaries, monthly reports, sustainability audits
- CO₂ → trees conversion (2.5 kg CO₂/kg waste)
- Water → showers conversion (1,500 L/kg waste)
- PDF export functionality
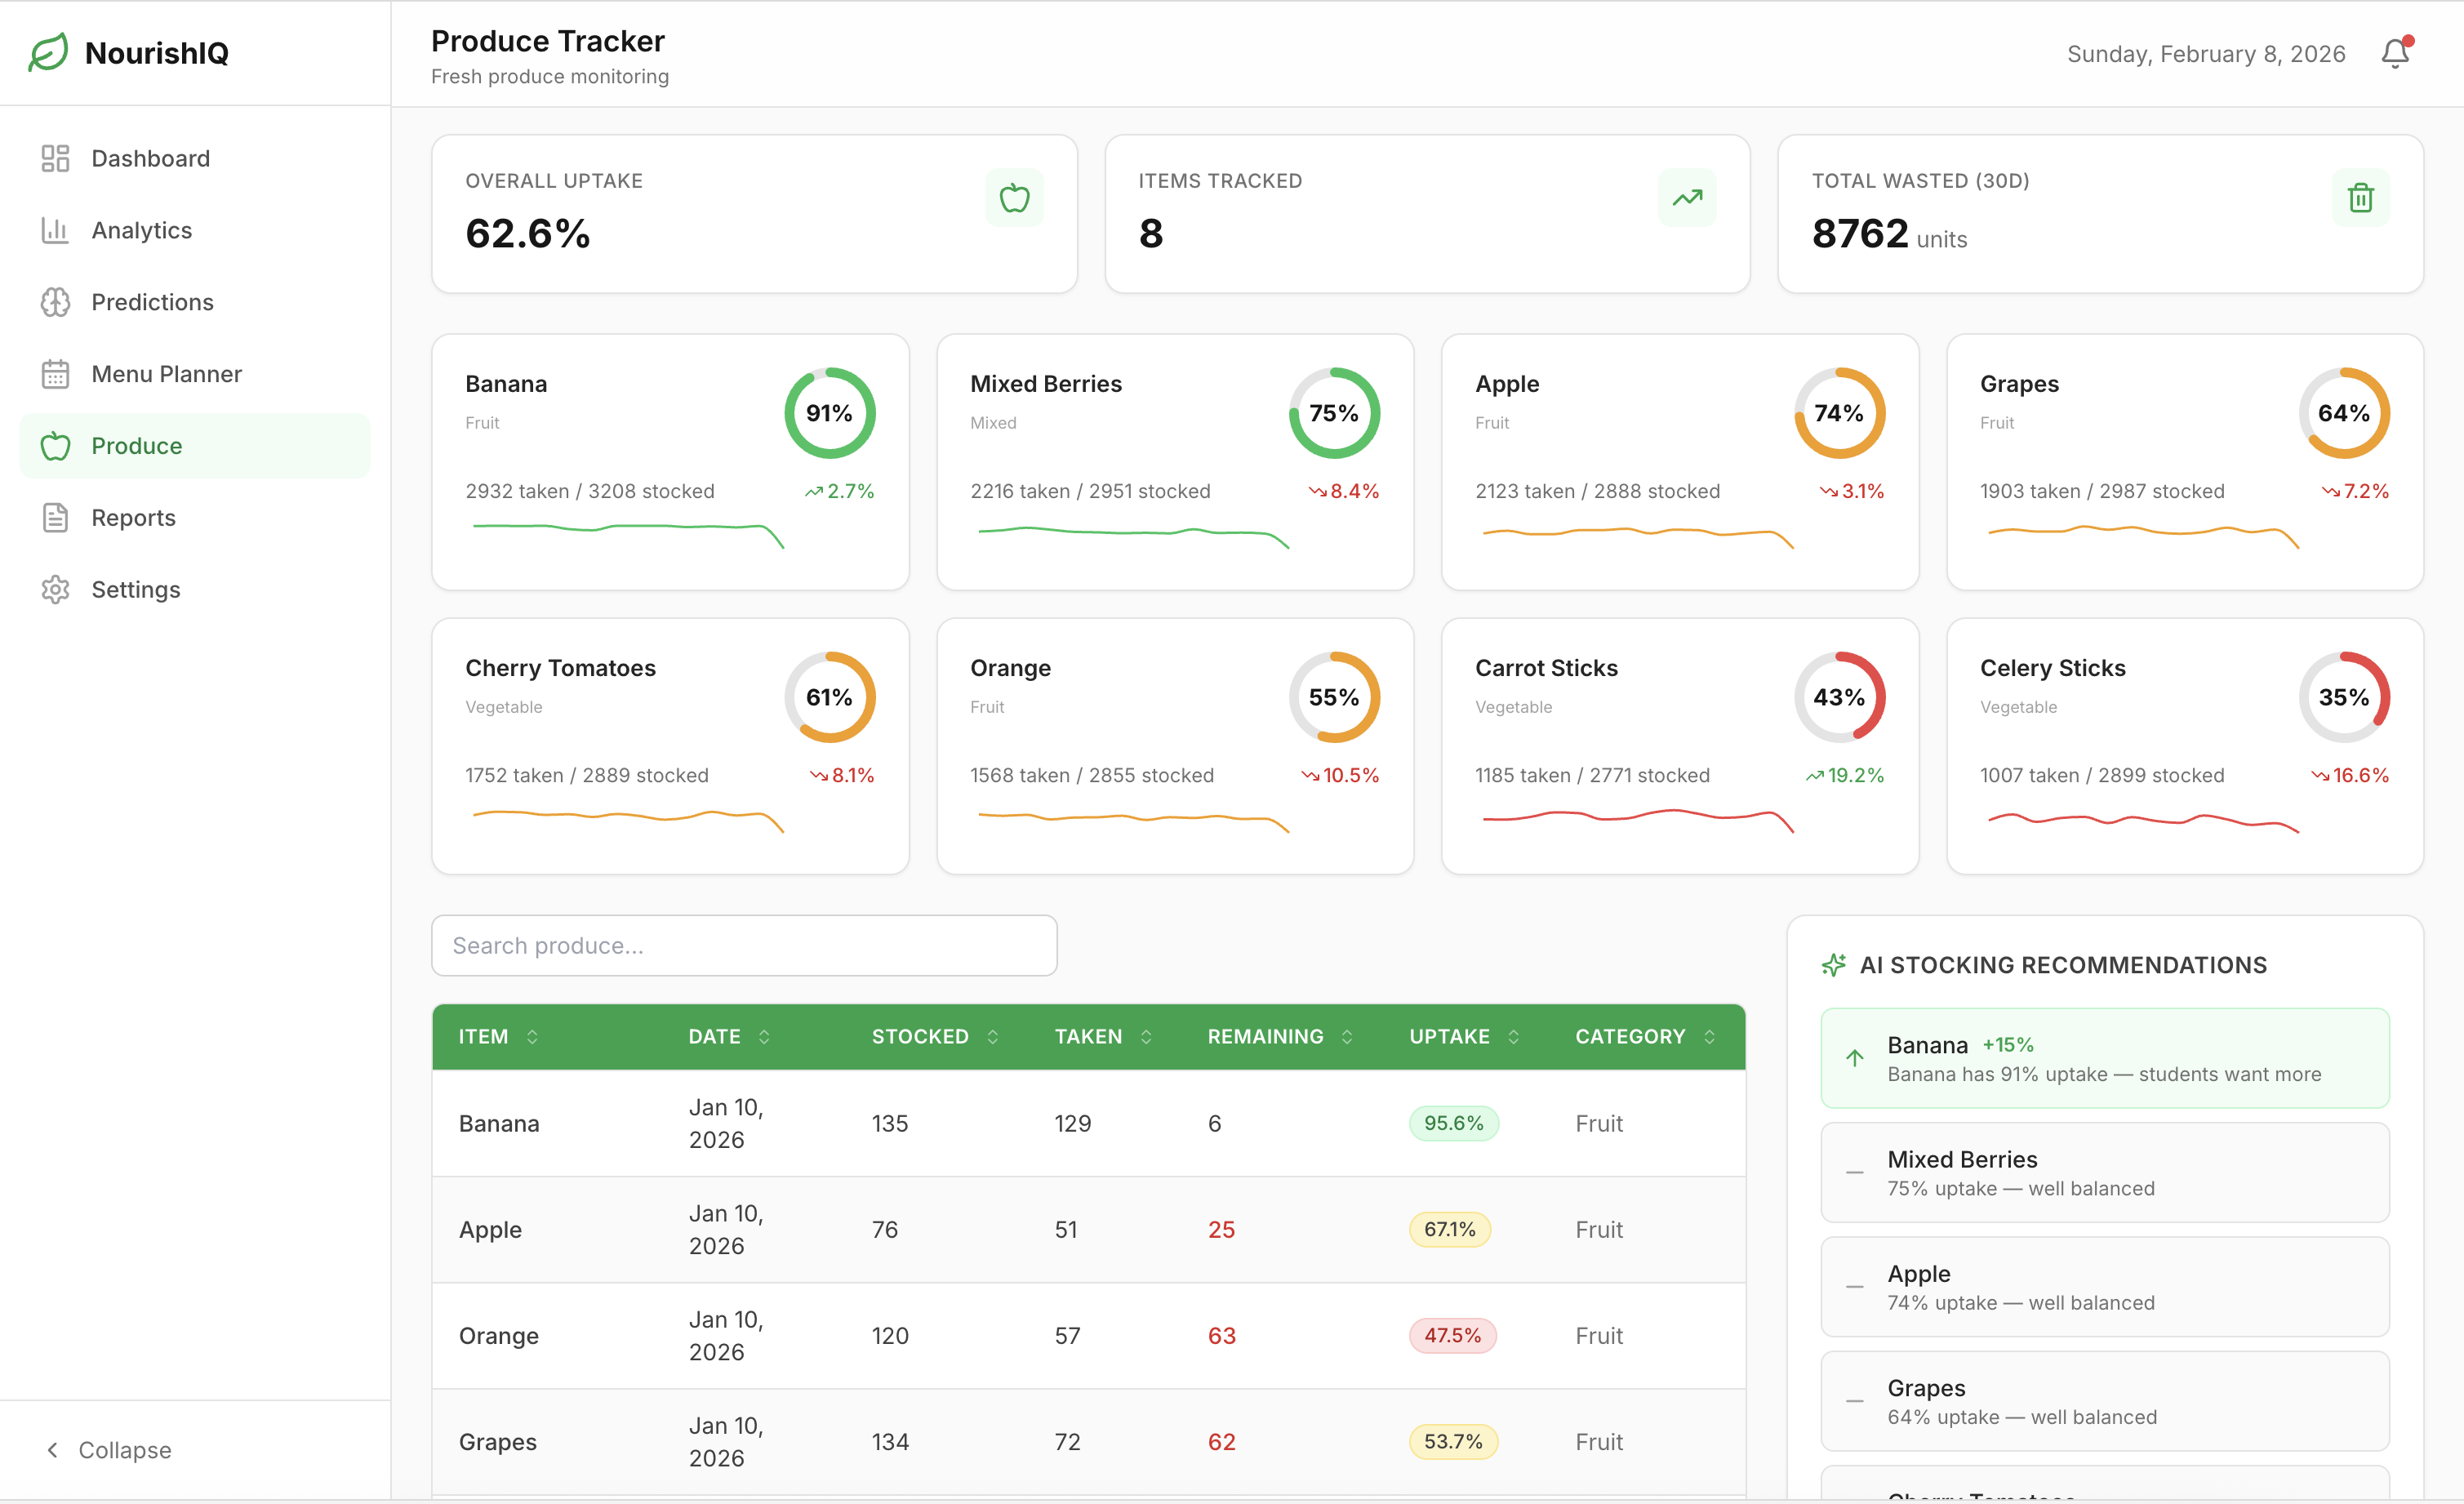
6. Produce Uptake Tracking
- 9-item fresh produce monitoring
- 7-day sparkline trends
- Uptake percentage with AI swap recommendations
- Data-driven phase-in/phase-out decisions
Impact Potential
Based on industry benchmarks and our AI models:
| Metric | Current State | With NourishIQ | Improvement |
|---|---|---|---|
| Waste Rate | 30-40% | 18-25% | ~40% reduction |
| Monthly Savings | — | $945/hall | $11,340/year |
| CO₂ Prevented | — | 1,200 kg/month | ~6 trees/month |
| Water Saved | — | 180,000 L/month | ~1,200 showers |
For a university with 5 dining halls, annual impact:
- $56,700 saved
- 7.2 tons CO₂ prevented
- 360 tree-equivalents
Future Enhancements
- Machine Learning Integration: Replace deterministic algorithms with trained models (LSTM for time series, gradient boosting for classification)
- IoT Integration: Connect to smart scales and RFID systems for automatic waste tracking
- Mobile App: Staff input interface for real-time adjustments
- Multi-Location Support: District-level dashboard for university system oversight
- Recipe Database: Integrate with nutrition APIs for automated nutritional scoring
- Student Feedback Loop: Dish rating system to improve popularity predictions
Credits & Frameworks
This project was built with the following open-source technologies:
Core Frameworks
- Next.js - React framework by Vercel
- React - UI library by Meta
- TypeScript - Typed JavaScript by Microsoft
UI Libraries
- Tailwind CSS - Utility-first CSS framework
- Recharts - Composable charting library
- @hello-pangea/dnd - Drag-and-drop library (maintained fork of react-beautiful-dnd)
- Framer Motion - Animation library
- Lucide React - Icon library
Development Tools
Algorithms & Concepts
- Demand forecasting methodology inspired by retail inventory management research
- Carbon footprint calculations based on EPA food waste standards
- Multi-objective optimization concepts from operations research literature
All AI algorithms were developed in-house. No external AI APIs were used.
Acknowledgments
We'd like to thank:
- Dining hall managers who shared insights during our research phase
- Sustainability officers who helped us understand carbon accounting
- The open-source community for the incredible tools that made this possible
Built for a sustainable future
Built With
- eslint
- framer-motion
- git
- hello-pangea/dnd
- lucide-react
- next.js-14
- node.js
- react
- recharts
- tailwind-css
- typescript

Log in or sign up for Devpost to join the conversation.